ウィリアムズ %R - 滑らか
作者: リン・ハーンチャオチャン, 日時: 2022-05-09 12:04:48タグ:WMAエイマ
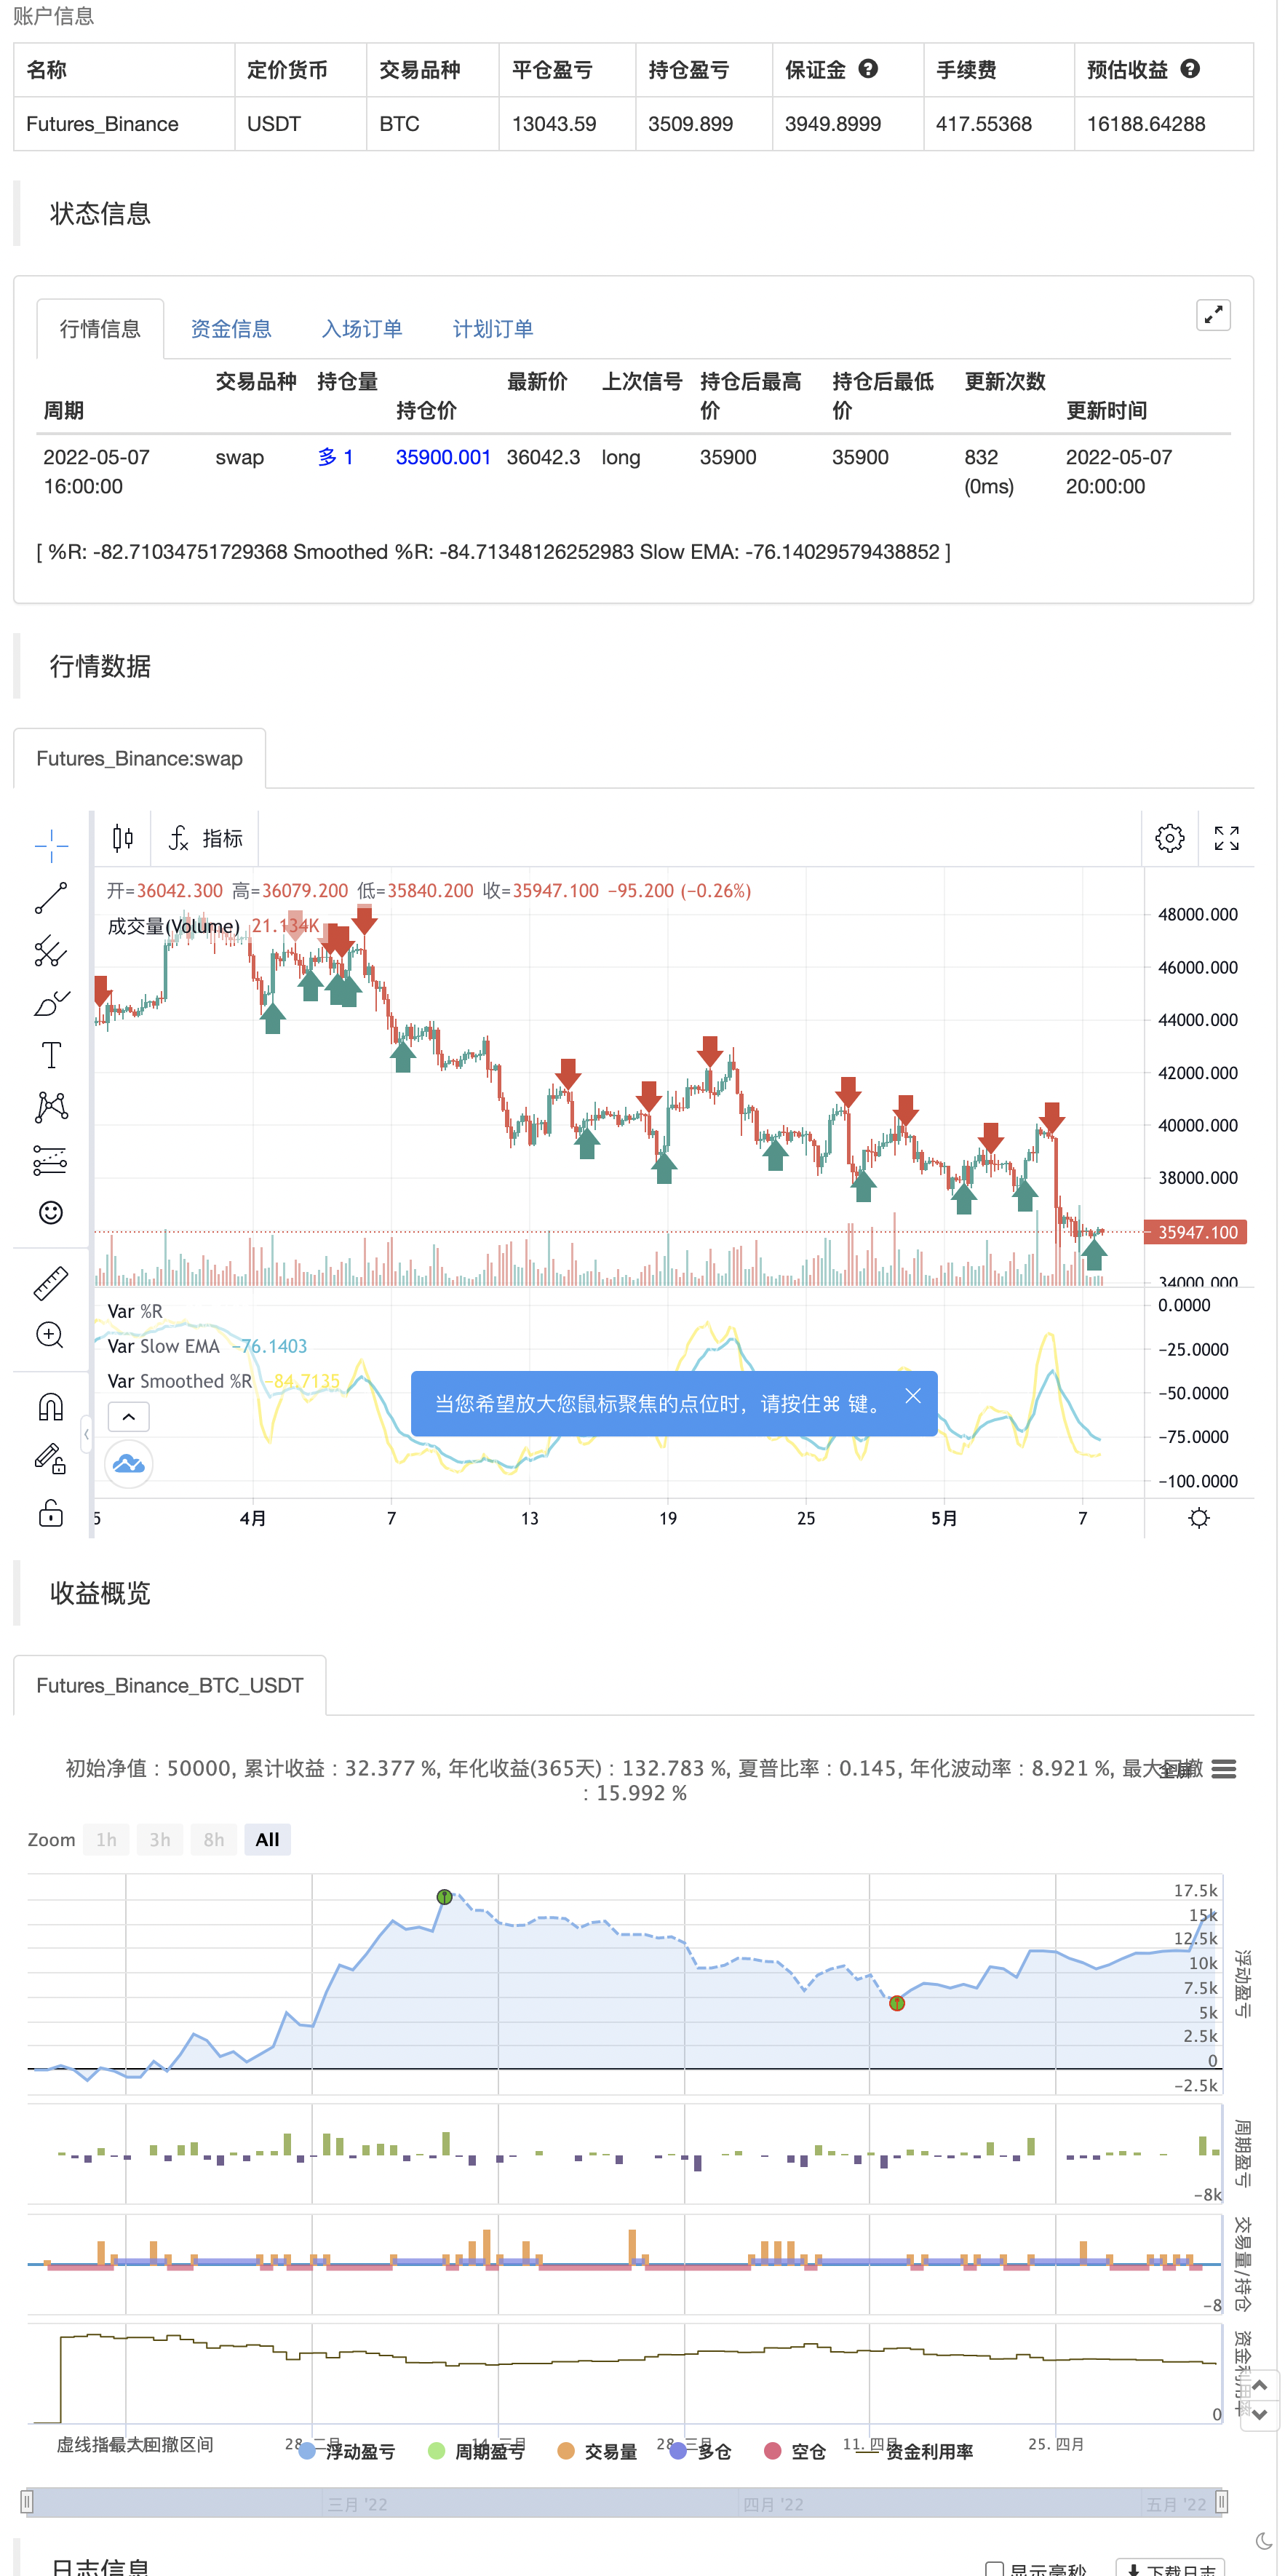
トレーディングビューの説明から ウィリアムズ%R (%R) は,技術分析において,主に過買い・過売りの条件を特定するために使用されるモメンタムベースの振動器である. %Rは,ユーザが定義した見返り期間の現在の閉店と最高値の比較に基づいている. %Rは0から-100 (マイナス値に注意してください) の間で振動し,ゼロに近い値が過買い状態を示し, -100に近い値が過売り状態を示します.典型的には,%Rは過買い・過売り状況および全体的なモメンタムの変化に基づいて設定を生成することができます.
特別なのは? この指標は,オリジナルのWilliams %R指標に2つの追加のEMAラインを追加します.デフォルトのEMA長さは5と13です.結果は,2つの滑らかな平均線で,読みやすくなります. この指標には以下の要素が含まれます.
- EMAの交差のシグナル. EMAの交差は,確認されたトレンド変化を示すのに役立ちます. 既定色は緑と赤です.
- 傾向逆転の信号は,より速いEMA線です. 既定色は青とオレンジです.
上昇/下落のクロスオーバーと逆転の警告が利用可能である.
楽しんで!
バックテスト
/*backtest
start: 2022-02-08 00:00:00
end: 2022-05-08 00:00:00
period: 4h
basePeriod: 15m
exchanges: [{"eid":"Futures_Binance","currency":"BTC_USDT"}]
*/

// This source code is subject to the terms of the Mozilla Public License 2.0 at https://mozilla.org/MPL/2.0/
// © platsn

//@version=5
indicator(title='Williams %R - Smoothed', shorttitle='The Smooth Willy')

// Williams %R
length = input.int(defval=34, minval=1)
upper = ta.highest(length)
lower = ta.lowest(length)

output = 100 * (close - upper) / (upper - lower)

fast_period = input(defval=5, title='Smoothed %R Length')
slow_period = input(defval=13, title='Slow EMA Length')

fast_ema = ta.wma(output,fast_period)
slow_ema = ta.ema(output,slow_period)

// Plot
//h1 = hline(-20, title='Upper Band')
//h2 = hline(-80, title='Lower Band')
//fill(h1, h2, title='Background', transp=90)

plot(output, title='%R', color=color.new(color.white, 80), linewidth=1)
plot(fast_ema, title='Smoothed %R', color=color.new(color.yellow, 0), linewidth=2)
plot(slow_ema, title='Slow EMA', color=color.new(color.aqua, 0), linewidth=2)

bullX = ta.crossover(fast_ema, slow_ema)
bearX = ta.crossunder(fast_ema, slow_ema)
bullreverse = fast_ema[2] > fast_ema[1] and fast_ema > fast_ema[1] and fast_ema < -30
bearreverse = fast_ema[2] < fast_ema[1] and fast_ema < fast_ema[1] and fast_ema > -70

plotX = input.bool(true, "Show EMA Crossovers")
plotRev = input.bool(true, "Show trend reversals")

//plotshape(plotX and bearX ,"Cross down", color=color.red, style=shape.triangledown, location = location.top, size =size.tiny, offset=-1)
//plotshape(plotX and bullX ,"Cross up", color=color.green, style=shape.triangleup, location = location.bottom, size =size.tiny, offset=-1)
//plotshape(plotRev and bearreverse ,"Bear reversal", color=color.orange, style=shape.triangledown, location = location.top, size =size.tiny, offset=-1)
//plotshape(plotRev and bullreverse ,"Bull reversal", color=color.blue, style=shape.triangleup, location = location.bottom, size =size.tiny, offset=-1)

//alertcondition(bearX,"Bearish Crossover", "Bearish cross on William %R")
//alertcondition(bullX,"Bullish Crossover", "Bullish cross on William %R")
//alertcondition(bearreverse,"Bearish Reversal", "Bearish Reversal on William %R")
//alertcondition(bullreverse,"Billish Reversal", "Bullish Reversal on William %R")

if plotRev and bullreverse
    strategy.entry("Enter Long", strategy.long)
else if plotRev and bearreverse
    strategy.entry("Enter Short", strategy.short)
関連性
- 低スキャナー戦略暗号化
- 移動平均値とボリンジャー帯に基づいた定量的な取引戦略
- RedK ボリューム加速方向エネルギー比
- HALFTREND + HEMA + SMA (誤った信号の戦略)
- スウィング・ハル/RSI/EMA戦略
- 移動平均のクロスアラート,多時間枠 (MTF)
- 最良の飲み込み+脱出戦略
- レッドK ダュアル・ヴァーダー エネルギーバー
- レッドKモメントバー
- レインボーオシレーター
もっと
- 大型スナッパーの警告 R3.0 + 変動状態の上昇 + TP RSI
- チャンデ・クロル ストップ
- CCI + EMAとRSIクロス戦略
- EMA バンド + leledc + ボリンガー バンド トレンドキャッチ戦略
- RSI MTF Ob+Os
- MACD ウィリー戦略
- RSI - 買って売るシグナル
- ハイキン・アシ 傾向
- HA 市場バイアス
- イチモク雲スムーズオシレーター
- QQEMOD + SSLハイブリッド + ワダアター爆発
- ストラットを購入/売却
- トリプルスーパートレンドとEMAとADX
- トム・デマルク 連続熱地図
- jma + dwma 多穀物による
- マジックMACD
- 信号によるZスコア
神 易波動率戦略 パイン語版 - 3EMA + ボーリンガー + PIVOT
- 多粒のバゲット