
概要
<unk>浪者戦略は,異なるトレンドフォロー戦略を組み合わせてより信頼性の高い取引シグナルを実現する組み合わせの戦略である. 123の逆転戦略とECO戦略を統合し,トレンドが確認された後により正確な取引シグナルを生成することを目的としている. この戦略は,<unk>浪者<unk>というサーファー選手の名前の由来で,市場波動の浪尖を<unk>めようとし,大盤を超えた余分な利益を得ることを意味する.
戦略原則
ウォーカー戦略は,逆転戦略とトレンドフォロー戦略の2つの異なるタイプの戦略を融合しています.
まず,123の逆転戦略は逆転戦略である.それはK線情報を使って,価格が逆転シグナルが出ているかどうかを判断する.昨日の閉盘価格が前日より高く,今日の閉盘価格が昨日より低く,同時に9日のSlow Kが50より低いとき,買入シグナルを発信する.昨日の閉盘価格が前日より低く,そして今日の閉盘価格が昨日より高く,同時に9日のFast Kが50より高いとき,売出シグナルを発信する.
第二に,ECO戦略はトレンドフォロー戦略である.これは,価格のK線の実体サイズと方向を動力を計算して,トレンドの方向を判断する.ECO指標が0以上は上昇傾向を示し,0未満は下降傾向を示している.
浪人戦略は2つの戦略信号を統合する.両戦略が同向信号を発信する時のみ,例えば,ECOが上昇傾向を示し,123逆転戦略も買い信号を発信する.そうすることで,単一戦略の判断ミスで取引損失を避けることができる.
優位分析
単一戦略に比べると, 浪人戦略は以下の利点があります.
-
逆転とトレンドの戦略を組み合わせて,長距離を短距離にすることで,取引シグナルをより信頼性のあるものにする. ECOは,トレンドが変化する前だけ逆転することを保証し,逆転シグナルがトレンドの途中で発生することを避ける.
-
123逆転策は,ストカスティック指標を用いて,超買超売り領域を判断し,ECO策は,価格動量の方向を判断し,両者は互いを補完し,誤判の可能性を減らすことができる.
-
二重フィルタリングメカニズムにより,両戦略が同じ方向に判断された場合にのみポジションを開くことを保証し,取引リスクを大幅に軽減します.
-
フレキシブルなパラメータ設定スペースが広く,異なる市場に対応してパラメータを調整し,より広範な市場環境に適応できます.
-
取引の機会を捉えるために,日内反転と中長線の傾向を判断する複数の時間枠を使用します.
リスク分析
浪人策は,複数の策略を組み合わせて単一の策略のリスクを軽減しますが,取引には以下のリスクがあります.
-
123反転策は震動状況に対する判断が弱く,連續的な反転シグナルが生み出され,損失が増加する可能性がある.
-
ECO戦略は,量エネルギー不足の時に効果が悪く,低量環境での使用は避けるべきである.
-
双策のフィルタリング信号は,策が単独で発する部分的な利益信号を逃す可能性があります.
-
パラメータ設定が不適切である場合,戦略が誤った信号を発する可能性があります. 戦略が異なる市場に対応するためにパラメータを調整する必要があります.
-
戦略は,重大ブラック・スウェン事件などの特定の市場状況に適応できない場合があります.
最適化の方向
ウォーキング戦略の改善には,さらに多くの余地があります.
-
損失が止まるポイントに達したときに自動的に止まるストップ・ロズ戦略を導入することも考えられます.
-
異なる均線参数をテストして,より安定した参数組み合わせを探せます.
-
機械学習に基づくパラメータ自在化最適化を試み,戦略パラメータを動的に調整する.
-
信号の精度をさらに向上させるため,より多くの補助判断を補助する Auxiliary Strategies を追加できます.
-
異なる市場環境における安定性をテストし,より広範な市場に対応するためにパラメータを調整する.
-
自動実行と反省システムを開発し,より厳格な戦略の最適化を行うことができます.
要約する
総括すると,<unk>回策とトレンドフォロー策を統合して取引信号の二重確認を行うことで,トレンドの変化を捉えながら信号の正確性を向上させ,大幅を超えた余剰収益を期待できる.一定のリスクは依然として存在しますが,継続的な最適化により,より広範な市場環境に適応できます.この戦略は,柔軟性があり,リスクが制御可能な特性が強く,長期にわたって安定した収益を追求する投資家に適しています.
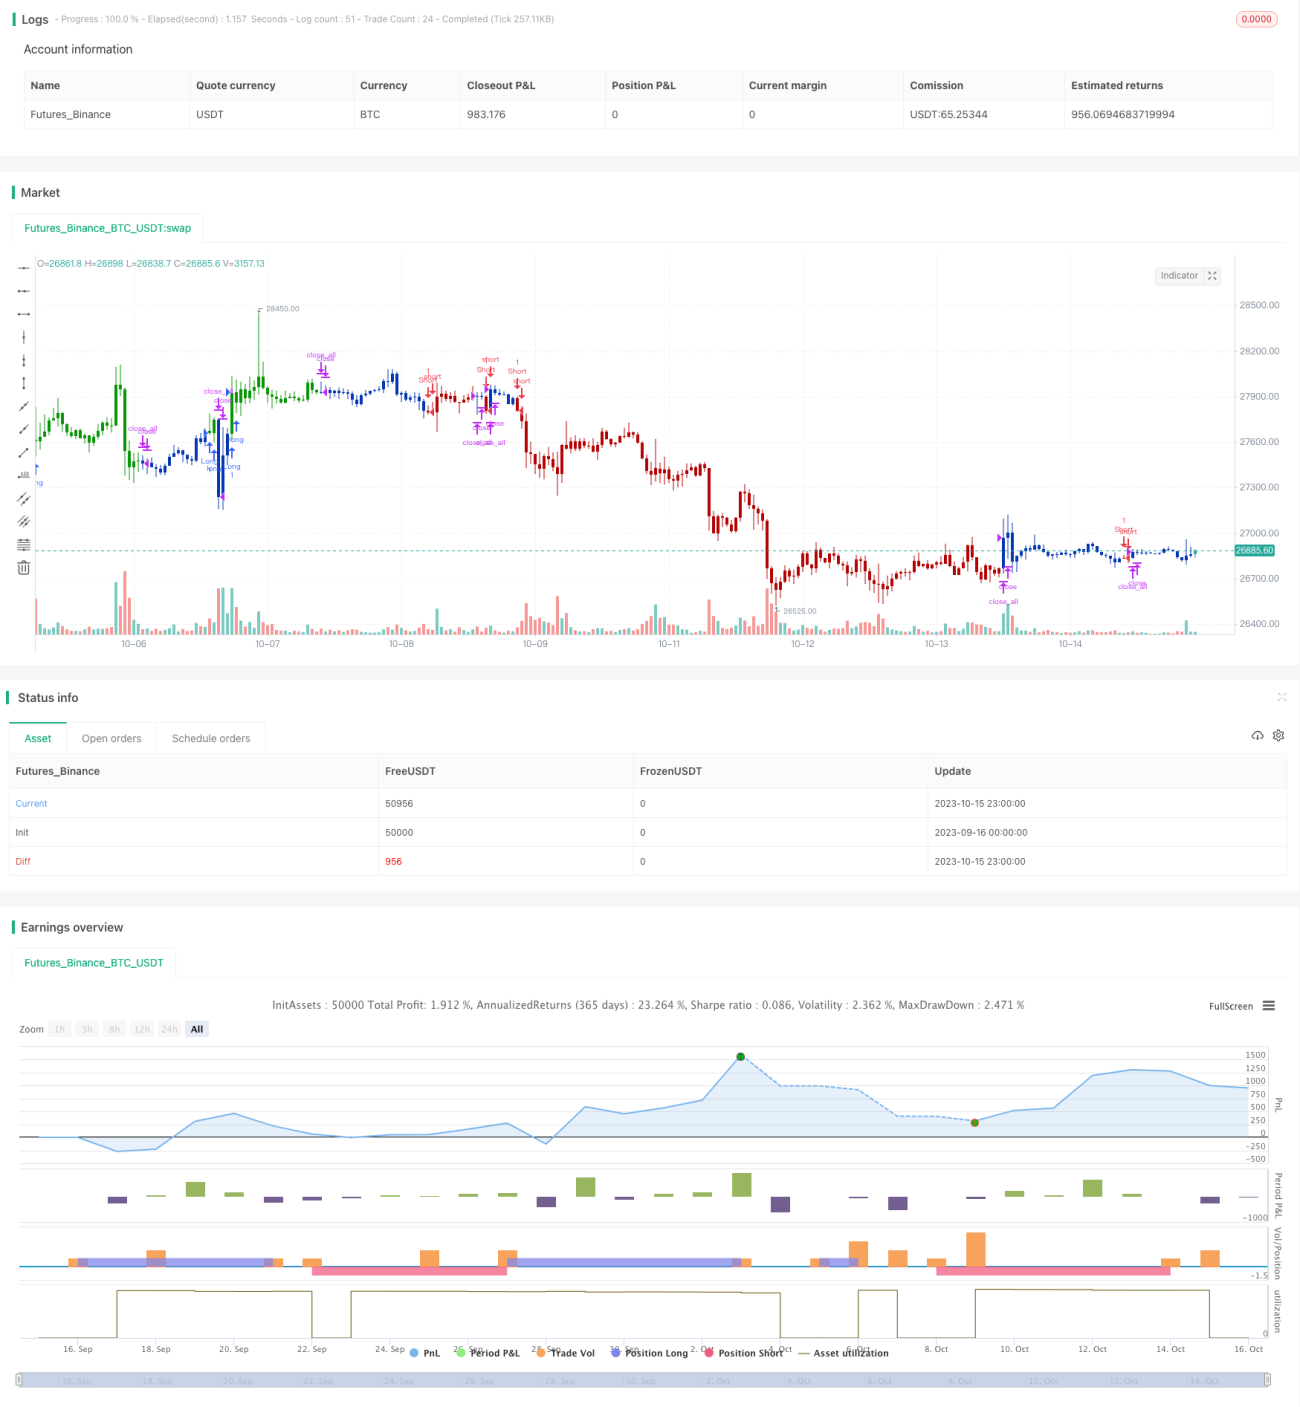
/*backtest
start: 2023-09-16 00:00:00
end: 2023-10-16 00:00:00
period: 1h
basePeriod: 15m
exchanges: [{"eid":"Futures_Binance","currency":"BTC_USDT"}]
*/

//@version=4
////////////////////////////////////////////////////////////
//  Copyright by HPotter v1.0 16/04/2020
// This is combo strategies for get a cumulative signal. - 1