オープニング主導戦略


作成日: 2023-10-23 15:13:49 最終変更日: 2023-10-23 15:13:49
コピー: 1 クリック数: 694
1
フォロー
1617
フォロワー

オープニング主導戦略

概要

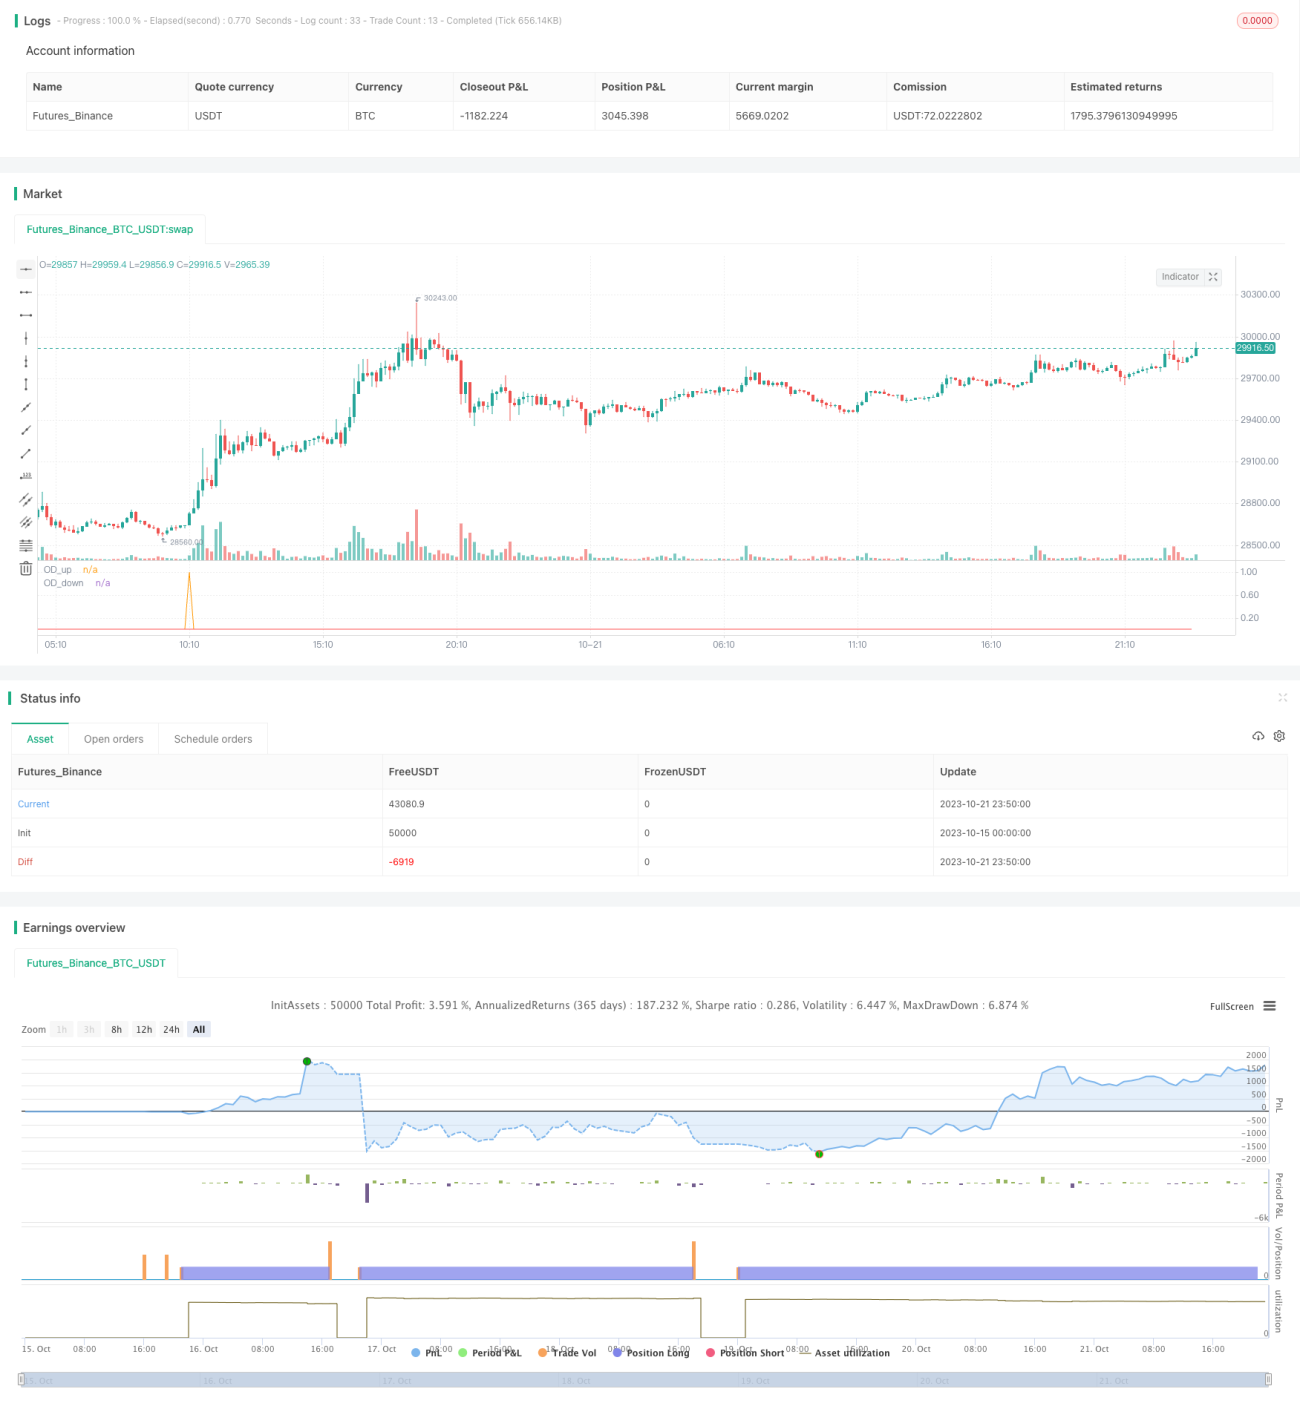
オープニングドライブの戦略は,取引日のオープニング後の最初の30分間の価格行動を観察して,価格の強い突破方向を識別し,その後その方向へのトレンド取引を行う.この戦略は,主にオープニング後の流動性と取引量の増加を利用し,大きな価格変動と方向性の力を生み出すことができる.

戦略原則

  1. この戦略は30分間のK線を使用しており,開盤後の価格行動を判断するのに十分な時間帯が必要である.

  2. 以下の営業時間のK線を識別する: 0700-0715,0800-0815,1300-1315 ,1430-1445

  3. 開盤K線が以下の条件を満たしているかどうかを判断する.

    • オープニング価格はK線の最低値に近い,クロージング価格は最高値に近い (長K線)

    • スタート価格が最高値に近づいて,終了価格が最低値に近づいて (短いK線)

    • そして,このK線の最高値は,以前の5K線の最高値の1倍範囲を超えた,または最低値は,以前の5K線の最低値の1倍範囲を下回った ((突破があることを示している)

  4. 上記の条件が成立するならば,K線発生後に3番目のK線が,その方向へのトレンド取引を行う.

  5. Kラインの最高値または最低値として設定します.

  6. ポジションは3Kラインの後に出発,つまり90分.

優位分析

  • オープン後の流動性の高い特性を利用して,より大きな方向性を捉える
  • フィルタリング条件を突破することで,振動傾向から発生する偽信号を回避できます.
  • 高い時間周期で過度の取引をフィルターする
  • 損失拡大を防ぐために停止設定

リスク分析

  • 固定開場区間の時間帯は,トレンドに突破されるリスクがある
  • 突破値の設定が不適切で,有効な信号の一部が削除される
  • 固定保有期間は,特定の状況に応じて調整できません.
  • 移動停止がないので,トレンドは追跡できません.

考えるべきことは:

  • より多くのパラメータを動的に使用して開盤区間を決定する
  • 突破値パラメータを最適化
  • ポジション保持時間は変動に応じて調整されます.
  • モバイル・ストップを追加

最適化の方向

  • 信号の質を向上させるため,より多くの指標を組み合わせてトレンドの方向性を判断できます.
  • 低時間での入場により,より高い頻度で操作できます.
  • 回測結果に基づいて,開拓区間,突破値,ストップダメージ設定などのパラメータを最適化できます.
  • ダイナミック・ストップ,移動・ストップ,再入場などの戦略を考慮して収益を上げる
  • 複数の品種を試して,最適の品種を決定できます.

要約する

オープニングドライブの戦略は,オープニング後の価格の強い突破方向を捉えることでトレンドを追跡する.ランダムな入場と比較して,リスクとリターンの優れた特性を有する.重要なことは,パラメータの設定を把握し,適切な品種を選択し,あまりにも頻繁な入場を避ける一方で,利益の確率を高めることです.この戦略は,適切な補助分析に基づいて,経験豊富なトレーダーに適しています.

ストラテジーソースコード
/*backtest
start: 2023-10-15 00:00:00
end: 2023-10-22 00:00:00
period: 10m
basePeriod: 1m
exchanges: [{"eid":"Futures_Binance","currency":"BTC_USDT"}]
*/

// This source code is subject to the terms of the Mozilla Public License 2.0 at https://mozilla.org/MPL/2.0/
// © Marcns_

//@version=5
// a script that highlights open drives around cash market opens throughout the day
// this indicator identifies the following cash open, open drives 0700 - 0715 / 0800 - 0815 / 1300 - 1315 / 1430 - 1445 
// an open drive is when a cash market opens and price runs either up or down away from the opening price, often this will be the high or the low the remainer of the session or day
// and often identify a trend session
strategy("Open Drive", commission_type =  strategy.commission.cash_per_contract, commission_value = 3.8 )

// open drive filter times - all times GMT
eu_sev = time(timeframe.period, "0700-0715", "GB")
eu_eig = time(timeframe.period, "0800-0815", "GB")
us_one = time(timeframe.period, "1300-1315", "GB")
us_two = time(timeframe.period, "1430-1445", "GB")


// identify bar that opens at low and closes at high + vice versa 
// bar needs to open at one extreme and close at another 
TrndExThreshold_Open = 0.15
TrndExThreshold_Close = 0.15

// add a bar range expansion filter - range of bar correlates to volume, high volume = wider range. This script will be able to filter for a break of a 5 bar range +100% or -100%

fbhi = ta.highest(5)
fblo = ta.lowest(5)

fbr = (fbhi - fblo)

RangeEx_up = 0.0

if high >= (fbhi[1] + fbr[1])
    RangeEx_up := 1.0
else
    na

// range ex down

RangeEx_do = 0.0

if low <= (fblo[1] - fbr[1]) 
    RangeEx_do := 1.0
else
    na


//#1 open within 5% of low

OpenAtLow = 0.0 

if (close > open) and (open-low) / (high-low) < TrndExThreshold_Open
    OpenAtLow := 1.0
else 
    na 

//#2 close within 5% of high
    
CloseAtHigh = 0.0

if (close > open) and (high-close) / (high-low) < TrndExThreshold_Close
    CloseAtHigh := 1.0
else
    na 

OD_Up = 0.0

if (OpenAtLow + CloseAtHigh + RangeEx_up == 3.0) and ( eu_sev or eu_eig or us_one or us_two)
    OD_Up := 1
else
    na

plot(OD_Up, title = "OD_up")


OpenAtHigh = 0.0 

if (close < open) and (high-open) / (high-low) < TrndExThreshold_Open
    OpenAtHigh := 1.0
else 
    na 

//#2 close within 5% of high
    
CloseAtLow = 0.0

if (close < open) and (close-low) / (high-low) < TrndExThreshold_Close
    CloseAtLow := 1.0
else
    na 

OD_Down = 0.0

if (OpenAtHigh + CloseAtLow + RangeEx_do == 3.0) and ( eu_sev or eu_eig or us_one or us_two)
    OD_Down := -1
else
    na

plot(OD_Down, title = "OD_down", color = color.red)


//3sma

ma = ta.sma(close,3)

// one time framing - highlight bars the make a series of lower highs or higher lows to identify trend 
// one time frame up 
otf_u = 0.0

if close > ma and close[1] > ma[1]
    otf_u := 1
else
    na
// one time frame down 
otf_d = 0.0

if close < ma and close[1] < ma[1]
    otf_d := 1
else
    na


//bgcolor(otf_u ? color.rgb(76, 175, 79, 70) : na)
//bgcolor(otf_d ? color.rgb(255, 82, 82, 66) : na)

// record high and low of entry bar into variable for absolute stop
// buy stop
bs = 0.0

if OD_Up
    bs := low[1]
else
    na

// sell stop
ss = 0.0

if OD_Down
    ss := high[1]
else
    na


// strategy entry and exits 
// long
if OD_Up
    strategy.entry("el", strategy.long, 2)
if ta.barssince(OD_Up)> 3 
    strategy.exit(id = "ex" , from_entry = "el", limit = close)

// short 
if OD_Down
    strategy.entry("es", strategy.short, 2)
if ta.barssince(OD_Down)> 3
    strategy.exit(id = "ex" , from_entry = "es", limit = close)