ボリンジャーバンドに基づくトレンド反転戦略

概要
この戦略は,ブリン帯の指標と移動平均に基づいて,価格がブリン帯の下線に近づいているかどうかを判断し,価格がブリン帯の上線を突破したときに空を見上げ,価格がブリン帯の下線を突破したときに空を見上げます.それは,トレンドの逆転とブリン帯の下線を突破した時の2つの取引戦略の優位性を組み合わせて,トレンドの揺れ動いたときにより良い利益を得ることができます.
原則
この戦略は,以下の2つの入場信号を判断します.
-
多頭シグナル:閉盘価格が下線に触れて,閉盘価格がEMA平均線より高く,前K線実体が陰線,現在のK線実体が陽線であるときに多行する.
-
空頭シグナル:閉盘価格が上線に触れ,閉盘価格がEMA平均線より低いとき,前K線実体が陽線,現在のK線実体が陰線であるとき空空する.
止損方法:固定止損. 止損点は,入場価格から相手側の軌道距離のリスク・リターン係数倍である.
止<unk>方法:目標<unk>利を相手側の軌道に。つまり多止<unk>を下軌道に,空止<unk>を上軌道に。
利点
-
トレンドと逆転戦略の優位性を組み合わせて,トレンドの揺れの中でのパフォーマンスを向上させる.
-
ブリン帯の指標を使って,過剰買いと過剰売りを判断し,逆転の機会を正確に判断する.
-
固定ストップポイントは合理的に設定され,リスク管理に役立ちます.
-
移動式停止は利潤を最大化します.
リスク
-
突破型戦略は利回りしやすいので,偽突破に注意してください.
-
ストップダストは,状況が不安定なときに頻繁に発生する可能性があります.
-
固定ストップは市場の変動に合わせて調整できないし,過度に緩やかまたは過度に激進的かもしれない.
-
ブリン帯のパラメータが設定されていない場合,効果が悪くなる可能性があります.
思考を最適化する
-
組み合わせRSI指標のフィルタリング入力信号を考慮することができる.例えば,RSIが50以上なら再多行し,RSIが50未満なら再空行し,誤信号を回避することができる.
-
固定ストップ距離を自動的に調整する機能を追加し,ストップ距離をより柔軟にします.例えば,ATR指標に基づいてストップ距離を動的に設定します.
-
ブリン帯のパラメータを最適化して,最適なパラメータの組み合わせを探します.
-
EMA平均線の異なるパラメータをテストして平均線の護城河効果を最適化することができる.
要約する
この戦略は,トレンドと逆転を総合的に考慮し,ブリン帯を利用して超買い超売りポイントの入場を判定し,移動ストップにより利益を最大化する.傾向の揺動の状況で優れたパフォーマンスを発揮する.しかし,策略の効果を最適化するためにパラメータを調整する一方で,策略の効果を調整する注意が必要である.全体的には,比較的実用的で高効率な策略である.
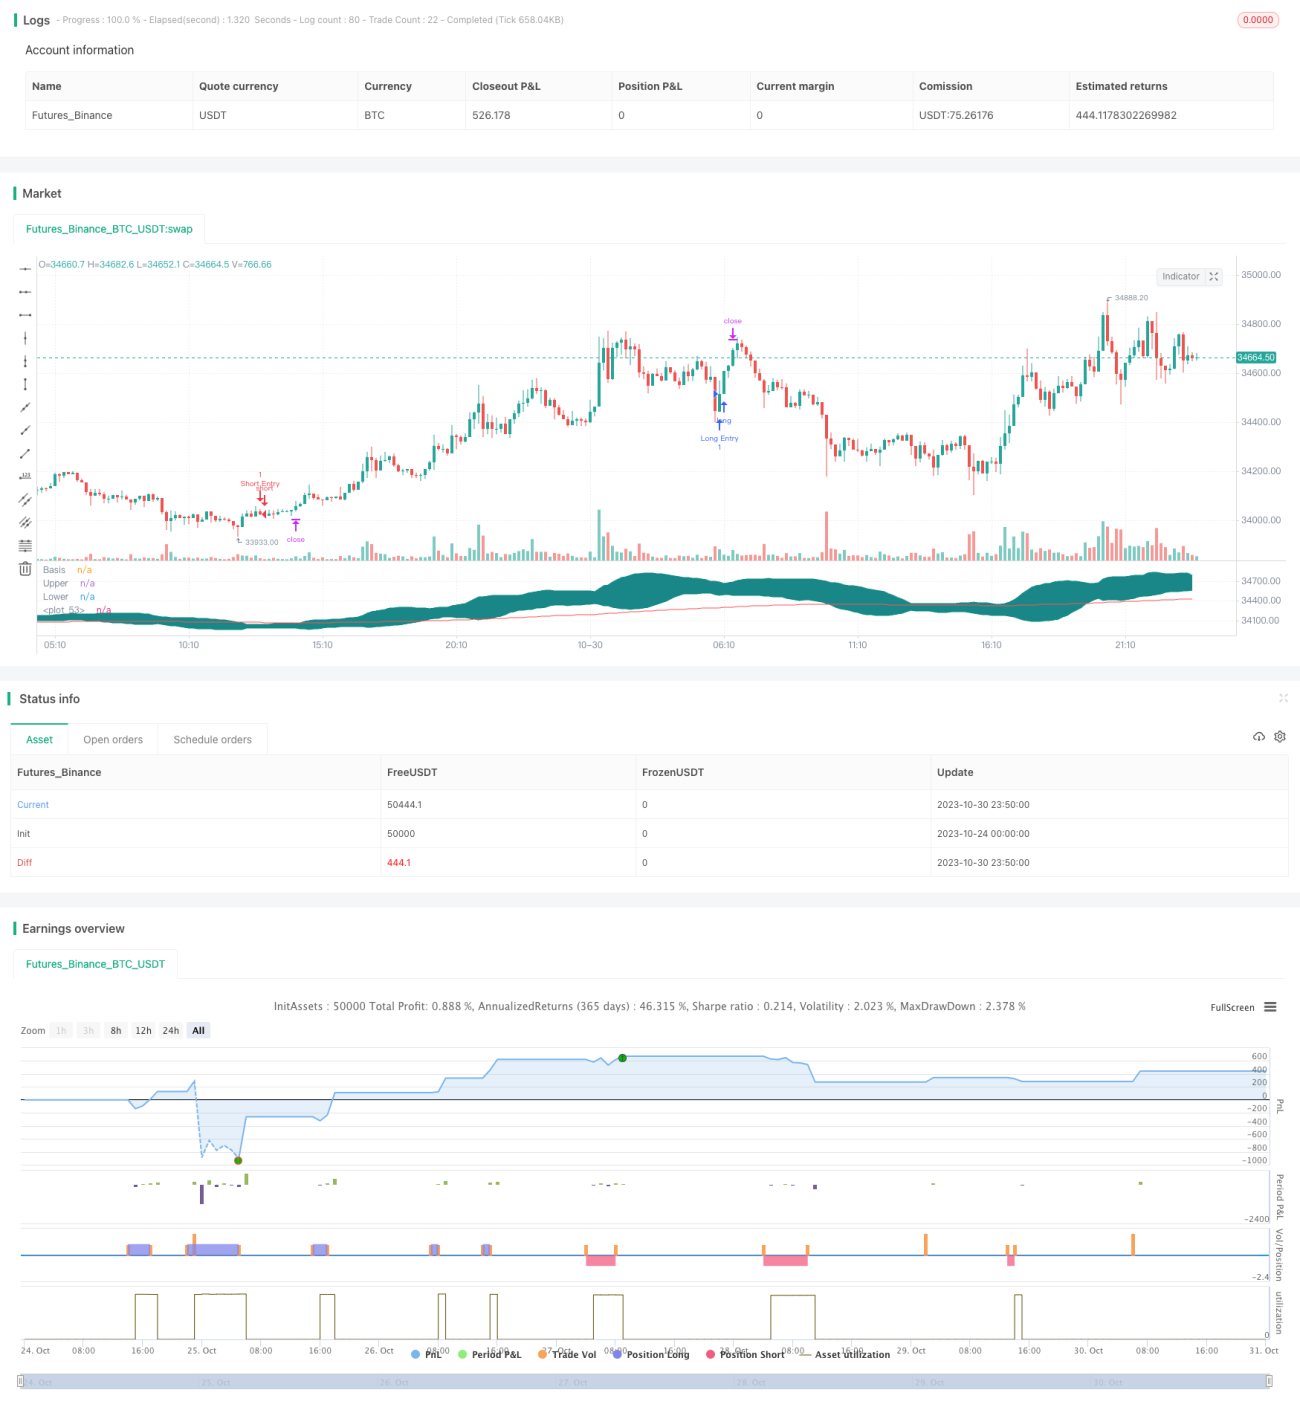
/*backtest
start: 2023-10-24 00:00:00
end: 2023-10-31 00:00:00
period: 10m
basePeriod: 1m
exchanges: [{"eid":"Futures_Binance","currency":"BTC_USDT"}]
*/

//@version=4

// Welcome to yet another script. This script was a lot easier since I was stuck for so long on the Donchian Channels one and learned so much from that one that I could use in this one
// This code should be a lot cleaner compared to the Donchian Channels, but we'll leave that up to the pro's- 1