
波浪策略 (Bollinger Bands Strategy) は,ブルリン線波動帯を利用してトレンドを追跡し,オーバーバイオーバーセール信号を行うクラシック策略である.このバージョンは,元の策略の基礎に,リスク管理のためのストップ・メカニズムを追加している.
策略は,ブリン帯の上下軌の金叉死叉で市場の超買超売を判断し,ブリン帯を追跡してトレンドを追跡する.ブリン帯の上軌と下軌の間の領域は,現在の市場の波動範囲を反映する.ブリン帯は,中軌,上軌と下軌から構成され,中軌はn日間の単純移動平均で,上軌と下軌は,中軌のk倍加減のn日間の標準差によって決定される.
ブリン帯は,市場の波動率と振動幅を反映する技術的指標である.価格がブリン帯下線近くにちょうど触れたとき,市場が超売り状態にあることを示す.このとき,連続的に発生する隙間が補填される可能性が高い.回帰特性に基づいて,多項ポジションの構築を考慮すべきである.価格がブリン帯上線近くにちょうど触れたとき,市場が超買い状態にあることを示す.このとき,価格が逆転の下の動きが生じる可能性がある.下線状態の利益を得るために空頭ポジションの構築を考慮すべきである.
この戦略は,ブリン帯の超買超売シグナルを実現し,トレンドフォローポジションを確立し,リスクを制御するためにストップダメージメカニズムを追加した.
価格が上からブリン帯を横切ったとき,市場が超売り領域から合理領域に入っていることを示し,このとき多頭ポジションを確立することができる.価格が下からブリン帯を横切ったとき,市場が超買い領域に入っていることを示し,このとき空頭ポジションを確立することができる.
ポジションを確立した後,固定パーセントのストップポイントを設定してリスクを制御する. ストップポイントが設定されたストップ幅を超えると,現在のポジションを退出し,過大な損失を避ける.
この戦略はブリン帯の指標と組み合わせて,価格と上下線の交差を判断することで,超買いと超売り領域を判断する.
ブリン帯の波動性の特性を利用してトレンド追跡取引
単一取引の最大損失を効果的に制御するための最大損失防止メカニズムの追加
トレンド追跡とストップを組み合わせて,安定した利益を得ることができます.
ブリン帯のパラメータ設定は取引信号の質に影響する。中軌道の長さnと標準差倍数kは,異なる市場に応じて合理的に設定する必要があり,そうでなければ取引信号の精度に影響する。
止損設定が大きすぎすぎても収益の安定性に影響する.止損幅が大きすぎても単一損失のリスクが大きくなり,小さすぎても止損が誘発される確率が増加する.異なる品種に応じて合理的な止損設定の割合が必要である.
他の指標と組み合わせたシグナルフィルタリングを考慮して,取引シグナルの正確性を向上させることができる.
異なるポジションの時間設定をテストすることができる.例えば,時間単位またはより短い周期のブリン帯を組み合わせて,より高い頻度で取引し,資金使用効率を向上させる.
この戦略は,ブリン帯判定超買超売り領域を構えるポジションを確立し,止損を増やすことでリスクを制御する,一般的なトレンドフォロータイプ戦略である.最適化パラメータ設定と,より正確な取引信号と止損レベル設定を組み合わせて,安定した利益を得ることができる.
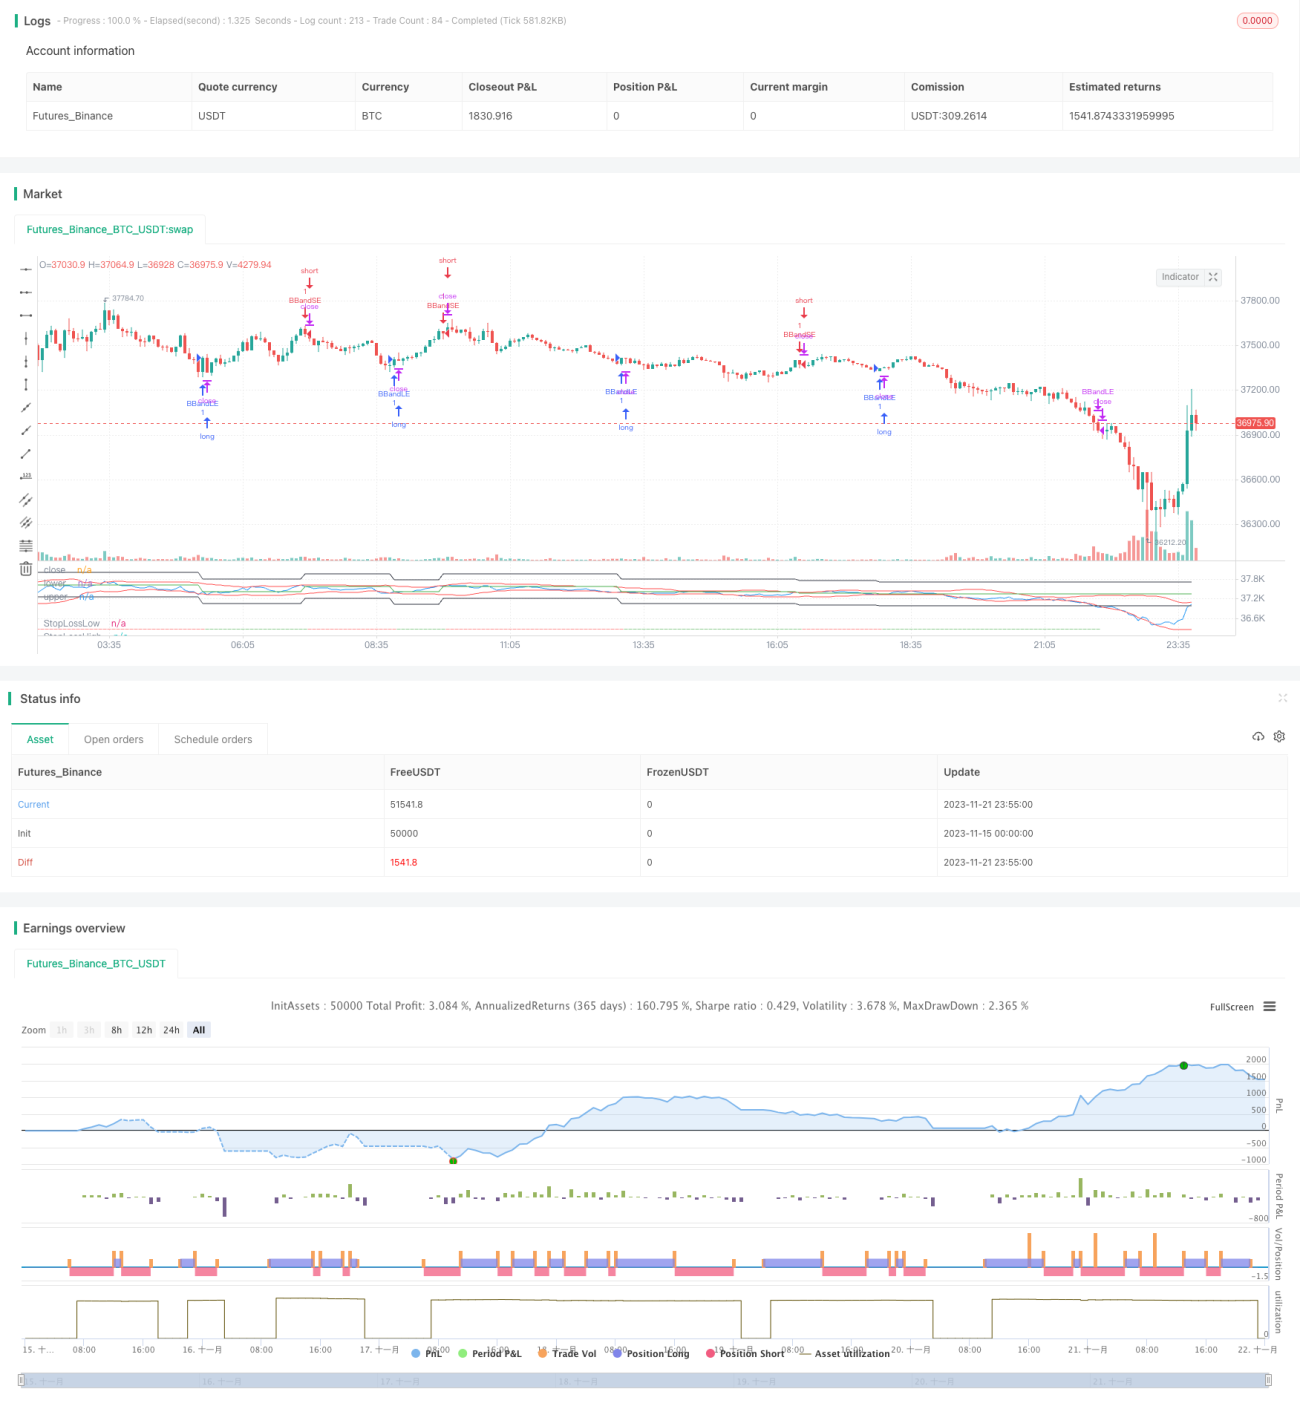
/*backtest
start: 2023-11-15 00:00:00
end: 2023-11-22 00:00:00
period: 5m
basePeriod: 1m
exchanges: [{"eid":"Futures_Binance","currency":"BTC_USDT"}]
*/
//@version=5
strategy(title="Bollinger Bands Strategy", overlay=false, shorttitle="BBS", pyramiding=0, currency=currency.USD, commission_type=strategy.commission.percent, commission_value=0.03, initial_capital=1000)
source = input(close, "Source")
length = input.int(20, minval=1)
mult = input.float(2.0, minval=0.001, maxval=50, step=0.001)
stopLossFactor = input.float(1, "Stop Loss Percent", maxval = 100, minval = 0, step=0.1)
basis = ta.sma(source, length)
dev = mult * ta.stdev(source, length)
upper = basis + dev
lower = basis - dev
var float lastTradePrice = na
var float stopLossLow = na
var float stopLossHigh = na
var bool currentIsLong = na
var bool nextExpectedIsLong = true
var bool existedLong = false
var bool existedShort = false
buyEntry = ta.crossover(source, lower)
sellEntry = ta.crossunder(source, upper)
if (buyEntry and nextExpectedIsLong == true)
strategy.entry("BBandLE", strategy.long, comment="BBandLE")
nextExpectedIsLong := false
if(nz(strategy.position_size[1], 0) < 0) // new position detected
lastTradePrice := close
stopLossLow := lastTradePrice * (1 - (stopLossFactor / 100))
stopLossHigh := lastTradePrice * (1 + (stopLossFactor / 100))
else
strategy.cancel("BBandLE")
if (sellEntry and nextExpectedIsLong == false)
strategy.entry("BBandSE", strategy.short, comment="BBandSE")
nextExpectedIsLong := true
if(nz(strategy.position_size[1], 0) > 0) // new position detected
lastTradePrice := close
stopLossLow := lastTradePrice * (1 - (stopLossFactor / 100))
stopLossHigh := lastTradePrice * (1 + (stopLossFactor / 100))
else
strategy.cancel("BBandSE")
strategy.close("BBandLE", close < stopLossLow)
strategy.close("BBandSE", close > stopLossHigh)
// if(nz(strategy.position_size[1], 0) < 0 and close > stopLossHigh)
// strategy.entry("BBandLE", strategy.long, comment="BBandLE")
// lastTradePrice := close
// stopLossLow := lastTradePrice * (1 - (stopLossFactor / 100))
// stopLossHigh := lastTradePrice * (1 + (stopLossFactor / 100))
// if(nz(strategy.position_size[1], 0) > 0 and close < stopLossLow)
// strategy.exit("BBandSE", strategy.short, comment="BBandSE")
// lastTradePrice := close
// stopLossLow := lastTradePrice * (1 - (stopLossFactor / 100))
// stopLossHigh := lastTradePrice * (1 + (stopLossFactor / 100))
plot(source, "close", color.blue)
plot(lower, "lower", color.red)
plot(upper, "upper", color.red)
plot(stopLossLow, "StopLossLow", color.black)
plot(stopLossHigh, "StopLossHigh", color.black)
plot(lastTradePrice, "lastTradePrice", color.green)
plotchar(strategy.position_size > 0, char="-", size=size.tiny, location=location.bottom, color=color.green)
plotchar(strategy.position_size < 0, char="-", size=size.tiny, location=location.bottom, color=color.red)