RSIとフィボナッチリトレースメント取引戦略
概要
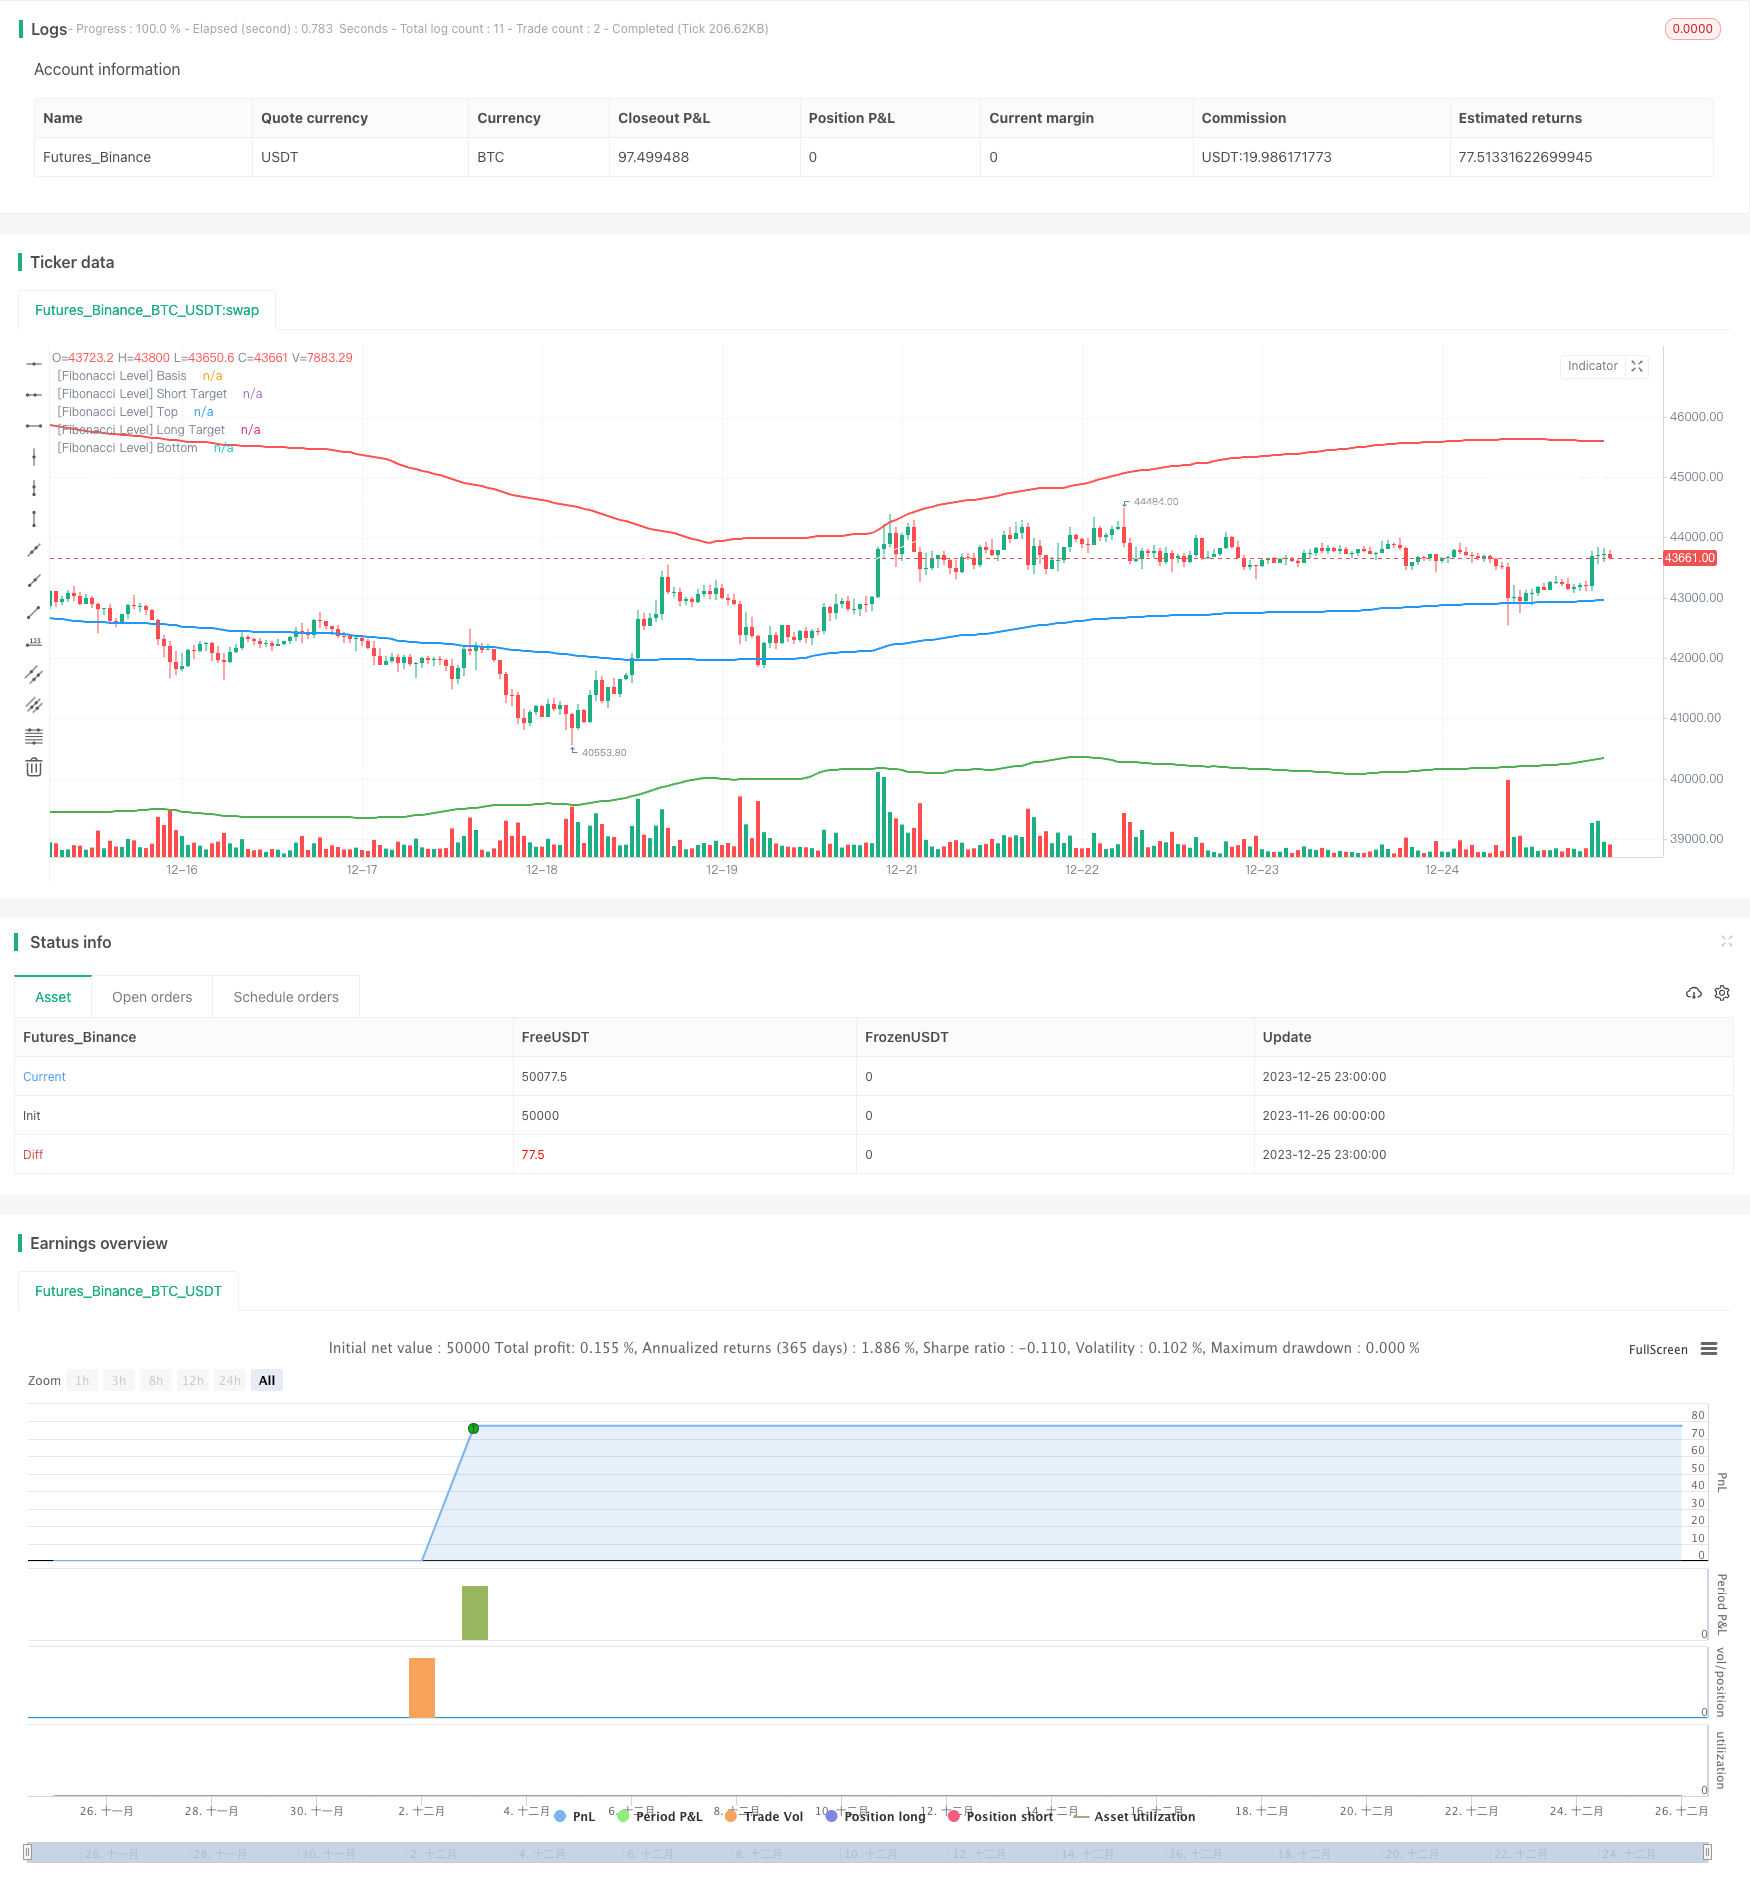
この記事では,比較的強い指数 ((RSI)) とフィボナッチ逆転点を組み合わせて取引する戦略を主に記述しています. この戦略は,まず,特定の周期内の歴史的価格動向に基づいて,重要なフィボナッチ逆転点を計算し,その後,RSI指標と組み合わせて,市場が超買い超売りかどうかを判断し,逆転点の近くで取引信号を発信します.
戦略原則
この戦略は以下の原則に基づいています.
特定の周期 (例えば200K線) の価格データを使用して,その周期の価格の平均値,標準差,および重要なフィボナッチ逆転位 (例えば0.764) を計算する.
価格が上位または下位の逆転に近づいているとき,RSI指標を使用して,その逆転領域に過剰買いや過剰売りがあるかどうかを判断します.
RSIがオーバーバイまたはオーバーセール信号を示している場合は,逆転点の近くでオーバーまたはオフの信号を発信します.
設定した価格を超えた場合や,停止条件を触発した場合は,ポジションをクリアします.
この戦略は,取引のタイミングを判断する基本的なプロセスです.
戦略的優位分析
RSIまたはフィボナッチを単独で使用する取引と比較して,この組み合わせ戦略は以下の利点があります.
双指数フィルタリングにより,偽信号の減少と信号の質の向上が可能です.
逆転点の近くで反転取引を行うのは,比較的に古典的な技術分析手法である.
ストップ・ストップを設定すると,単一取引の最大損失を効果的に制御できます.
パラメータ最適化,指数パラメータ調整,回転位設定により,異なる周期と品種に対応できる.
戦略的リスク分析
この戦略にはいくつかのリスクがあります.
価格の逆転が起こる確率は100%ではないので,価格の実体判断を組み合わせる必要があります.
シングルサイクルのRSIは死後反転の偽信号を生じする可能性があり,複数サイクルの検証を考慮することができます.
ストップ・ロズ・ポイントの設定が過度に緩やかになり,損失を増やす可能性があります.
標識の価格が急激に波動すると,止損は突破される可能性があり,止損点を緩和することを考慮する必要がある.
これらのリスクは,パラメータの調整,指標の組み合わせの最適化などの方法によって制御できます.
戦略最適化の方向性
この戦略をさらに改善できる分野は以下の通りです.
取引量指標の検証を増やし,低額の偽突破を回避する.
ブリン帯の指標を考慮し,帯状突破時に信号を発する.
機械学習やニューラルネットワークのモデルを構築し,高品質の取引機会を自動的に識別する.
遺伝的アルゴリズムなどの方法を使用して,パラメータを自動的に最適化し,止損停止点を調整する.
要約する
この記事では,RSIとフィボナッチ逆転を組み合わせて判断するための量化取引戦略を詳細に説明する.この戦略は,二重指標分析とクラシック技術戦略を統合し,リスクを制御する前提で取引信号の質を向上させる.パラメータ調整とモデル最適化の進行とともに,戦略効果はさらに向上させることができる.
/*backtest
start: 2023-11-26 00:00:00
end: 2023-12-26 00:00:00
period: 1h
basePeriod: 15m
exchanges: [{"eid":"Futures_Binance","currency":"BTC_USDT"}]
*/

//@version=4
strategy(title="Gab Fib  + RSI", overlay=true, default_qty_type=strategy.cash, default_qty_value=100000, initial_capital=1000, currency=currency.USD, commission_type=strategy.commission.cash_per_order, commission_value=4)

// Inputs
timeFilter = year >= 2000
    // Stop Loss
stop_loss = input(title="SL in % of Instrum. i.e 1.5%=150pips", minval=0, step=0.1, defval=1.5) /100
    // RSI Inputs
len = input(title="[RSI] Length", minval=0, step=1, defval=14)
overSold = input(title="[RSI] Over Sold %", defval=30)
overBought = input(title="[RSI] Over Bought %", defval=70)
    // Fibonacci Levels
length = input(title="[Fibonacci] Length", defval=200, minval=1)
src = input(hlc3, title="[Fibonacci] Source")
mult = input(title="[Fibonacci] Multiplier", defval=3.0, minval=0.001, maxval=50)
level = input(title="[Fibonacci] Level", defval=764)


// Calculate Fibonacci
basis = vwma(src, length)
dev = mult * stdev(src, length)
fu764= basis + (0.001*level*dev)
fu1= basis + (1*dev)
fd764= basis - (0.001*level*dev)
fd1= basis - (1*dev)

// Calculate RSI
vrsi = rsi(close, len)

// Calculate the Targets
targetUp = fd764
targetDown = fu764
    // Actual Targets
bought = strategy.position_size[0] > strategy.position_size[1]
exit_long = valuewhen(bought, targetUp, 0)
sold = strategy.position_size[0] < strategy.position_size[1]
exit_short = valuewhen(sold, targetDown, 0)

// Calculate Stop Losses
sl_long = close * (1-stop_loss)
sl_short = close * (1+stop_loss)


// Conditions to Open Trades
openLong = low < fd1 and crossover(vrsi[1], overSold)
openShort = high > fu1 and crossunder(vrsi[1], overBought)

// Conditions to Close Trades
closeLong = high > exit_long or sl_long
closeShort = low < exit_short or sl_short


//Rounding to MinTick value
roundtargetUp = round_to_mintick(targetUp)
roundtargetDown = round_to_mintick(targetDown)
roundsllong = round_to_mintick(sl_long)
roundslshort = round_to_mintick(sl_short)

// Plots
plot(basis, color=color.blue, linewidth=2, title="[Fibonacci Level] Basis")
plot(fu764, color=color.white, linewidth=1, title="[Fibonacci Level] Short Target")
plot(fu1, color=color.red, linewidth=2, title="[Fibonacci Level] Top")
plot(fd764, color=color.white, linewidth=1, title="[Fibonacci Level] Long Target")
plot(fd1, color=color.green, linewidth=2, title="[Fibonacci Level] Bottom")


// Strategy Orders
if timeFilter
    // Entry Orders
    strategy.entry(id="buy", long=true, when=openLong and high < targetUp, limit=close, alert_message="buy,"+tostring(syminfo.ticker)+",tp="+tostring(roundtargetUp)+",sl="+tostring(roundsllong))
    strategy.entry(id="sell", long=false, when=openShort and low > targetDown, limit=close,  alert_message="sell,"+tostring(syminfo.ticker)+",tp="+tostring(roundtargetDown)+",sl="+tostring(roundslshort))

    // Exit Orders
    strategy.exit(id="closelong", when=closeLong and strategy.position_size > 0, limit=exit_long, stop=sl_long, alert_message="closelong,"+tostring(syminfo.ticker))
    strategy.exit(id="closeshort", when=closeShort and strategy.position_size < 0, limit=exit_short, stop=sl_short, alert_message="closeshort,"+tostring(syminfo.ticker))