スーパートレンドに基づくイーサリアム取引戦略
概要
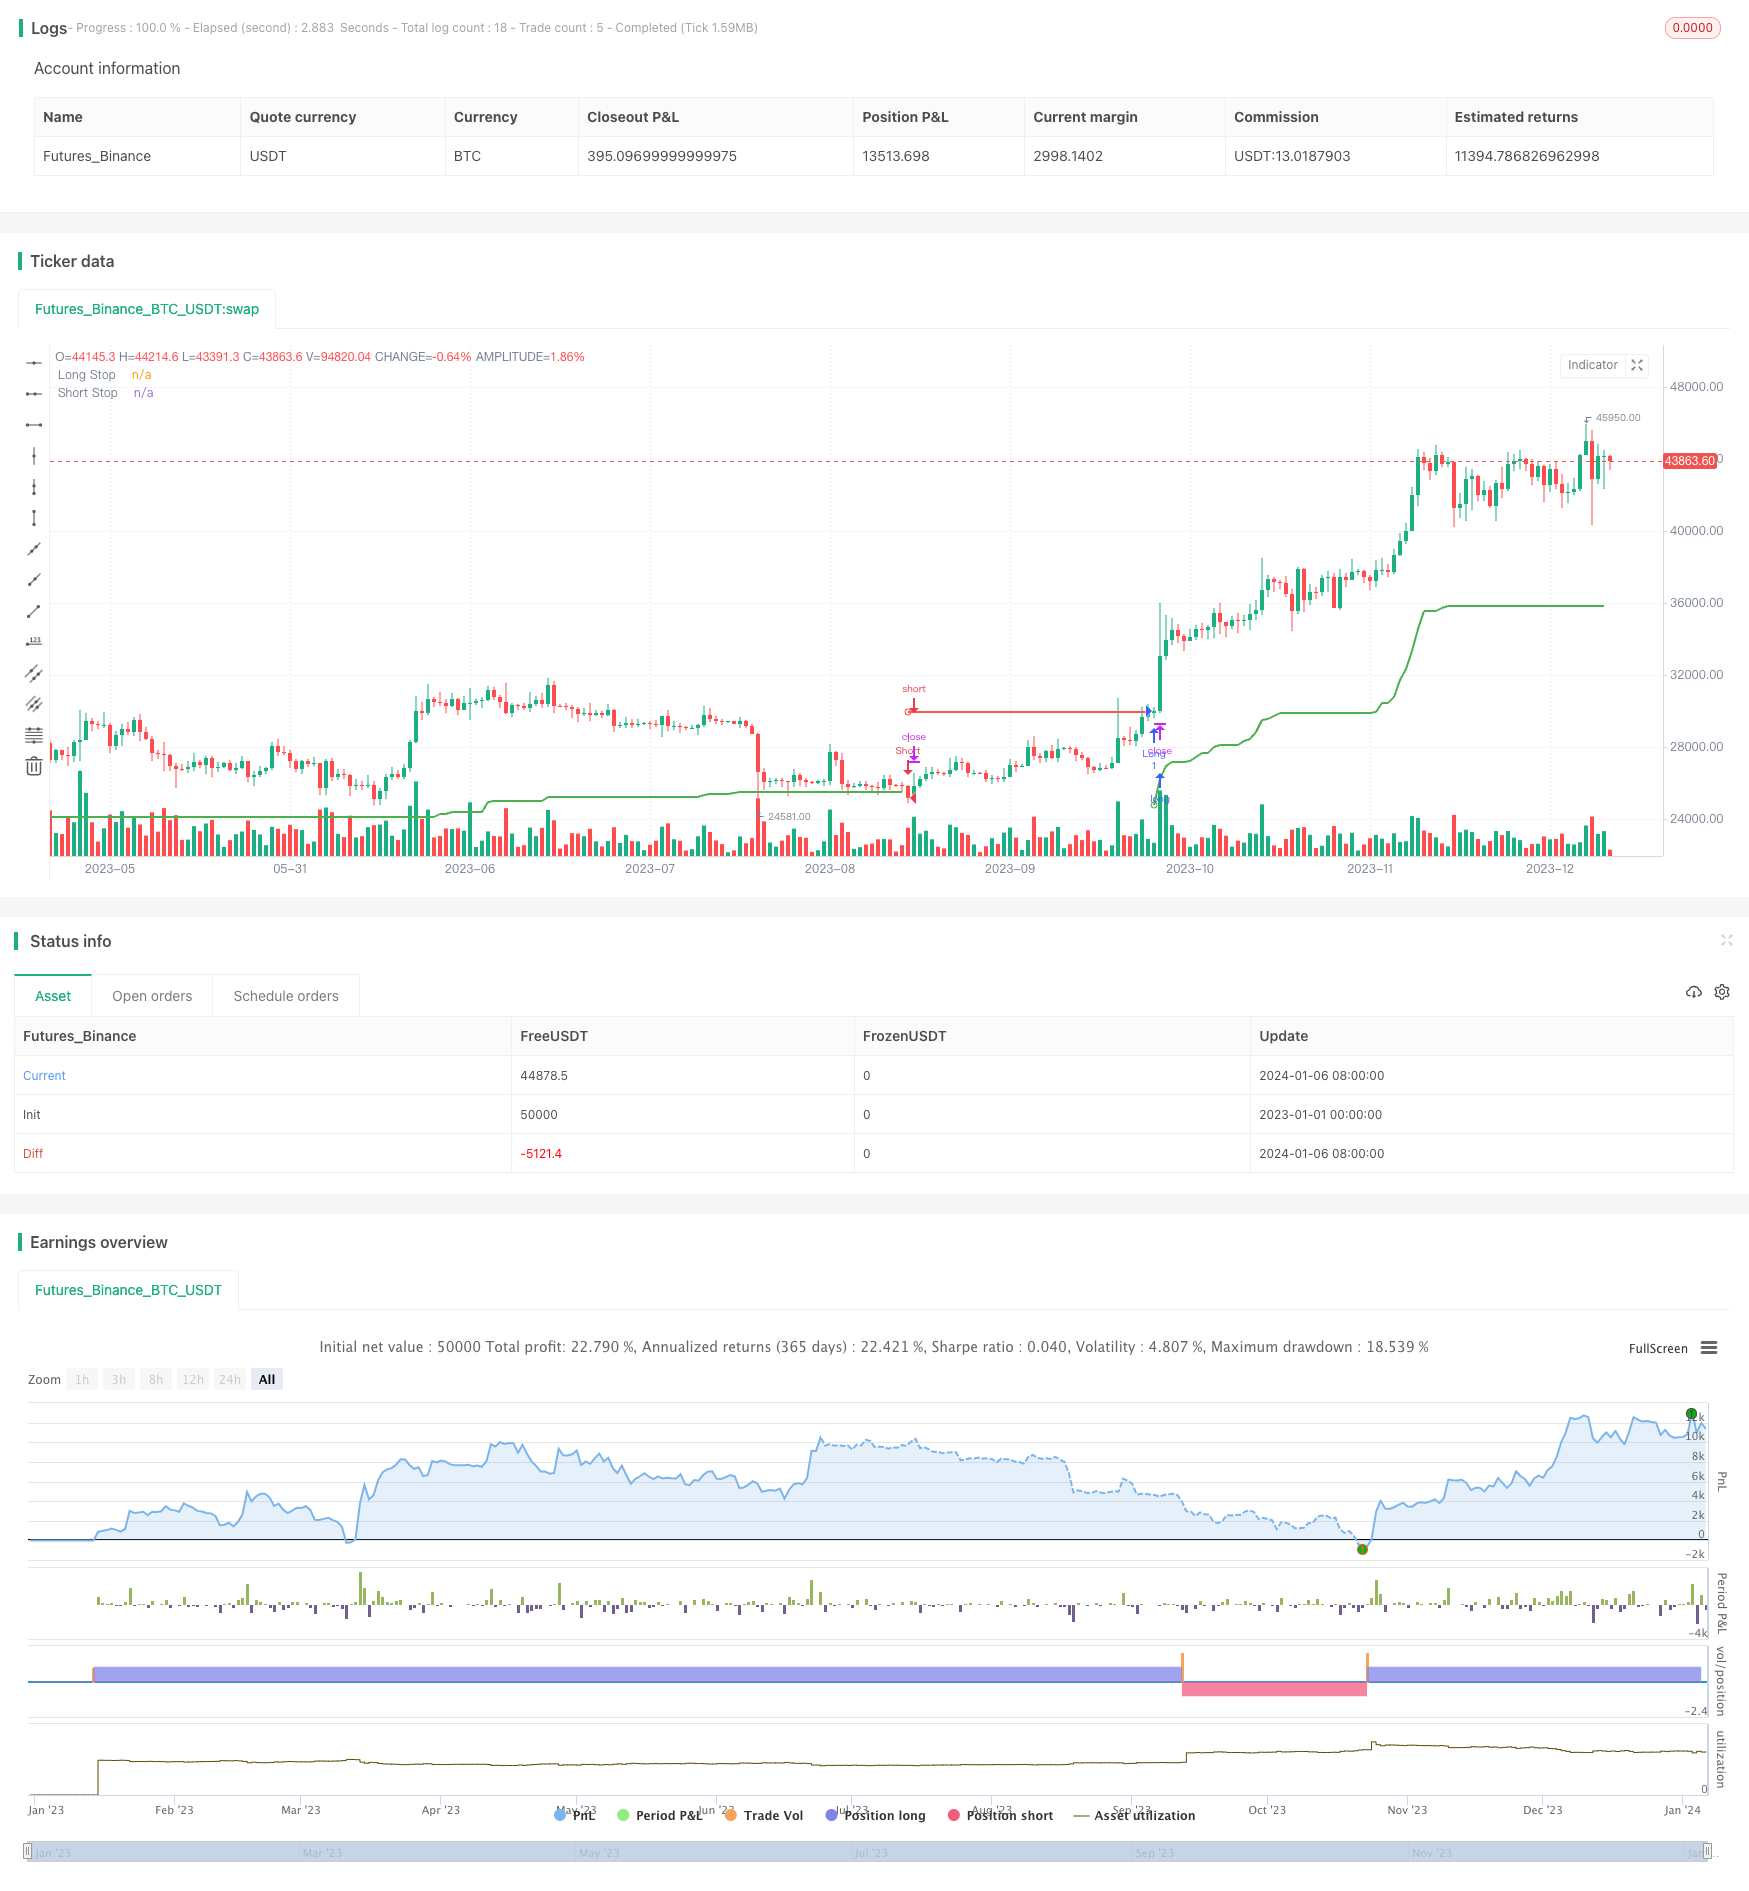
この戦略は超トレンド指標をベースに,ATRと組み合わせて,動的にストップラインを設定し,イーサリアムで強いトレンドで利益を得ます.これはCoinbase取引所のETH/USD取引ペアで動作できます.
戦略原則
この戦略は,トレンドの方向を判断するために,クラシックなトレンド追跡指標とスーパートレンド指標を使用する.スーパートレンド指標は,2つの曲線で構成されています.
- 株価は上昇傾向で,株価は上昇傾向で
- ダウントレンドのストップ・ローンを,ダウントレンドの空券を保有する.
価格が上昇傾向から下降傾向に転じたとき,空頭ポジションを開く.価格が下降傾向から上昇傾向に転じたとき,多頭ポジションを開く.
さらに,ストップラインの位置を動的に調整するためにATR指標を使用する.具体的には,上方ストップラインの位置は最高価格と最低価格の平均をATRの1倍に減算し,下方ストップラインの位置は最高価格と最低価格の平均をATRの1倍に加算する.このようにして,市場の変動程度に応じてストップラインを調整することができる.
入って信号を発信した後,価格が再び止損線を破った場合,止損退出を行います.
戦略的優位性
これは,より成熟したトレンド追跡戦略で,以下の利点があります.
- 超トレンド指数を使ってトレンドの方向を判断し,信頼性が高い.
- ATRの適用により,自律的に止損ラインを調整することで,リスクを効果的に制御できます.
- 戦略の論理はシンプルで明快で,理解し,修正しやすい.
- デジタル通貨の市場での変動から利益を得ることができます.
戦略リスク
この戦略にはいくつかのリスクがあります.
- 超トレンド指数の誤判の可能性があり,不必要な損失を招く可能性があります.
- ATRのストップは,価格の逆転によって,激進的になりすぎると考えられます.
- デジタル通貨の市場が波動し,ストップダメージが突破される可能性が高い.
- 取引手数料が高くなる取引所は,最終的に利益に影響する.
上記のリスクを軽減するために,ATR係数を適切に調整するか,または他の指標と組み合わせて,取引信号をフィルタリングすることができます. ストップ・ロスの位置は,一定の緩衝を留めることを考慮することもできます.
戦略最適化の方向性
この戦略はさらに改善できる余地があります.
- 信号の精度を高めるために,より多くの指標の組み合わせを導入できます.
- ATR係数と長さパラメータの最適値について研究できる.
- ポジションの規模を動的に調整するリスク・ストップ・ロスの比率を設定できます.
- デジタル通貨の取引ペアを拡大して,戦略の有効性をテストできます.
要約する
この戦略は,全体として,成熟した信頼性の高いトレンド追跡戦略である.これは,超トレンド指標を使用してトレンドの方向性を判断し,ATRを使用して,リスクをコントロールしながら利益を得るため,ストップ・ポジションを調整する.この戦略は,波動性の高いデジタル通貨取引に適用され,イーサリアムなどの主流通貨ではより効果的です.さらなる最適化により,戦略は,より広範な市場で適用され,より安定した余剰利益を得ることができます.
/*backtest
start: 2023-01-01 00:00:00
end: 2024-01-07 00:00:00
period: 1d
basePeriod: 1h
exchanges: [{"eid":"Futures_Binance","currency":"BTC_USDT"}]
*/

//@version=4
strategy("SuperTrend Strategy",
     overlay=true,
     initial_capital=2e3,
     process_orders_on_close=true,
     commission_type=strategy.commission.percent,
     commission_value=0.1
     )

length = input(title="ATR Period", type=input.integer, defval=21)
mult = input(title="ATR Multiplier", type=input.float, step=.25, defval=6.2)
wicks = input(title="Take Wicks into Account ?", type=input.bool, defval=false)

useDate = input(title="Start from Specific Date ?", defval=false)
yearStart = input(title="Start Year", defval=2019)
monthStart = input(title="Start Month", minval=1, maxval=12, defval=1)
dayStart = input(title="Start Day", minval=1, maxval=31, defval=1)

startTime = timestamp(yearStart, monthStart, dayStart, 0, 0)
startFrom = useDate ? time(timeframe.period) >= startTime : true

atr = mult * ta.atr(length)

longStop = hl2 - atr
longStopPrev = nz(longStop[1], longStop)
longStop := (wicks ? low[1] : close[1]) > longStopPrev ? math.max(longStop, longStopPrev) : longStop

shortStop = hl2 + atr
shortStopPrev = nz(shortStop[1], shortStop)
shortStop := (wicks ? high[1] : close[1]) < shortStopPrev ? math.min(shortStop, shortStopPrev) : shortStop

dir = 1
dir := nz(dir[1], dir)
dir := dir == -1 and (wicks ? high : close) > shortStopPrev ? 1 : dir == 1 and (wicks ? low : close) < longStopPrev ? -1 : dir

longColor = color.green
shortColor = color.red

plot(dir == 1 ? longStop : na, title="Long Stop", style=plot.style_linebr, linewidth=2, color=longColor)
plotshape(dir == 1 and dir[1] == -1 ? longStop : na, title="Long Start", location=location.absolute, style=shape.circle, size=size.tiny, color=longColor, transp=0)

plot(dir == 1 ? na : shortStop, title="Short Stop", style=plot.style_linebr, linewidth=2, color=shortColor)
plotshape(dir == -1 and dir[1] == 1 ? shortStop : na, title="Short Start", location=location.absolute, style=shape.circle, size=size.tiny, color=shortColor, transp=0)

longCondition = dir[1] == -1 and dir == 1
if longCondition and startFrom
    strategy.entry("Long", strategy.long, stop=longStop)
else
    strategy.cancel("Long")

shortCondition = dir[1] == 1 and dir == -1
if shortCondition and startFrom
    strategy.entry("Short", strategy.short, stop=shortStop)
else
    strategy.cancel("Short")