短期反転戦略を突き抜ける
概要
穿越ショートライン反転戦略は,ショートライン形状に基づくトレンド取引戦略である.それはショートライン形状を信号として利用し,移動平均と組み合わせてトレンドの方向を判断し,高勝率のエントリーを実現する.同時に,それは独特の追跡ストップ損失機構を使用して,超高の収益率を実現する.
戦略原則
入口信号
この戦略は,入場信号を短線形に貫穿する.具体的には,以下の2つの条件を満たすときに信号を生成する.
- 特定の短線形を形成する:多頭信号は陽線短線,空頭信号は陰線短線
- ショートライン形式の突破移動平均線:陽線突破下向きの移動平均線,または陰線突破上向きの移動平均線
この組み合わせの信号は,入場精度を向上させるため,ほとんどのノイズをフィルターします.
傾向を判断する
この策略は,3つの異なる周期の移動平均を使用してトレンドを判断する.具体的には,快線,中線,および遅線が同方向に並べられた場合トレンドとして定義され,そうでない場合は整合として定義される.
多頭入場の場合,快線 > 中線 > 慢線を要求する.空頭入場の場合,快線 < 中線 < 慢線を要求する.
損失を抑える仕組み
この戦略は,独特のトラッキングストップメカニズムを使用しています. ポジションを開設すると,ユーザが設定したポイント数と偏移量に基づいて最適なストップポイントを追跡します. これは,最大限の利益をロックし,リスクを制御します.
優位分析
高効率の入学
ショートラインの突破信号は,戦略が高確率の機会にのみポジションを開き,過剰なノイズ取引を避けることができる.傾向判断と組み合わせて,ほとんどの非主流の方向操作をフィルターすることができる.これは戦略の高精度を保証する.
超強のストップ
独特のトラッキングストップ・メカニズムは,この戦略の最大の亮点である.それは,最大利益の保証を前提に,各ストップ・ロスを精密に小さな範囲で制御し,高い勝利率と超強の収益性を保証する.
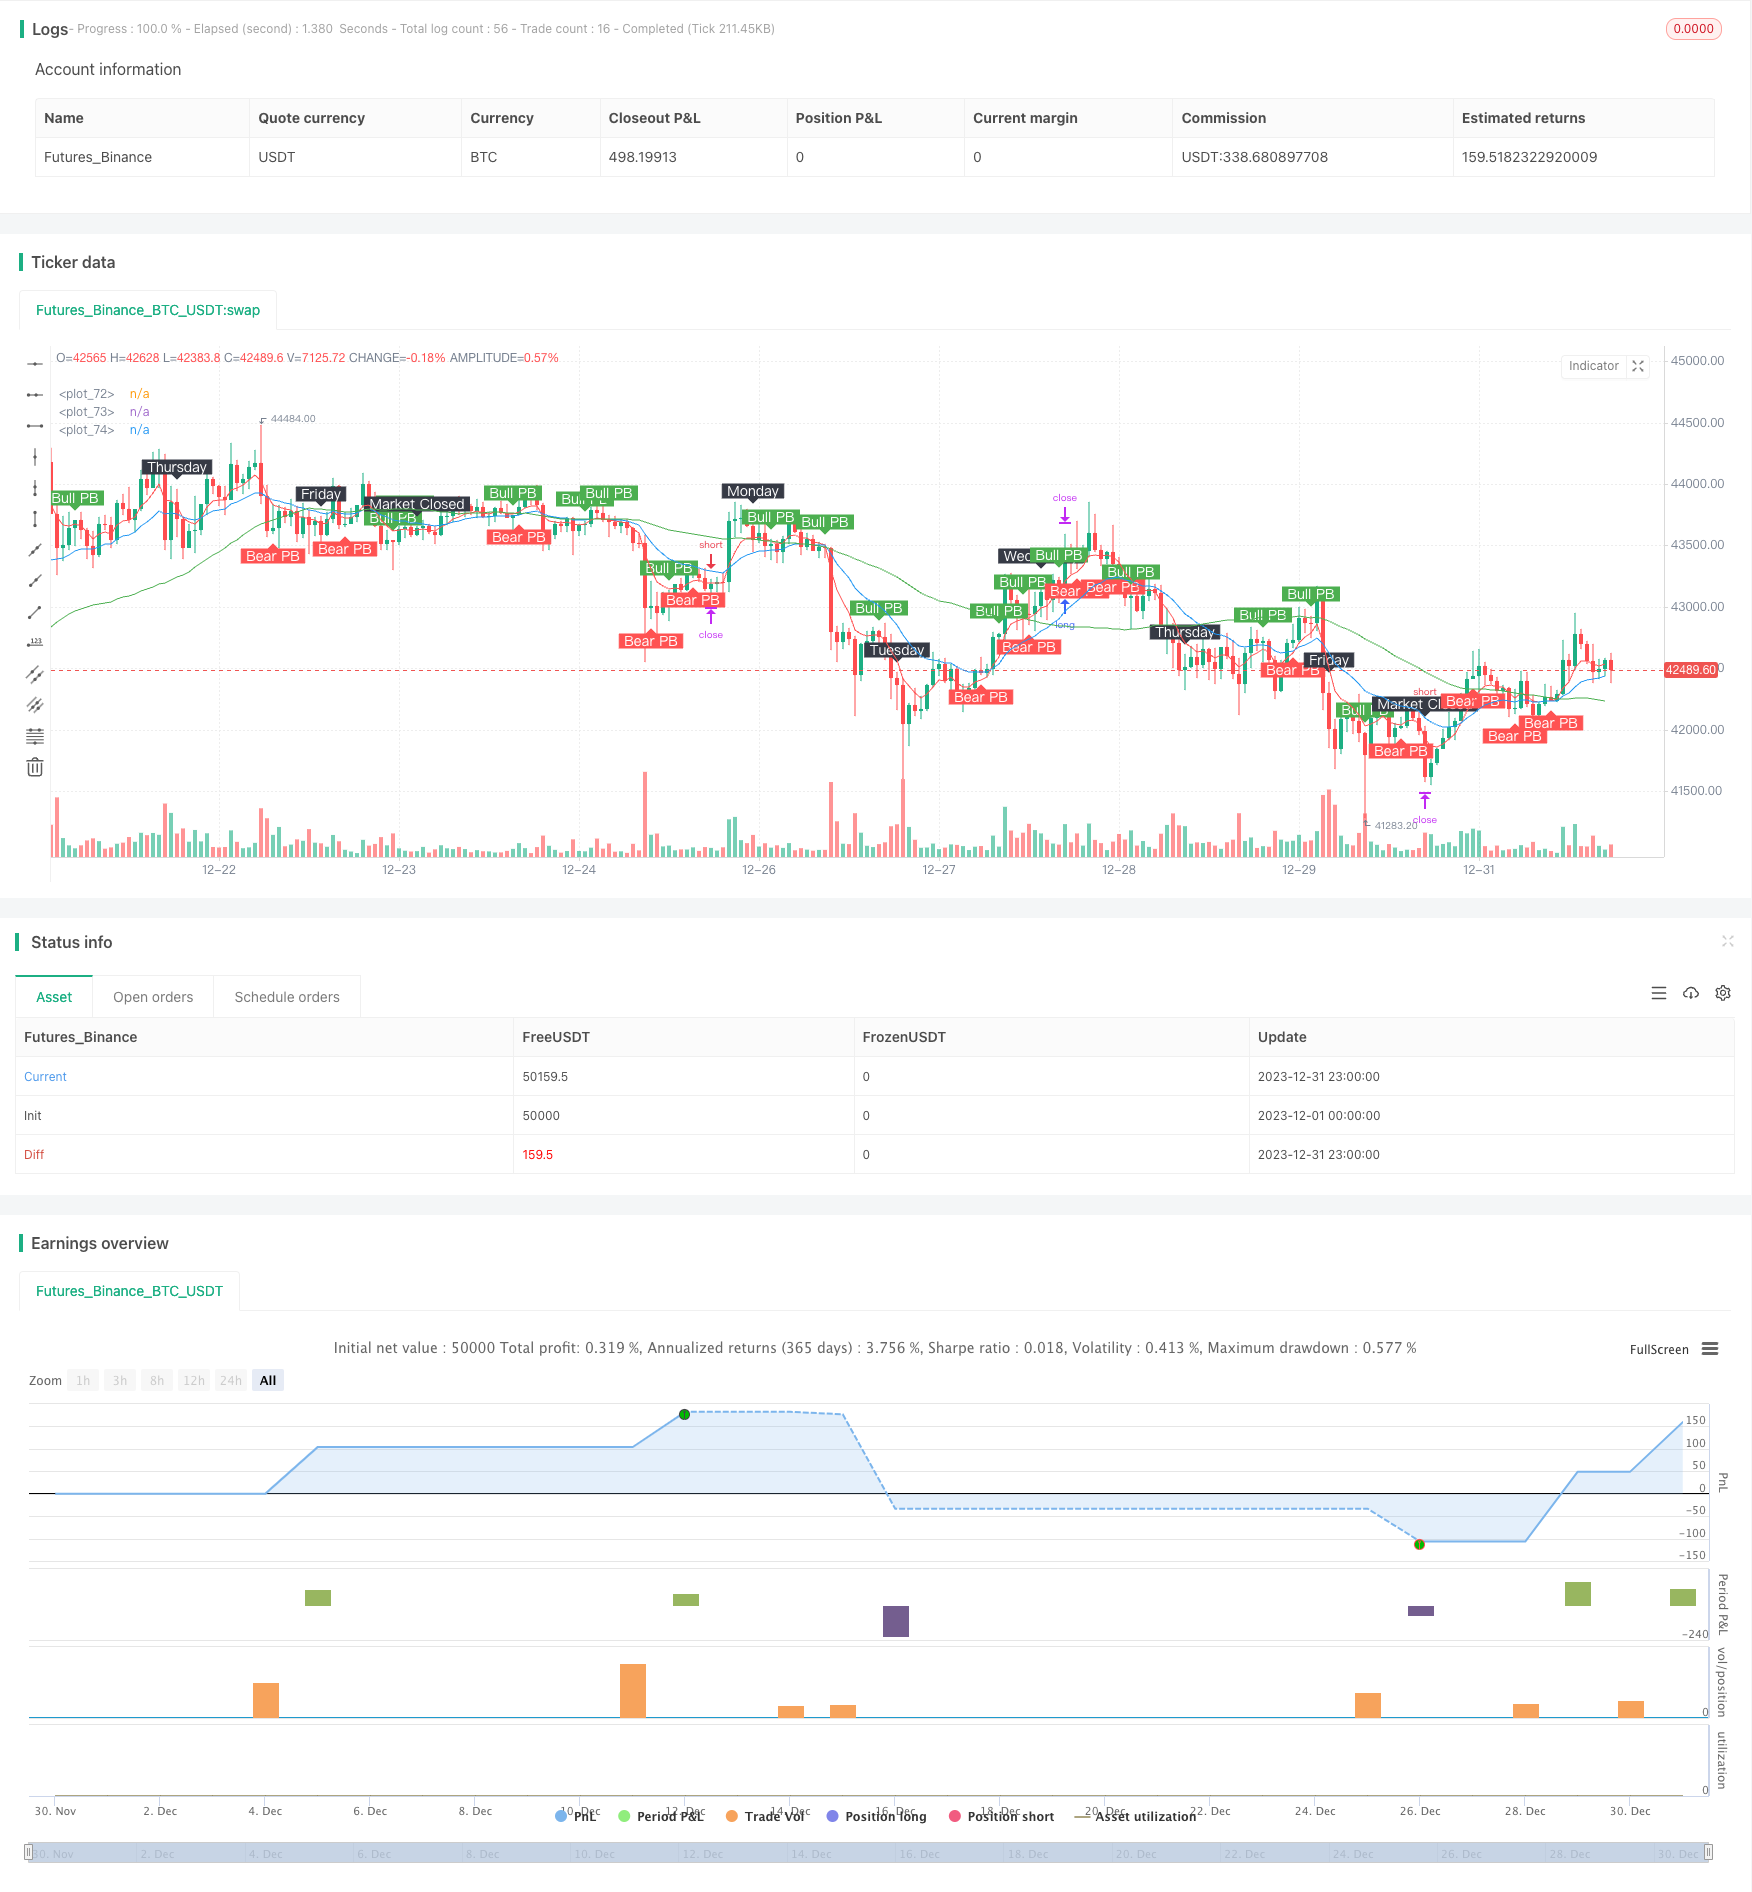
模擬結果は,このメカニズムを使用すると,複数の通貨ペアが1000%以上の総リターンを達成し,最大利益は100倍を超え,利益はかつてない新高に上昇したことを示しています.
リスク分析
過剰最適化のリスク
テスト結果が聖杯に近いことを考えると,これは市場の過度のシミュレーションの結果である可能性が高い.リッドディスクの停止損失機構はテストのように正確に有効にできない可能性があり,一定撤回に直面する.
また,テスト期間は2年であり,市場構造の変化も実盤のパフォーマンスに影響を及ぼす可能性があります.
ストップ・リスクを追跡する
追跡ストップが過度に敏感である場合,過剰なストップトリガーが発生する可能性があります.また,市場の突発的な出来事は,ストップの無効性を引き起こす可能性があります.これは,追跡ストップを使用する際に必要とされるリスクです.
最適化の方向
追跡停止パラメータを調整する
ストップトラッキングは,戦略全体の利益爆発の鍵である. 敏捷かつ信頼性のあるものにするため,ストップトラッキングのポイントを適切に緩め,より敏感にしようとすることができます.
テスト時間ウィンドウを追加すると,パラメータの安定性をチェックすることもできます.
移動平均周期を最適化する
現在の移動平均周期は最適のパラメータの組み合わせではない.最適化テストによって,よりよいパラメータを見つけ,よりよい効果を生み出すことができる.
例えば,快線と中線の周期差を増やしたり,三線交差方法を調整したり.
要約する
短線反転戦略は,高効率のエントリーと超強のストップによって,驚異的な模擬テスト指標を達成しました. しかし,私たちは,その過適合のリスクを認識し,リスク管理の準備を整えなければなりません.
この戦略は,適切なパラメータ調整や最適化によって,現実の世界で大きな利益を得ることができ,強力なトレンドシステムになる可能性があります.
/*backtest
start: 2023-12-01 00:00:00
end: 2023-12-31 23:59:59
period: 1h
basePeriod: 15m
exchanges: [{"eid":"Futures_Binance","currency":"BTC_USDT"}]
*/

//@version=4
//Time Frame: H1
strategy("Pin Bar Magic v1", overlay=true)

// User Input
usr_risk = input(title="Equity Risk (%)",type=input.integer,minval=1,maxval=100,step=1,defval=3,confirm=false)
atr_mult = input(title="Stop Loss (x*ATR, Float)",type=input.float,minval=0.1,maxval=100,step=0.1,defval=0.5,confirm=false)
slPoints = input(title="Stop Loss Trail Points (Pips)",type=input.integer,minval=1,maxval=1000,step=1,defval=1,confirm=false)
slOffset = input(title="Stop Loss Trail Offset (Pips)",type=input.integer,minval=1,maxval=1000,step=1,defval=1,confirm=false)
sma_slow = input(title="Slow SMA (Period)",type=input.integer,minval=1,maxval=500,step=1,defval=50,confirm=false)
ema_medm = input(title="Medm EMA (Period)",type=input.integer,minval=1,maxval=500,step=1,defval=18,confirm=false)
ema_fast = input(title="Fast EMA (Period)",type=input.integer,minval=1,maxval=500,step=1,defval=6,confirm=false)
atr_valu = input(title="ATR (Period)",type=input.integer,minval=1,maxval=500,step=1,defval=14,confirm=false)
ent_canc = input(title="Cancel Entry After X Bars (Period)",type=input.integer,minval=1,maxval=500,step=1,defval=3,confirm=false)

// Create Indicators
slowSMA = sma(close, sma_slow)
medmEMA = ema(close, ema_medm)
fastEMA = ema(close, ema_fast)
bullishPinBar = ((close > open) and ((open - low) > 0.66 * (high - low))) or ((close < open) and ((close - low) > 0.66 * (high - low)))
bearishPinBar = ((close > open) and ((high - close) > 0.66 * (high - low))) or ((close < open) and ((high - open) > 0.66 * (high - low)))
atr = atr(atr_valu)

// Specify Trend Conditions
fanUpTrend = (fastEMA > medmEMA) and (medmEMA > slowSMA)
fanDnTrend = (fastEMA < medmEMA) and (medmEMA < slowSMA)

// Specify Piercing Conditions
bullPierce = ((low < fastEMA) and (open > fastEMA) and (close > fastEMA)) or ((low < medmEMA) and (open > medmEMA) and (close > medmEMA)) or ((low < slowSMA) and (open > slowSMA) and (close > slowSMA))
bearPierce = ((high > fastEMA) and (open < fastEMA) and (close < fastEMA)) or ((high > medmEMA) and (open < medmEMA) and (close < medmEMA)) or ((high > slowSMA) and (open < slowSMA) and (close < slowSMA))

// Specify Entry Conditions
longEntry = fanUpTrend and bullishPinBar and bullPierce
shortEntry = fanDnTrend and bearishPinBar and bearPierce

// Long Entry Function
enterlong() =>
    risk = usr_risk * 0.01 * strategy.equity
    stopLoss = low[1] - atr[1] * atr_mult
    entryPrice = high[1]
    units = risk / (entryPrice - stopLoss)
    strategy.entry("long", strategy.long, units, stop=entryPrice)
    strategy.exit("exit long", from_entry="long", trail_points=slPoints, trail_offset=slOffset)

// Short Entry Function
entershort() =>
    risk = usr_risk * 0.01 * strategy.equity
    stopLoss = high[1] + atr[1] * atr_mult
    entryPrice = low[1]
    units = risk / (stopLoss - entryPrice)
    strategy.entry("short", strategy.short, units, stop=entryPrice)
    strategy.exit("exit short", from_entry="short", trail_points=slPoints, trail_offset=slOffset)

// Execute Long Entry
if (longEntry)
    enterlong()

// Execute Short Entry
if (shortEntry)
    entershort()

// Cancel the Entry if Bar Time is Exceeded
strategy.cancel("long", barssince(longEntry) > ent_canc)
strategy.cancel("short", barssince(shortEntry) > ent_canc)

// Force Close During Certain Conditions
strategy.close_all(when = hour==16 and dayofweek==dayofweek.friday, comment = "exit all, market-closed")
strategy.close_all(when = crossunder(fastEMA, medmEMA), comment = "exit long, re-cross")
strategy.close_all(when = crossover(fastEMA, medmEMA), comment = "exit short, re-cross")

// Plot Moving Averages to Chart
plot(fastEMA, color=color.red)
plot(medmEMA, color=color.blue)
plot(slowSMA, color=color.green)

// Plot Pin Bars to Chart
plotshape(bullishPinBar, text='Bull PB', style=shape.labeldown, location=location.abovebar, color=color.green, textcolor=color.white, transp=0)
plotshape(bearishPinBar, text='Bear PB', style=shape.labelup, location=location.belowbar, color=color.red, textcolor=color.white, transp=0)

// Plot Days of Week
plotshape(hour==0 and dayofweek==dayofweek.monday, text='Monday', style=shape.labeldown, location=location.abovebar, color=color.black, textcolor=color.white, transp=0)
plotshape(hour==0 and dayofweek==dayofweek.tuesday, text='Tuesday', style=shape.labeldown, location=location.abovebar, color=color.black, textcolor=color.white, transp=0)
plotshape(hour==0 and dayofweek==dayofweek.wednesday, text='Wednesday', style=shape.labeldown, location=location.abovebar, color=color.black, textcolor=color.white, transp=0)
plotshape(hour==0 and dayofweek==dayofweek.thursday, text='Thursday', style=shape.labeldown, location=location.abovebar, color=color.black, textcolor=color.white, transp=0)
plotshape(hour==0 and dayofweek==dayofweek.friday, text='Friday', style=shape.labeldown, location=location.abovebar, color=color.black, textcolor=color.white, transp=0)
plotshape(hour==16 and dayofweek==dayofweek.friday, text='Market Closed', style=shape.labeldown, location=location.abovebar, color=color.black, textcolor=color.white, transp=0)