二重指標に基づくブレークスルー戦略
作成日:
2024-01-25 15:39:06
最終変更日:
2024-01-25 15:39:06
コピー:
0
クリック数:
683
1
フォロー
1751
フォロワー
概要
二重指標突破策は,RSI指標と閉盤価格指標を組み合わせて,低買い高売り方法を実現する取引を行う.この戦略は,シンプルで実用的で,取り戻しのリスクが小さい,中長期線でのポジションに適しています.
戦略原則
この戦略は,以下の2つの指標に基づいて判断されます.
- RSI指数:RSI2が15未満の場合は,追加入場を行う.
- 前日の閉店価格:今日閉店価格が前日の最高価格より高いとき,平仓は出場する.
入場条件は,RSI超買いであり,株が高度に過小評価され,反転の可能性が強いことを示している.出場条件は,閉店価格が1日前の最高値を破り,株が多頭行情に入っていることを示しているため,適切に停止すべきである.
優位分析
双重指標の突破策には以下の利点があります.
- 戦略操作はシンプルで実行しやすい.
- 偽信号の制御は,二重指数に基づいています.
- RSI指標のパラメータは最適化スペースがあり,最適状態に調整できます。
- 中長期トレンドを追跡し,撤退のリスクは小さくなります.
- 広範囲に広まっていて,実戦効果も良い.
リスク分析
この戦略にはいくつかのリスクがあります.
- 株の変動が大きすぎて,RSIのパラメータを調整する必要がある.
- 短線回調は多頭行列で予想される.
- 価格の上昇は合理性を評価する必要がある.
RSIのパラメータを最適化し,状況のタイプを評価し,他の指標判断と組み合わせることで,上記のリスクを回避することができます.
最適化の方向
この戦略の最適化方向は,以下の部分に重点を置いています.
- RSI指標の効果を評価する
- 閉盤価格と他の価格指標の組み合わせをテストする.
- 試合終了後しばらく再入場するなど,損失防止メカニズムを追加する.
- 取引量の変化と組み合わせて入場信号の信頼性を評価する.
- 機械学習アルゴリズムを使用してパラメータを自動的に最適化します.
要約する
二重指数突破戦略は,全体的に非常に実用的な量化戦略である. この戦略は操作が簡単で,撤回リスクは低く,パラメータの最適化と規則の完善により,賢明で安定した量化プログラムになることができます. 効果的に着地すれば,私たちに良い中長線取引の機会を提供することができます.
ストラテジーソースコード
/*backtest
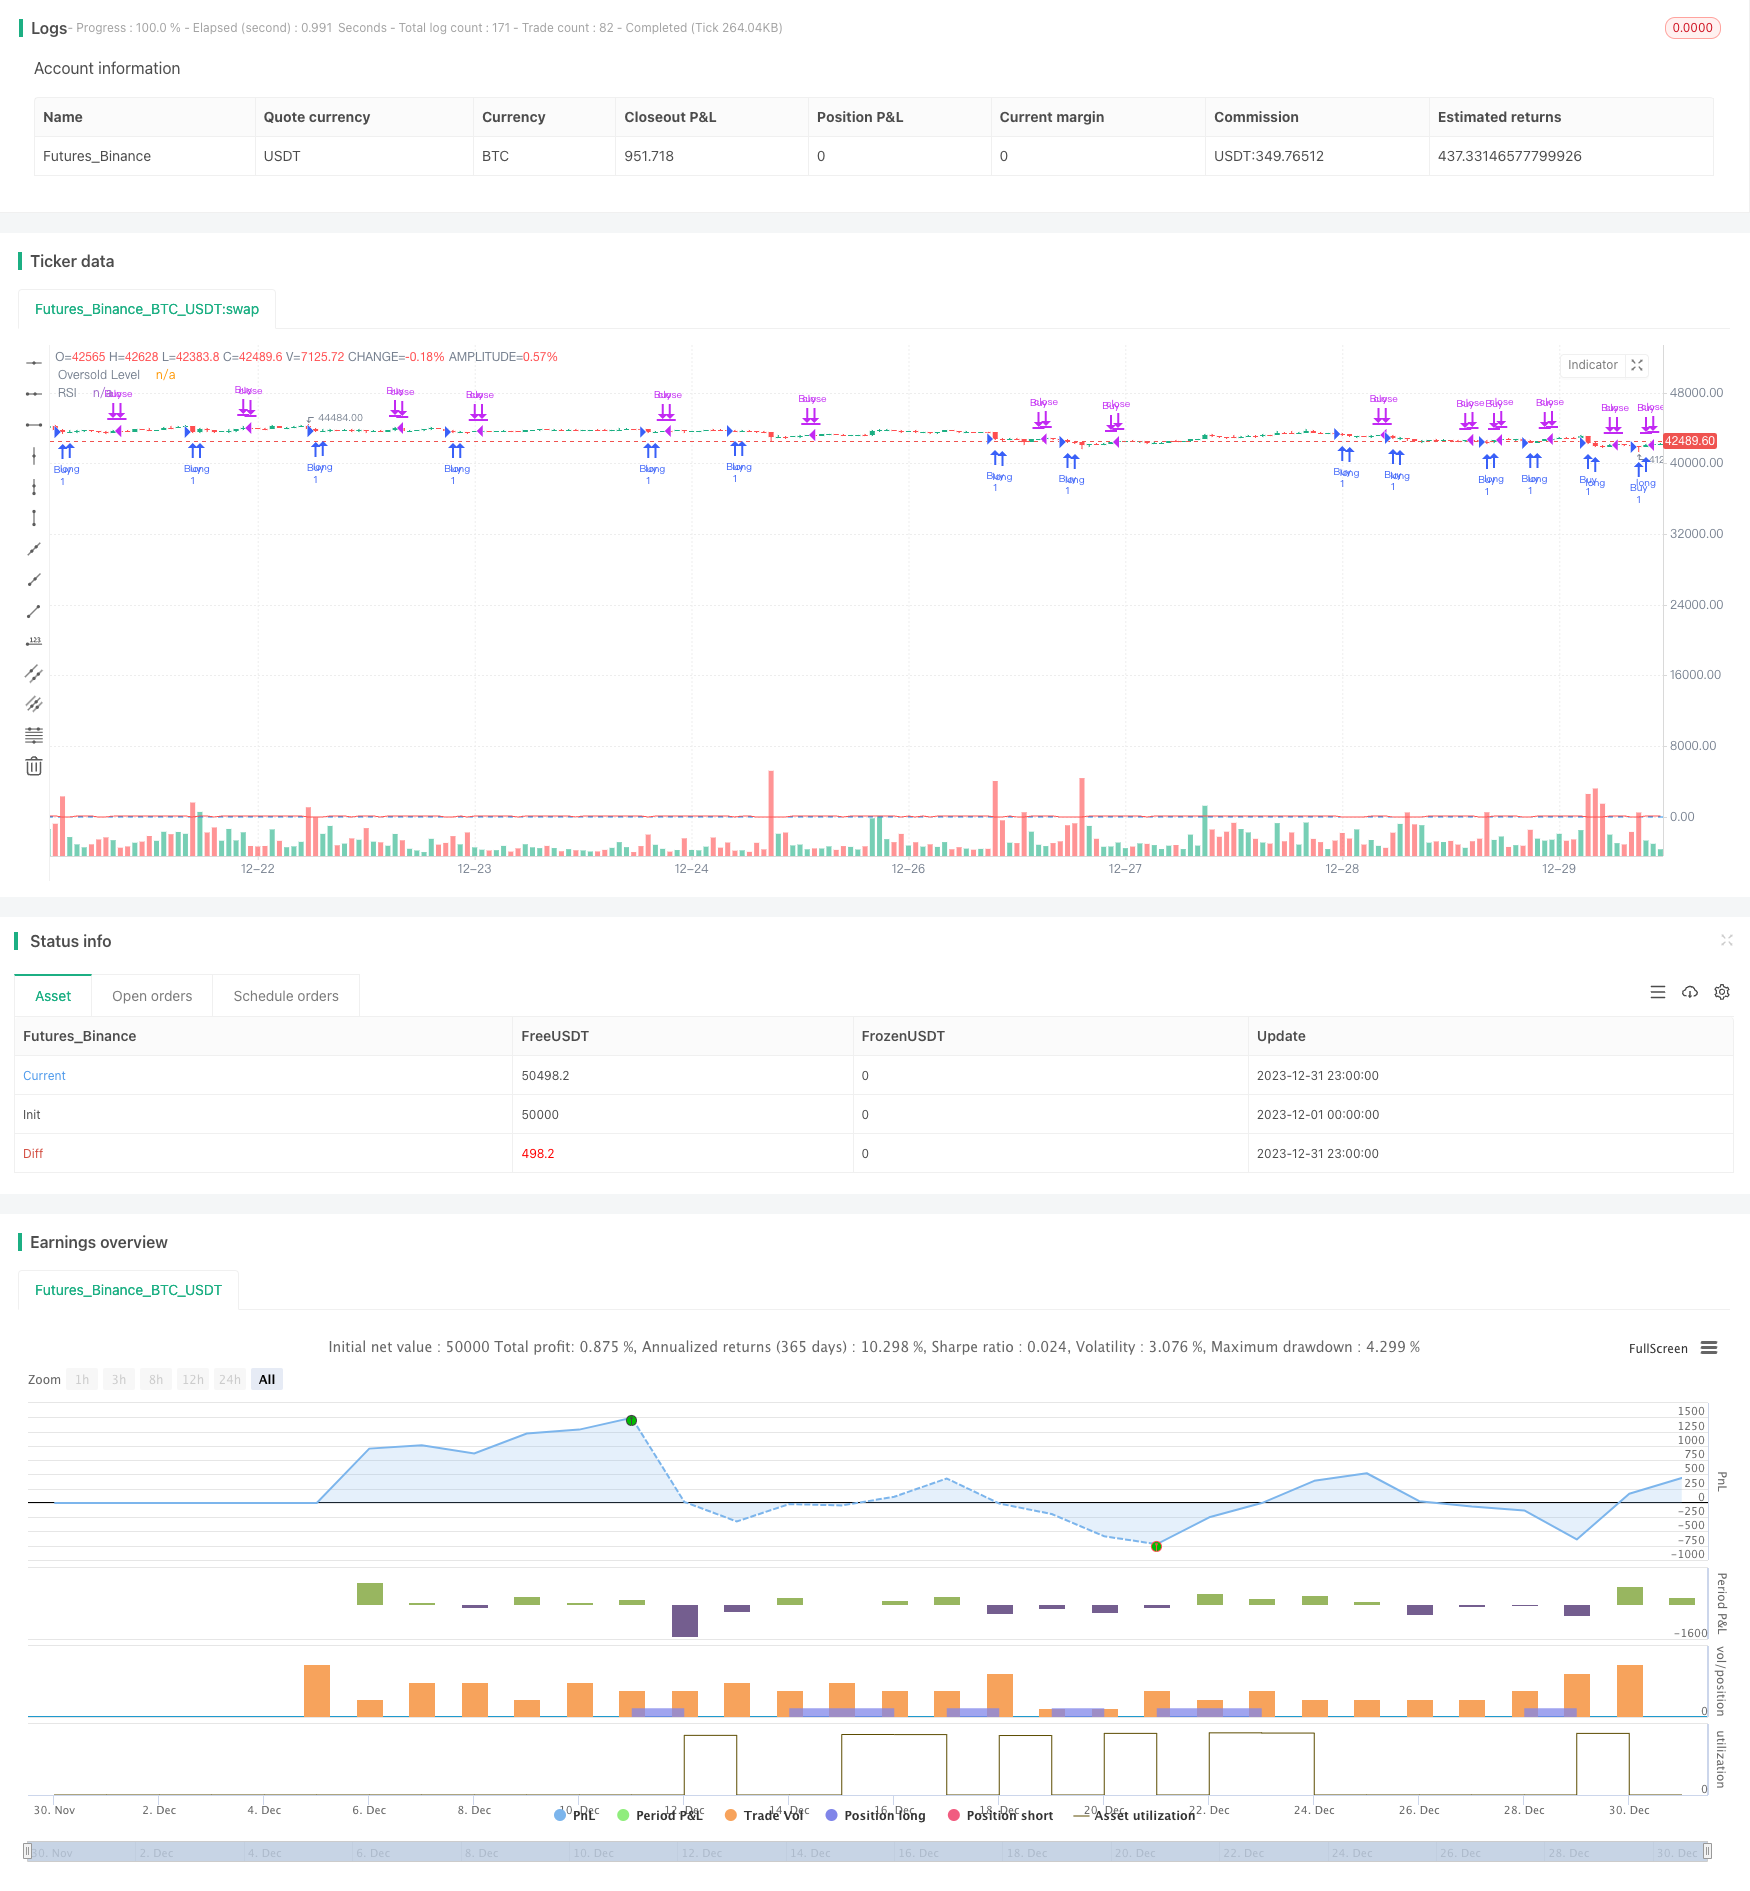
start: 2023-12-01 00:00:00
end: 2023-12-31 23:59:59
period: 1h
basePeriod: 15m
exchanges: [{"eid":"Futures_Binance","currency":"BTC_USDT"}]
*/
// This source code is subject to the terms of the Mozilla Public License 2.0 at https://mozilla.org/MPL/2.0/
// © hobbiecode
// If RSI(2) is less than 15, then enter at the close.
// Exit on close if today’s close is higher than yesterday’s high.
//@version=5
strategy("Hobbiecode - RSI + Close previous day", overlay=true)
// RSI parameters
rsi_period = 2
rsi_lower = 15
// Calculate RSI
rsi_val = ta.rsi(close, rsi_period)
// Check if RSI is lower than the defined threshold
if (rsi_val < rsi_lower)
strategy.entry("Buy", strategy.long)
// Check if today's close is higher than yesterday's high
if (strategy.position_size > 0 and close > ta.highest(high[1], 1))
strategy.close("Buy")
// Plot RSI on chart
plot(rsi_val, title="RSI", color=color.red)
hline(rsi_lower, title="Oversold Level", color=color.blue)