市場の流動性とトレンドに基づいた短期取引戦略
概要
この戦略は,市場流動性,トレンド,技術指標などの複数の次元を総合的に考慮し,ショートライン戦略取引を実現する.この戦略は,トレンドをフォローし,市場流動性が優れているときにポジション開設操作を行うことで,ショートライン利益を得ることができる.
戦略原則
基本原則:この戦略は,主に市場流動性とトレンドの2つの次元を考慮する.市場流動性が良好で,トレンドが発生するときにショートライン操作する.
市場流動性指標:この戦略は,主にMFIと取引量の変化を市場流動性の指標として使用します.MFIが上昇し取引量が増加すると,市場流動性が良いと判断し,ポジションを開くのに適しています.
トレンド判断:この戦略はADX,EMAなど複数の指標を組み合わせてトレンド判断する.ADXが30以上でEMAが強い時,トレンドが強いことを示している.同時に,ゆっくりとEMAが金交差などが発生した場合,トレンドを検証することもできる.
ポジション開設条件:市場の流動性が良好で,同時にトレンドが発生するときは,他の補助条件 (SAR位置判断など) も合致する場合は,ポジション開設シグナルが生じます.
ストップ・ストップ・損失設定:この戦略は,各取引に対して固定ストップ (約10ポイント) とストップ・損失 (約7.5ポイント) を設定している.
優位分析
この戦略は以下の利点があります.
市場の流動性を判断するタイミング:MFIと取引量に基づいて市場の流動性を判断し,市場の流動性が低いときにポジションを開くのを避ける.
トレンドを追跡して利益を得る: EMAなどの指標と組み合わせてトレンドの方向性を判断し,トレンドの利益を得るのを助けます.
リスク管理: 一回の取引で最大損失を効果的に制御する固定ストップ・ストップ・ロスを設定します.
取引頻度が高い:ショートライン戦略として,取引頻度が高いことが,徐々に利益を蓄積するのに適している.
パラメータの最適化空間は大きい.例えばMAパラメータ,止損停止設定など,最適化が可能で,戦略の効果を高める.
リスク分析
この戦略にはいくつかのリスクがあります.
实体盤の滑点制御リスク:理論的な止損ストップは,実体盤の状況を完全に反映しない.実体盤の滑点は,比較的大きい可能性がある.
傾向判断の失敗リスク:この戦略は傾向判断に多くの指標を依拠しているが,失敗する可能性は依然として存在する.
過剰取引のリスク:ショートライン戦略として,パラメータが正しく設定されていない場合,過剰取引を引き起こす可能性があります.
市場異常のリスク: 市場流動性の低下や政策の変化などの極端な状況で,この戦略は正常に機能しない可能性があります.
リスクの低減には,以下の方法があります.
固定ディスクの滑り場要因を考慮して,適切な止損範囲を緩和する.
トレンド判断の論理を最適化し,より多くの指標を導入し,失敗の確率を下げる.
取引の頻度制限を加え,過度な取引を避ける.
市場状況に応じてパラメータを柔軟に調整し,異常状況に対応する.
最適化の方向
この戦略の最適化方向は以下の通りです.
より多くの指標を導入することで,トレンド判断を最適化し,判断をより正確にする.例えば,MACD指標を導入するなど.
MAの周期パラメータを最適化し,最適なパラメータ組み合わせを探します.
モバイル・ストップ,区間・ストップなどのストップ・ストップ戦略の改善
取引回数に制限を加え,高頻度取引を避ける.例えば,1日3回までポジションを開く.
よりよい市場流動性指標を探し,ポジション開設のタイミングをさらに判断する.例えば,純流入量などの指標を導入する.
パラメータ最適化機能を追加し,パラメータの自動最適化を実現し,最適なパラメータの組み合わせを探します.
要約する
この戦略は,市場流動性やトレンドなどの複数の次元を総合的に考慮し,短線内で利益を捕捉する.従来のトレンド戦略と比較して,この戦略の最大の革新は,市場流動性の指標を導入することであり,市場流動性の欠陥時にポジションを開くのを避けることです.それに対応して,この戦略には,一定の実物制御リスクとトレンド判断の失敗のリスクがあります.我々は,より多くの指標を導入し,パラメータを最適化し,リスク管理方法を導入することによって,戦略を継続的に改善することができます.
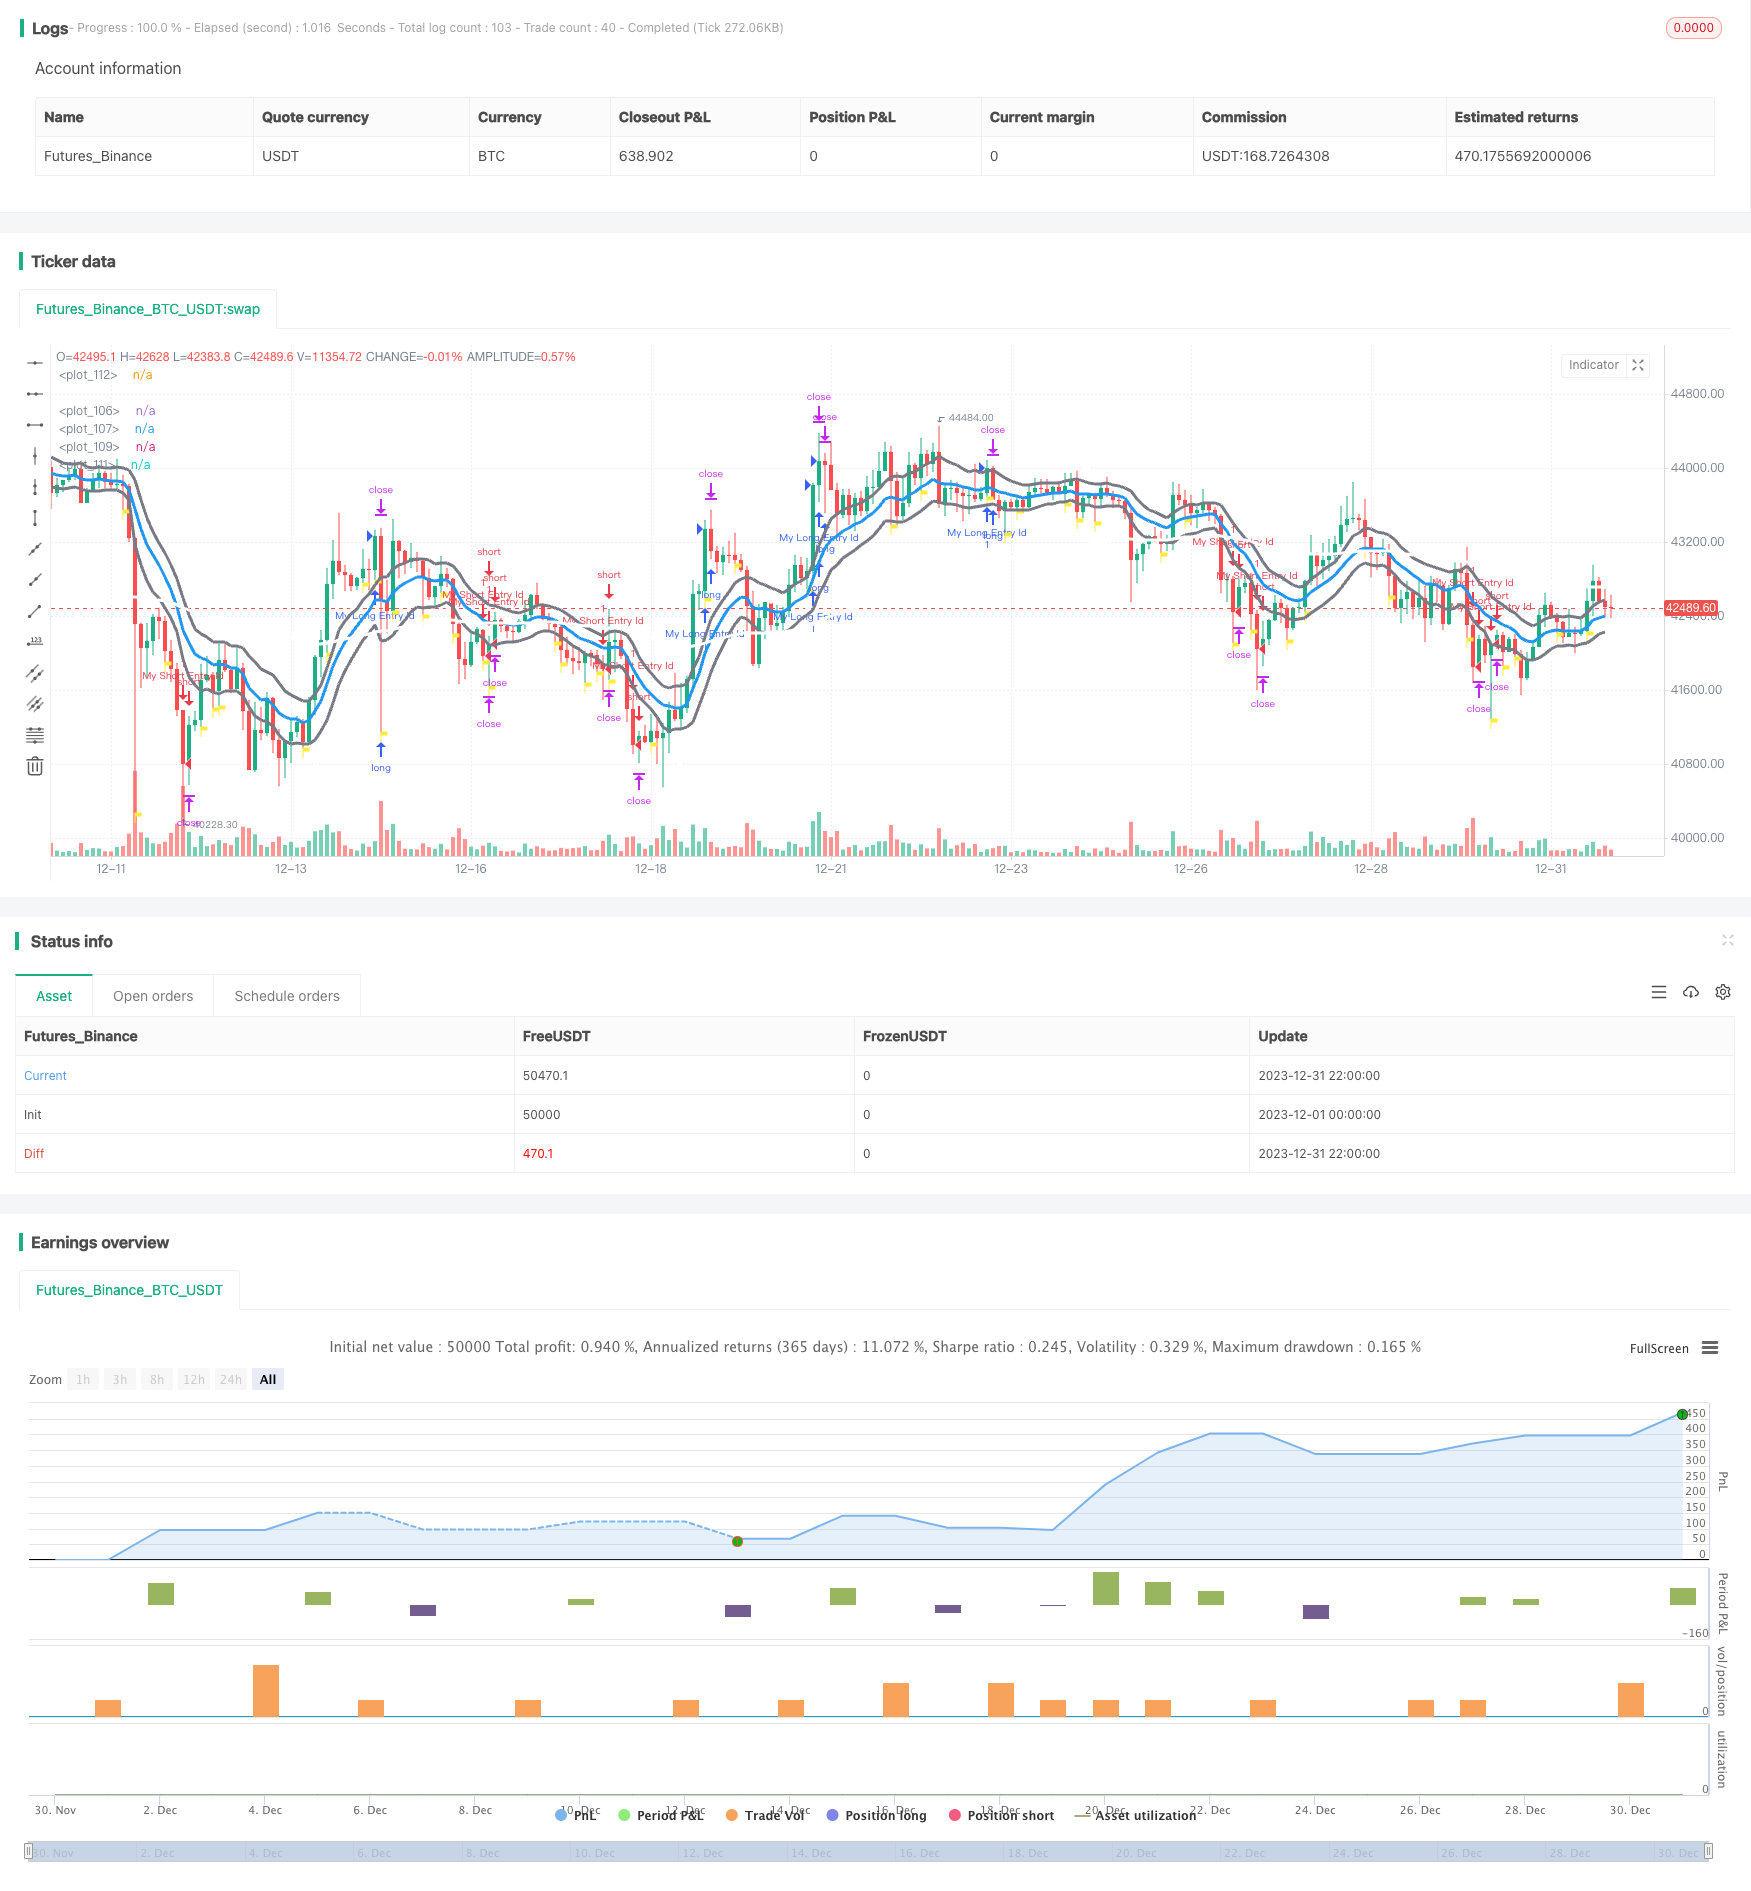
/*backtest
start: 2023-12-01 00:00:00
end: 2023-12-31 23:59:59
period: 2h
basePeriod: 15m
exchanges: [{"eid":"Futures_Binance","currency":"BTC_USDT"}]
*/

// This source code is subject to the terms of the Mozilla Public License 2.0 at https://mozilla.org/MPL/2.0/
// © trent777brown

//@version=5
strategy("scalping with market facilitation", overlay=true, margin_long=100, margin_short=100)


MFI0 = (high - low) / volume
MFI1 = (high[1] - low[1]) / volume[1]

MFIplus = MFI0 > MFI1
MFIminus = MFI0 < MFI1

//Current Trend-(Changed mean to trend)-revised
trendplus = hl2 > high[1]
trendzero = hl2 < high[1] and hl2 > low[1]  //addition of script
trendminus = hl2 < low[1]  //changed high to low

//Volume +/-
volplus = volume > volume[1]
volminus = volume < volume[1]

//Period Control by Buyers or Sellers is determined with reference to Price action of the period
//divided into 3 sectors, sector 1 is the Top third, Sector 2 is the middle third,
//and sector 3 is the Bottom third of the period. Control classifications are: Extremes(11, 33), Neutral(22),
//Climbers(31,21,32) Open lower than Close, and Drifters(13,23,12)Close lower than Open

//value0 = low
//value1 = ((high - low)/3)
//value2 = ((high - low)/3)*2
//value3 = high

//o1 = (open >= (((high - low)/3) * 2) + low)
//c1 = (close >= (((high - low)/3) * 2) + low)
//o2 = (open <= o1)
//c2 = (close <= c1)
//o3 = (open <= ((high - low)/3) + low)
//c3 = (close <= ((high - low)/3) + low)

//sector2 = if((high - low)/3) + low and sector2 <= (((high - low)/3)*2) + low

//sector3 = if((high - low)/3) + low and >= low


//Extremes-Full Control of Period by Buyers or Sellers
//pg79 notes an 85% chance that the current trend will change in the next 1 to 5 bars
b11 = open >= (high - low) / 3 * 2 + low and close >= (high - low) / 3 * 2 + low  //Extreme Buyer Control:Chartruse
b33 = open <= (high - low) / 3 + low and close <= (high - low) / 3 + low  //Extreme Seller Control:Crimson
//Neutral pg80
b22 = open >= (high - low) / 3 + low and open <= (high - low) / 3 * 2 and close >= (high - low) / 3 + low and open <= (high - low) / 3 * 2  //Bracketed Price Control
//Climber-Open lower than Close pg81
b31 = open <= (high - low) / 3 + low and close >= (high - low) / 3 * 2 + low  //Strong Buyer Control:Dark Green
b21 = open >= (high - low) / 3 + low and open <= (high - low) / 3 * 2 and close >= (high - low) / 3 * 2 + low  //Moderate Buyer Control:Green
b32 = open <= (high - low) / 3 + low and close >= (high - low) / 3 + low and open <= (high - low) / 3 * 2  //Weak Buyer Control:Light Green
//Drifter-Close lower than Open pg81
b13 = open >= (high - low) / 3 * 2 + low and close <= (high - low) / 3 + low  //Strong Seller Control:Dark Red
b23 = open >= (high - low) / 3 + low and open <= (high - low) / 3 * 2 and close <= (high - low) / 3 + low  //Moderate Seller Control:Red
b12 = open >= (high - low) / 3 * 2 + low and close >= (high - low) / 3 + low and open <= (high - low) / 3 * 2  //Weak Seller Control:Light Red/Pink


//


psar= ta.sar(.09, .2, .2)

ema8= ta.ema(hlc3, 8)

ema13h= ta.ema(high, 13)
ema13l= ta.ema(low, 13)
ema13= ta.ema(close, 13)

ema55= ta.ema(close, 100)

[dip, dim, adx]= ta.dmi(5, 5)
adxema=ta.ema(adx, 3)
[macdl, sigl, histl]= ta.macd(close, 8, 13, 5)
obv= ta.obv
obvema= ta.ema(obv, 8)
obvema55= ta.ema(obv, 55)
mfigreen= MFIplus and volplus
adx_x_over= ta.crossover(adx, adxema) and adx >= 25
barssincemfi= ta.barssince(mfigreen)


longtrig2= adx > 30 and adx > adxema and barssincemfi <= 4


shorttrig2= adx > 30 and adx > adxema and barssincemfi <= 4


long= macdl > sigl and obv > obvema55 and ema8 > ema55   and psar < low and trendplus//and ema13l > ema55//and open > hull200 and close > hull200

short= macdl < sigl and obv < obvema55 and ema8 < ema55 and psar > high and trendminus//and ema13h < ema55//open < hull200 and close < hull200


//plot(hull200, color=color.red, linewidth=3)
plot(ema13h, color=color.gray, linewidth=3)
plot(ema13l, color=color.gray, linewidth=3)

plot(ema13, color=color.blue, linewidth=3)
//
plot(ema55, color=color.white, linewidth=3)
plot(psar, color=color.white, style=plot.style_circles)
plotshape(mfigreen, color=color.yellow, style=shape.flag, location=location.belowbar, size= size.tiny)
longCondition = long
if (longCondition)
    strategy.entry("My Long Entry Id", strategy.long, 1,  when= longtrig2)
    strategy.exit("exit long", "My Long Entry Id", profit= 100, loss= 75)
shortCondition = short
if (shortCondition)
    strategy.entry("My Short Entry Id", strategy.short, 1,  when= shorttrig2)
    strategy.exit("exit short", "My Short Entry Id", profit= 100, loss= 75)