ボリンジャーバンド、RSI、移動平均に基づくトレンドフォロー戦略
概要
この戦略は,ブリン帯指標,相対的に強い指標 ((RSI) と移動平均 ((MA) を統合し,市場の潜在的入場と出場点を識別することを目的としています. それは,手動取引または自動取引システムによって実行される購入と販売のシグナルアラートを生成することができます.
戦略原則
この戦略は,2つのパラメータの異なるブリンを用い,価格チャネルを生成する.ブリン帯のデフォルトパラメータは20サイクルで,標準差は2である.ブリン帯の上線と下線は,それぞれ,ダイナミックな抵抗とサポート位置として機能する.
RSIは,価格動力の強さや弱さを判断するために使用される. RSIの値を読み,過買か過売かを判断します.
戦略には50周期の移動平均も統合され,全体的なトレンドの方向を判断する.価格が移動平均より高いときは,上昇傾向にあることを示し,価格が移動平均より低いときは,下降傾向にあることを示している.
買い信号の条件:RSIが超買いラインより高く,ブリン帯は収縮していない.
RSIが超セールライン以下で,ブリン帯は収縮していない.
平仓のシグナル条件: 長いポジションは,価格が移動平均より閉店する. 短いポジションは,価格が移動平均より閉店する.
戦略的優位性
ブリン帯,RSI,移動平均の3つの指標を組み合わせて,トレンドの方向を総合的に判断し,偽の信号を生じさせないようにする.
ブリン帯は局所的な高低点を判断し,突破を確認し,RSIは偽の突破をフィルターし,移動平均は全体的な動きを判断する.
戦略パラメータは最適化され,ブリン帯は2つの標準差パラメータを使用し,価格チャネルをより正確に描写する.
戦略リスク
ブリン帯が収縮すると,誤信号が生じやすい.このとき,RSIも中立地帯に近づいており,取引は避けるべきである.
振動傾向では,RSIと移動平均が誤信号を生じることがあります. 振動市場の存在を事前に認識する必要があります.
価格の飛躍のギャップを効果的に処理できない場合. 真の突破を判断する他の指標と組み合わせる.
戦略最適化の方向性
ブリン帯とRSIのパラメータを最適化して,異なる品種と時間周期の特性をより適合させる.
追加のストップ・ロースの設定を追加した. 価格がストップ・ロースラインを破るときに自動的にストップする.
ADXのようなトレンドフィルターを追加し,トレンド状態に入っているかどうかを判断する. 振動市場の無効取引を減らす.
自動取引システムと組み合わせて,生成された取引信号を利用して,人工の介入なしに取引を自動的に実行します.
要約する
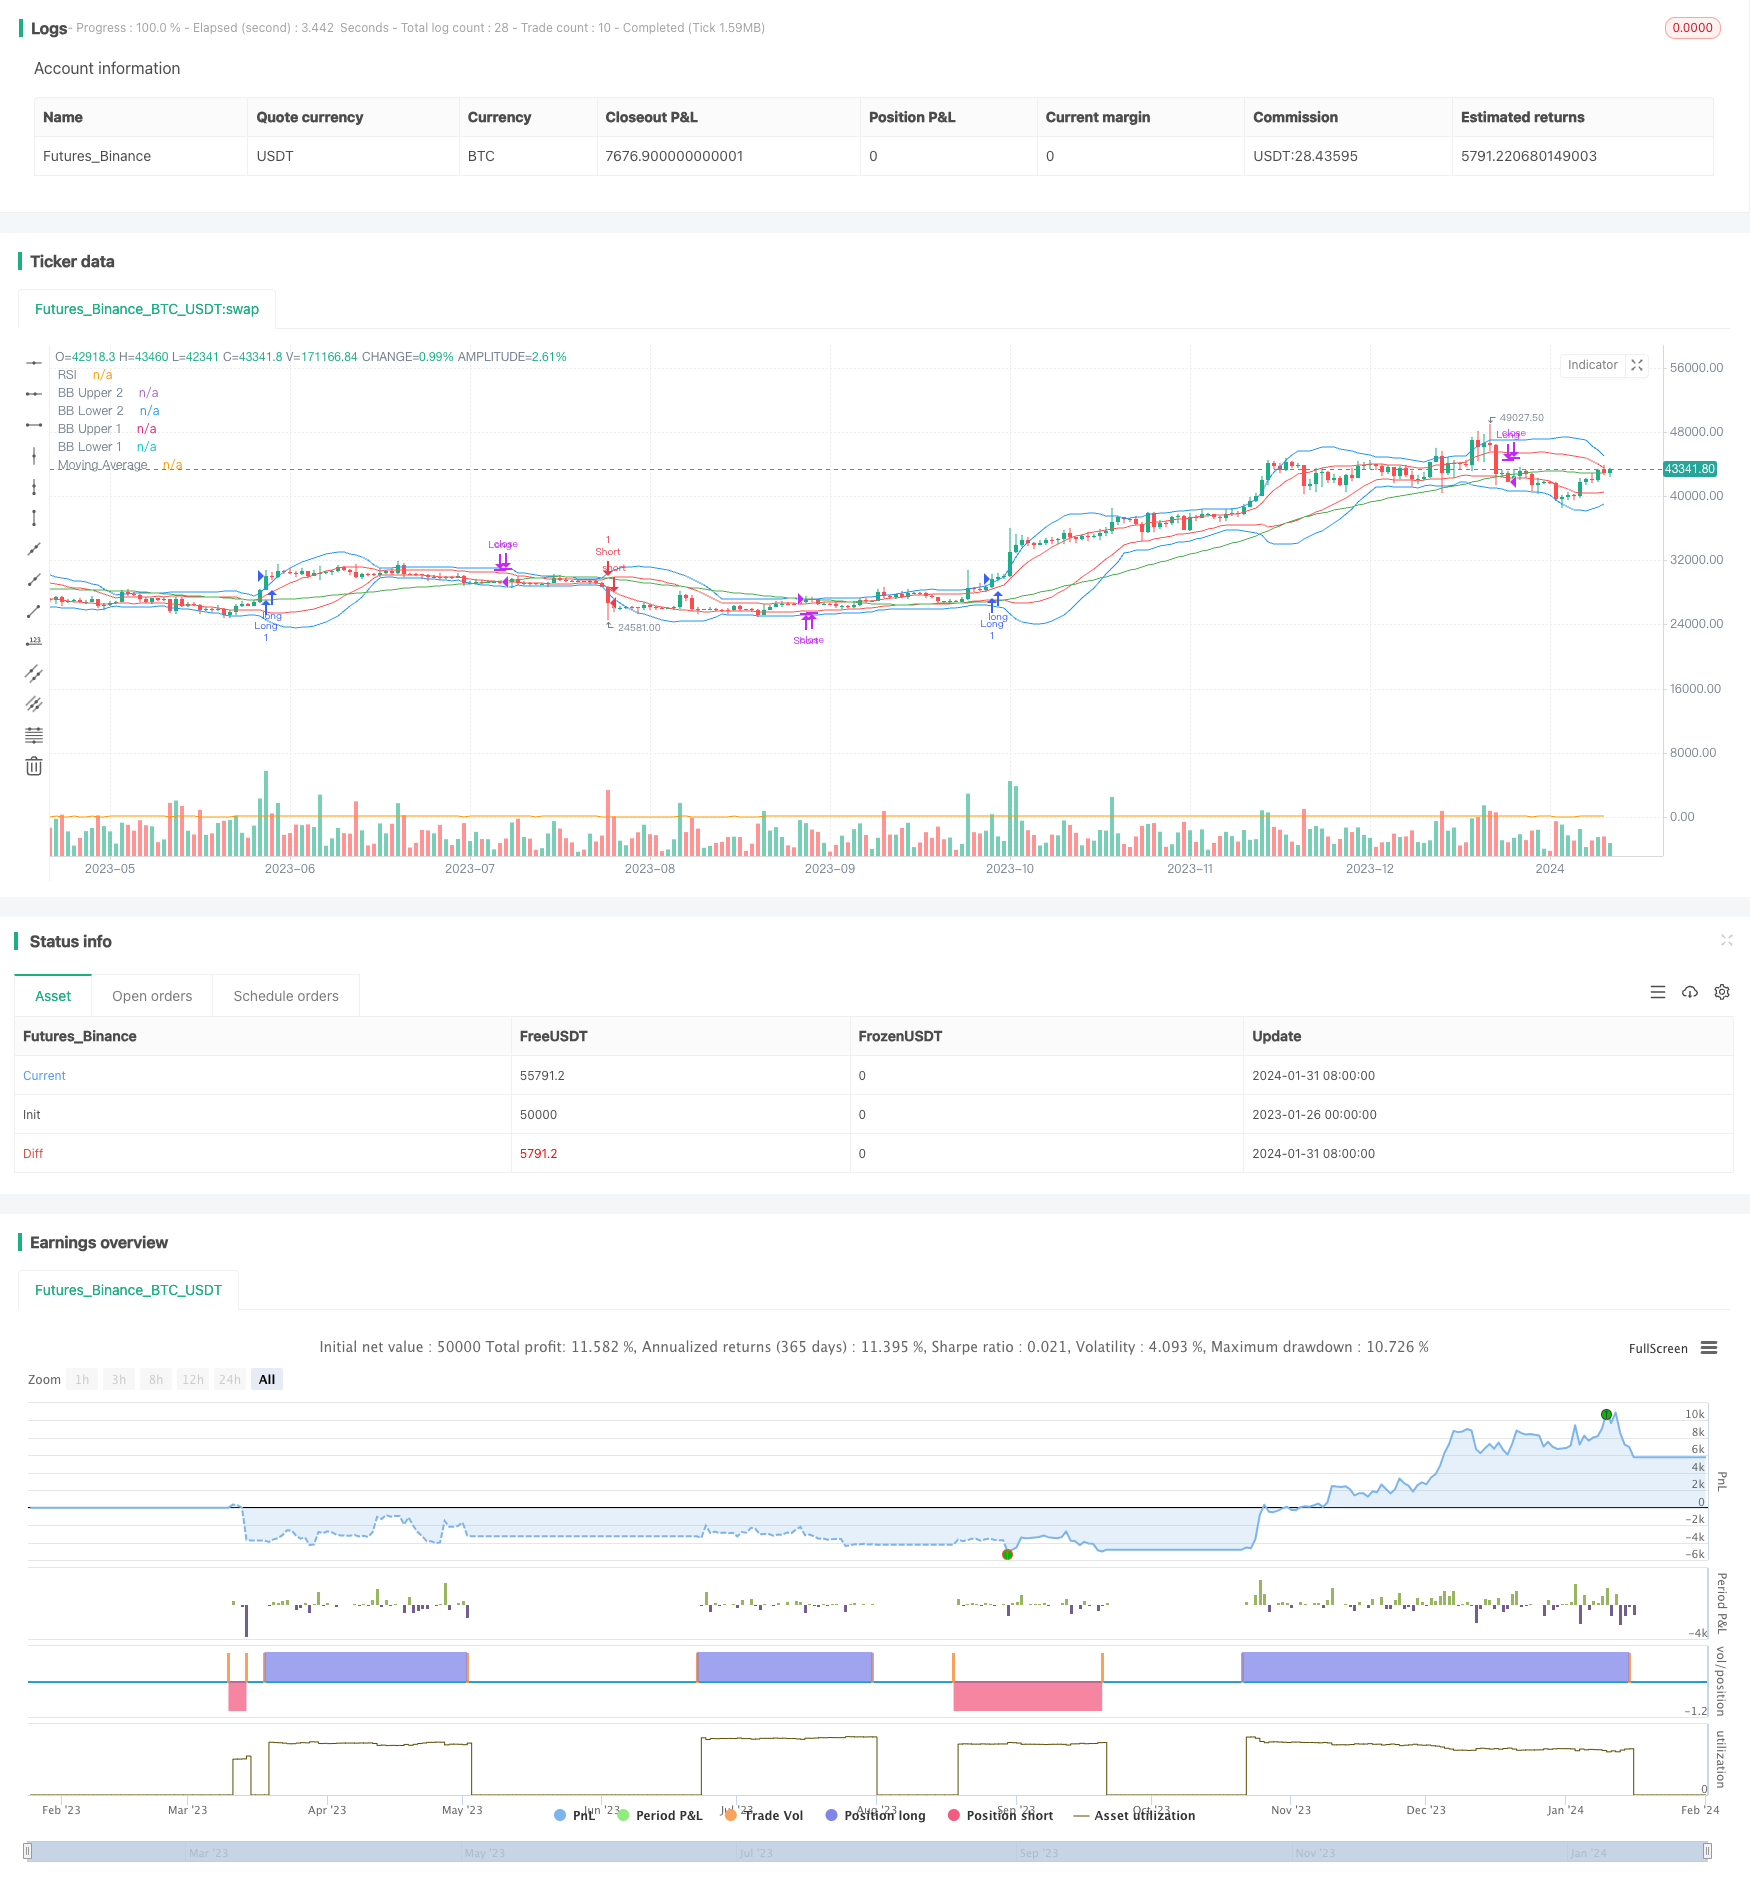
この戦略はブリン帯,RSI,移動平均の3つの指標の優位性を統合し,パラメータ最適化によって信号の正確性を向上させる.自動で取引アラートを生成し,戦略的取引を実行する.リスクは,主に揺動的な状況で誤った信号が生じることにある.トレンド判断の指標をフィルタリングすることで,無効取引を減らすことができる.全体的に,この戦略は,パラメータ最適化と複数の指標の統合を利用し,取引信号の質を向上させ,実際の検証と投入に使用する.
/*backtest
start: 2023-01-26 00:00:00
end: 2024-02-01 00:00:00
period: 1d
basePeriod: 1h
exchanges: [{"eid":"Futures_Binance","currency":"BTC_USDT"}]
*/

//@version=5
strategy("Bollinger Bands, RSI, and MA Strategy", overlay=true)

// Define input variables
b_len = input(20, title="BB Length")
bb_mult = input(2.0, title="BB Standard Deviation")
bb_deviation1 = input(1.0, title="BB Deviation 1")
rsi_len = input(14, title="RSI Length")
overbought = input(70, title="Overbought RSI Level")
oversold = input(30, title="Oversold RSI Level")
ma_len = input(50, title="MA Length")
stop_loss_percent = input(1.0, title="Stop Loss Percentage")
source = input(close, title="Source")

// Calculate Bollinger Bands
bb_upper = ta.sma(source, b_len) + bb_mult * ta.stdev(source, b_len)
bb_lower = ta.sma(source, b_len) - bb_mult * ta.stdev(source, b_len)
bb_upper1 = ta.sma(source, b_len) + bb_deviation1 * ta.stdev(source, b_len)
bb_lower1 = ta.sma(source, b_len) - bb_deviation1 * ta.stdev(source, b_len)

// Calculate RSI
rsi = ta.rsi(source, rsi_len)

// Calculate Moving Average
ma = ta.sma(source, ma_len)

// Determine if Bollinger Bands are contracting
bb_contracting = ta.stdev(source, b_len) < ta.stdev(source, b_len)[1]

// Entry conditions
enterLong = rsi > overbought and not bb_contracting
enterShort = rsi < oversold and not bb_contracting

// Exit conditions
exitLong = close < ma
exitShort = close > ma

// Exit trades and generate alerts
if strategy.position_size > 0 and exitLong
    strategy.close("Long") // Exit the long trade
    alert("Long Exit", alert.freq_once_per_bar_close)
if strategy.position_size < 0 and exitShort
    strategy.close("Short") // Exit the short trade
    alert("Short Exit", alert.freq_once_per_bar_close)

// Strategy orders
if enterLong
    strategy.entry("Long", strategy.long)
if enterShort
    strategy.entry("Short", strategy.short)
if exitLong
    strategy.close("Long")
if exitShort
    strategy.close("Short")

// Plotting Bollinger Bands
plot(bb_upper, color=color.blue, title="BB Upper 2")
plot(bb_lower, color=color.blue, title="BB Lower 2")
plot(bb_upper1, color=color.red, title="BB Upper 1")
plot(bb_lower1, color=color.red, title="BB Lower 1")

// Plotting RSI
plot(rsi, color=color.orange, title="RSI")

// Plotting Moving Average
plot(ma, color=color.green, title="Moving Average")