注文ブロックに基づくモメンタムブレイクアウト戦略

概要
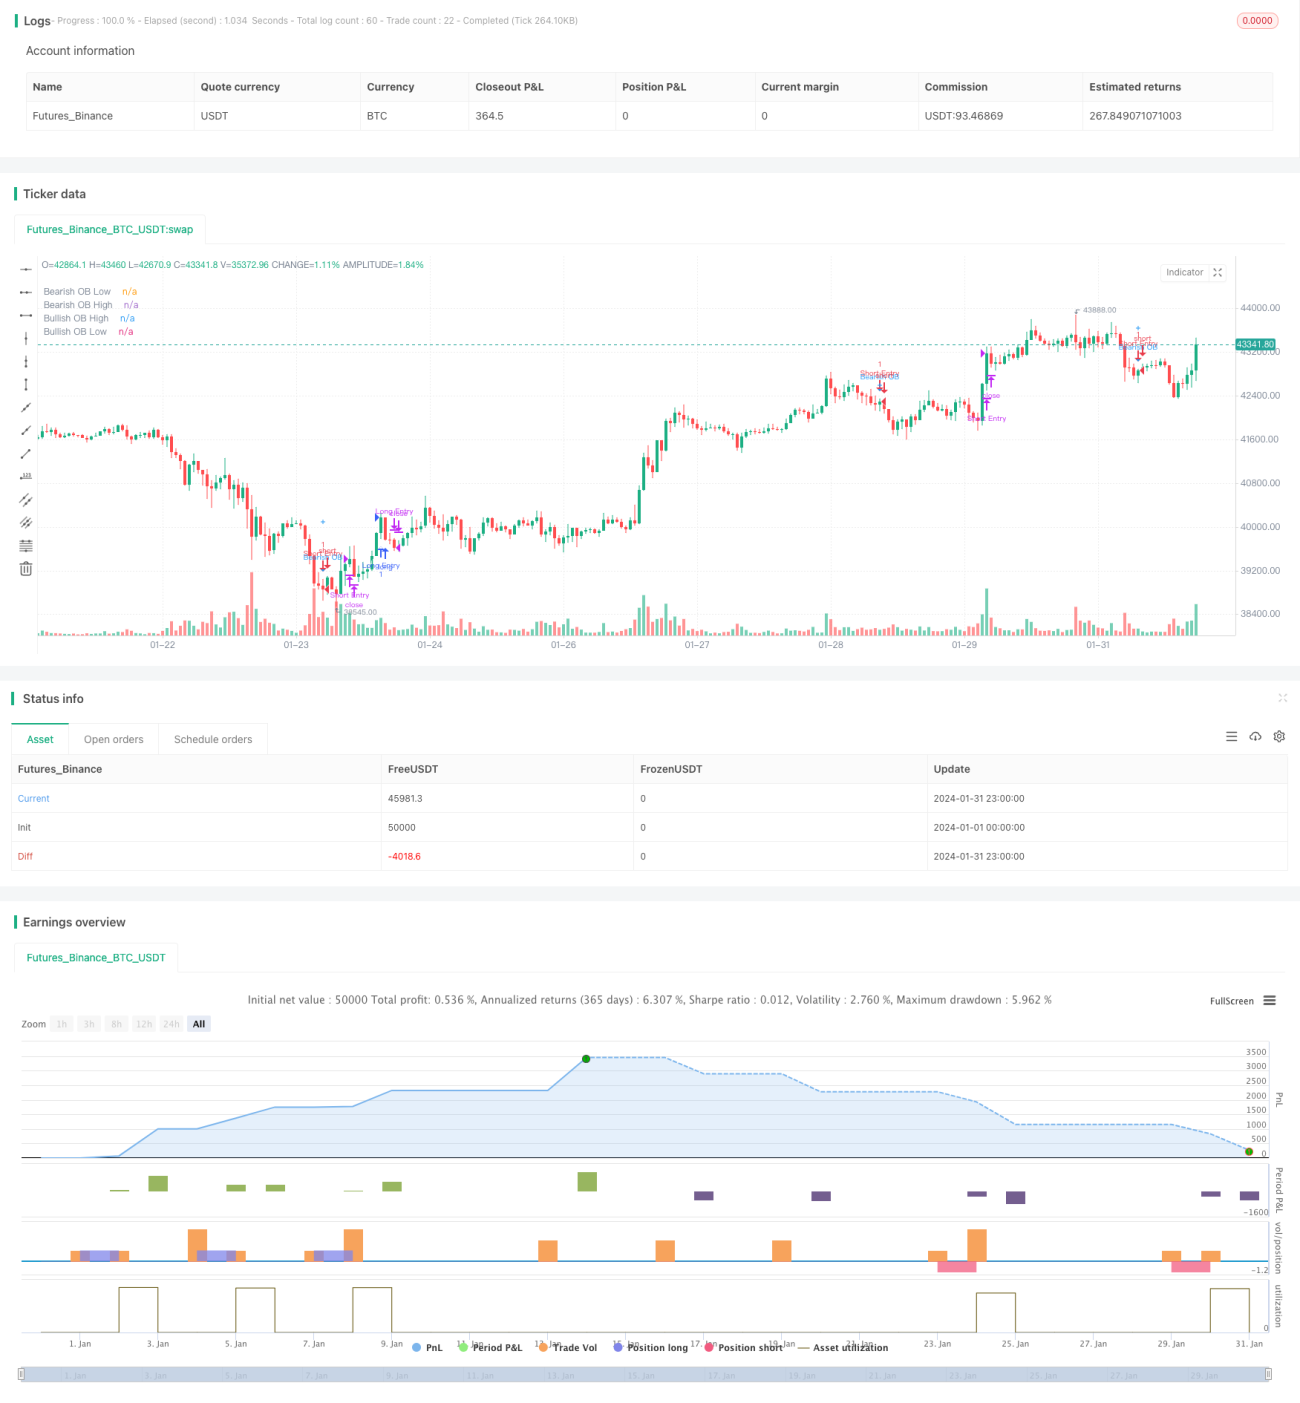
この戦略は,価格内の注文ブロックを識別して,突破力の価格区間を探し,買入シグナルが発生したときに市場に入ります. 注文ブロックは,機関が関与する領域をマークし,市場のより大きな力の表現です. したがって,注文ブロックシグナルが発生したときに,傾向的な価格変動が発生する可能性が高いです.
戦略原則
注文ブロックの識別
注文ブロックは,多頭注文ブロックと空頭注文ブロックの2種類に分かれます. 多頭注文ブロックは,K線下 (赤K線) の後にK線上 (緑K線) の後に多頭注文ブロックと定義されます. 空頭注文ブロックは,K線上 (緑K線) の後にK線下 (赤K線) の後にK線上 (緑K線) の後に多頭注文ブロックと定義されます.
注文ブロックを識別するには,以下の条件を同時に満たす必要があります.
-
K線の色が変化する:上のK線から現在のK線にK線の色が変化する (例えば,赤から緑に,または緑から赤に).これは,新しいトレンドを始める準備が整う前に,組織が終了するかもしれない傾向を示している.
-
後続のK線は色方向一致:パラメータperiodsで指定された根数に達した後,後続のK線は同じ色方向を維持する (例えば,多頭注文ブロックの後ろのすべては緑のK線である).これは,新しい傾向が強化され,確認されたことを示している.
-
<unk>値を超えた<unk>値: 注文ブロックの開値からKラインの閉値までの<unk>値が,パラメータのthresholdの設定 ((デフォルト0)) を超える.これは,新しいトレンドが十分な強さと影響力を確保する.
上記の3つの条件が同時に満たされると,注文ブロックの信号を認識することが確認できる.
取引信号の生成
多頭注文ブロックを識別すると,買取信号を生じ; 空頭注文ブロックを識別すると,売り込み信号を生じ.
注文ブロック信号の不確実性と再テストの可能性を考慮して,戦略は注文ブロック信号が現れたときに直接市場に出入するのではなく,図線,アラームなどの方法でトレーダーに注意を喚起する.トレーダーは,注文ブロック価格エリアの近くに適切な制限価格を配置し,価格が触発された後にトレンドに入るのを待つことができます.
戦略的優位性
オーダーフロー情報による動量認識
オーダーブロックは,機関資金と大量取引量の関与を象徴し,市場勢力の転換を代表する.したがって,オーダーブロックシグナルには一定の予測性と正確性があり,潜在的な突破方向を事前に捉えることができる.これは,トレンドに乗るのに有利な位置づけとタイミングを提供する.
ポリシーのパラメータは調整できます.
戦略のパラメータは,歴史のK線数,突破力の幅など,パラメータによって調整され,異なる市場環境とトレーダーのスタイルに最適化され,戦略の適応性を向上させることができます.
リスクはコントロールできます
戦略は,注文ブロックの信号が現れたときに実際に市場に出入するのではなく,アラームを設定し,オフラインの制限価格の方法によってポジションを構築する.この方法は,トレーダーが特定の入場ポイントとリスクをコントロールできるようにする.注文ブロックの信号が誤って判断されても,制限価格の指示が触発されないことにつながり,リスクは制御可能である.
戦略リスク
オーダーブロックの信号が再テストされる可能性が高い
注文ブロックは区間を標識するので,その後の価格が再びその区間を回調する確率は高い.したがって,注文ブロックの信号は標準の入場信号として使用されず,予警情報として使用され,入場タイミングをトレーダー自身でさらに判断する必要があります.
パラメータを正しく設定しない場合,誤信号が発生する可能性があります.
注文ブロックのパラメータ設定 (歴史K線数,幅の<unk>値など) が不適切であれば,通常のサイドウェイズ区間で偽信号が生じる可能性があります.これは,トレーダーが市場に対して一定の感受性と判断力を必要とし,パラメータの盲目最適化を避ける必要があります.
信号の質を判断するために
オーダーブロックの信号は100%信頼できないため,信号を入手する際にトレーダーは,現在の信号の信頼性を判断するためにさらに分析する必要があります.これは一定の人工作業を増加させます.信号の質に対する異なる判断は,取引のパフォーマンスの違いにもつながる可能性があります.
戦略最適化の方向性
偽信号をフィルターする他の指標と組み合わせる
注文ブロックの信号が表示されたとき,他の指標と組み合わせてトレンドの方向と強さを判断することができます.例えば,MACD,RSIなどと組み合わせて,パラメータ設定による誤った信号をフィルタリングし,信号の正確性を向上させます.
パラメータの設定を最適化
異なる市場と異なる取引品種は,K線数,<unk>値の<unk>値などのパラメータをテストし,最適化して,現在の市場環境に適合させることができます.また,パラメータの自律的適応機能を設定して,市場の波動性やリスク好みに応じて自動的に調整することができます.
自動入場・退出の仕組みを開発する
現在,戦略は信号提示ツールとしてのみ使用され,トレーダーは自己判断で入場時間を判断する必要があります.我々は,注文ブロックの価格区間を対象に自動注文機構を開発し,一定の条件を満たしたときに自動的に入場します.そして,停止などの方法と組み合わせて,退出論理を設定し,人工判断の要求を軽減し,戦略の自動化程度を高めます.
要約する
この戦略は,注文流量集中的価格区間を効果的に識別し,市場に隠された動力の情報を掘り出し,トレンドに乗る価格突破に有利な位置付けと把握の機会を提供します. 単純にトレンドを追跡する方法と比較して,注文ブロック戦略は一定の頭部識別能力と主動性を持っています. 参数最適化,風力制御方法と組み合わせて使用すると,効果的なトレンド戦略になることができます. しかし,トレーダーは誤った信号の発生に警戒し,信号の品質について判断する必要があります.
- 1