トリプルBBバンドのクローズブレイクスルーとRSIインジケーターの組み合わせ取引戦略
作成日:
2024-02-29 14:57:49
最終変更日:
2024-02-29 14:57:49
コピー:
2
クリック数:
735
1
フォロー
1751
フォロワー
概要
この戦略は,ブルイン帯の指標と比較的強い指数であるRSIの指標を組み合わせて取引シグナルを生成する.それは,3つのK線のクローズアップ価格が同時に上線または下線を突破するかどうかを監視し,ターン指標とRSIの指標を組み合わせて取引シグナルを確認する.
戦略原則
この戦略は以下の原則に基づいています.
- 20の長さのブリン帯を使用し,価格が上位または下位を突破したときに取引シグナルを発信することを考慮します.
- K線の3つの閉盘価格を同時に突破することを要求し,偽突破を避ける
- ターンゲン指標と組み合わせた,強超買い時のVIP>1.25,強超売り時のVIM>1.25,フィルタリング信号
- RSIの指数と組み合わせて,超買いと超売りを判断します. RSIの70を超えると空白を考慮し,RSIの30を超えると余剰を考慮します.
- 上記の条件を満たすと,多行または空の信号を生成する
優位分析
この戦略の利点は以下の通りです.
- 三重BBバンドは偽突破をフィルターし,突破の信頼性を確保する
- 市場を判断し,不利な取引を避けるためのギアリング指標
- RSIは,ブリン帯の指標と併用して,超買いと超売り領域を判断します.
- 複数の指標の組み合わせ,市場状況を総合的に判断し,信号の信頼性が高い
リスク分析
この戦略にはいくつかのリスクがあります.
- ブリン帯の指標はパラメータに敏感で,長さとStdDev倍数に最適化する必要があります.
- ターゲットの指標は周期性パラメータにも敏感で,異なる市場では調整が必要である.
- RSIはトレンドを見逃す可能性が高い
- 3つの指標で意見が分かれれば,入場できず,機会が逃れることになる.
リスク管理には以下のようなものがあります.
- 最適化パラメータ,tested 勝利率が最も高いパラメータ
- 取引量フィルターなどの他の指標と組み合わせた
- 適切な指数判断の論理を緩め,チャンスを逃さないようにする.
最適化の方向
この戦略は以下の点で最適化できます.
- ブリン帯の指標の長さとStdDev倍数を最適化して最適なパラメータを見つけます.
- ターン指標の周期を最適化して,異なる市場に適合させる
- 取引量,macdなどの他の指標の判断を追加し,多元化信号を豊かにします.
- 指数判断の論理を調整し,指数の差異が入学不合格に繋がらないようにする
- 単一取引の最大損失を制御するために,ストップ・ロスの策略を増やす.
要約する
この戦略は,複数の指標を総合的に使用して判断し,信号の信頼性を確保する一方で,一定の問題もある.パラメータ最適化,信号源の充実,判断論理の調整,およびストップ・ローズなどの手段によって,戦略の安定性と収益性をさらに強化することができる.それは,量化取引のための良い考えを提供している.
ストラテジーソースコード
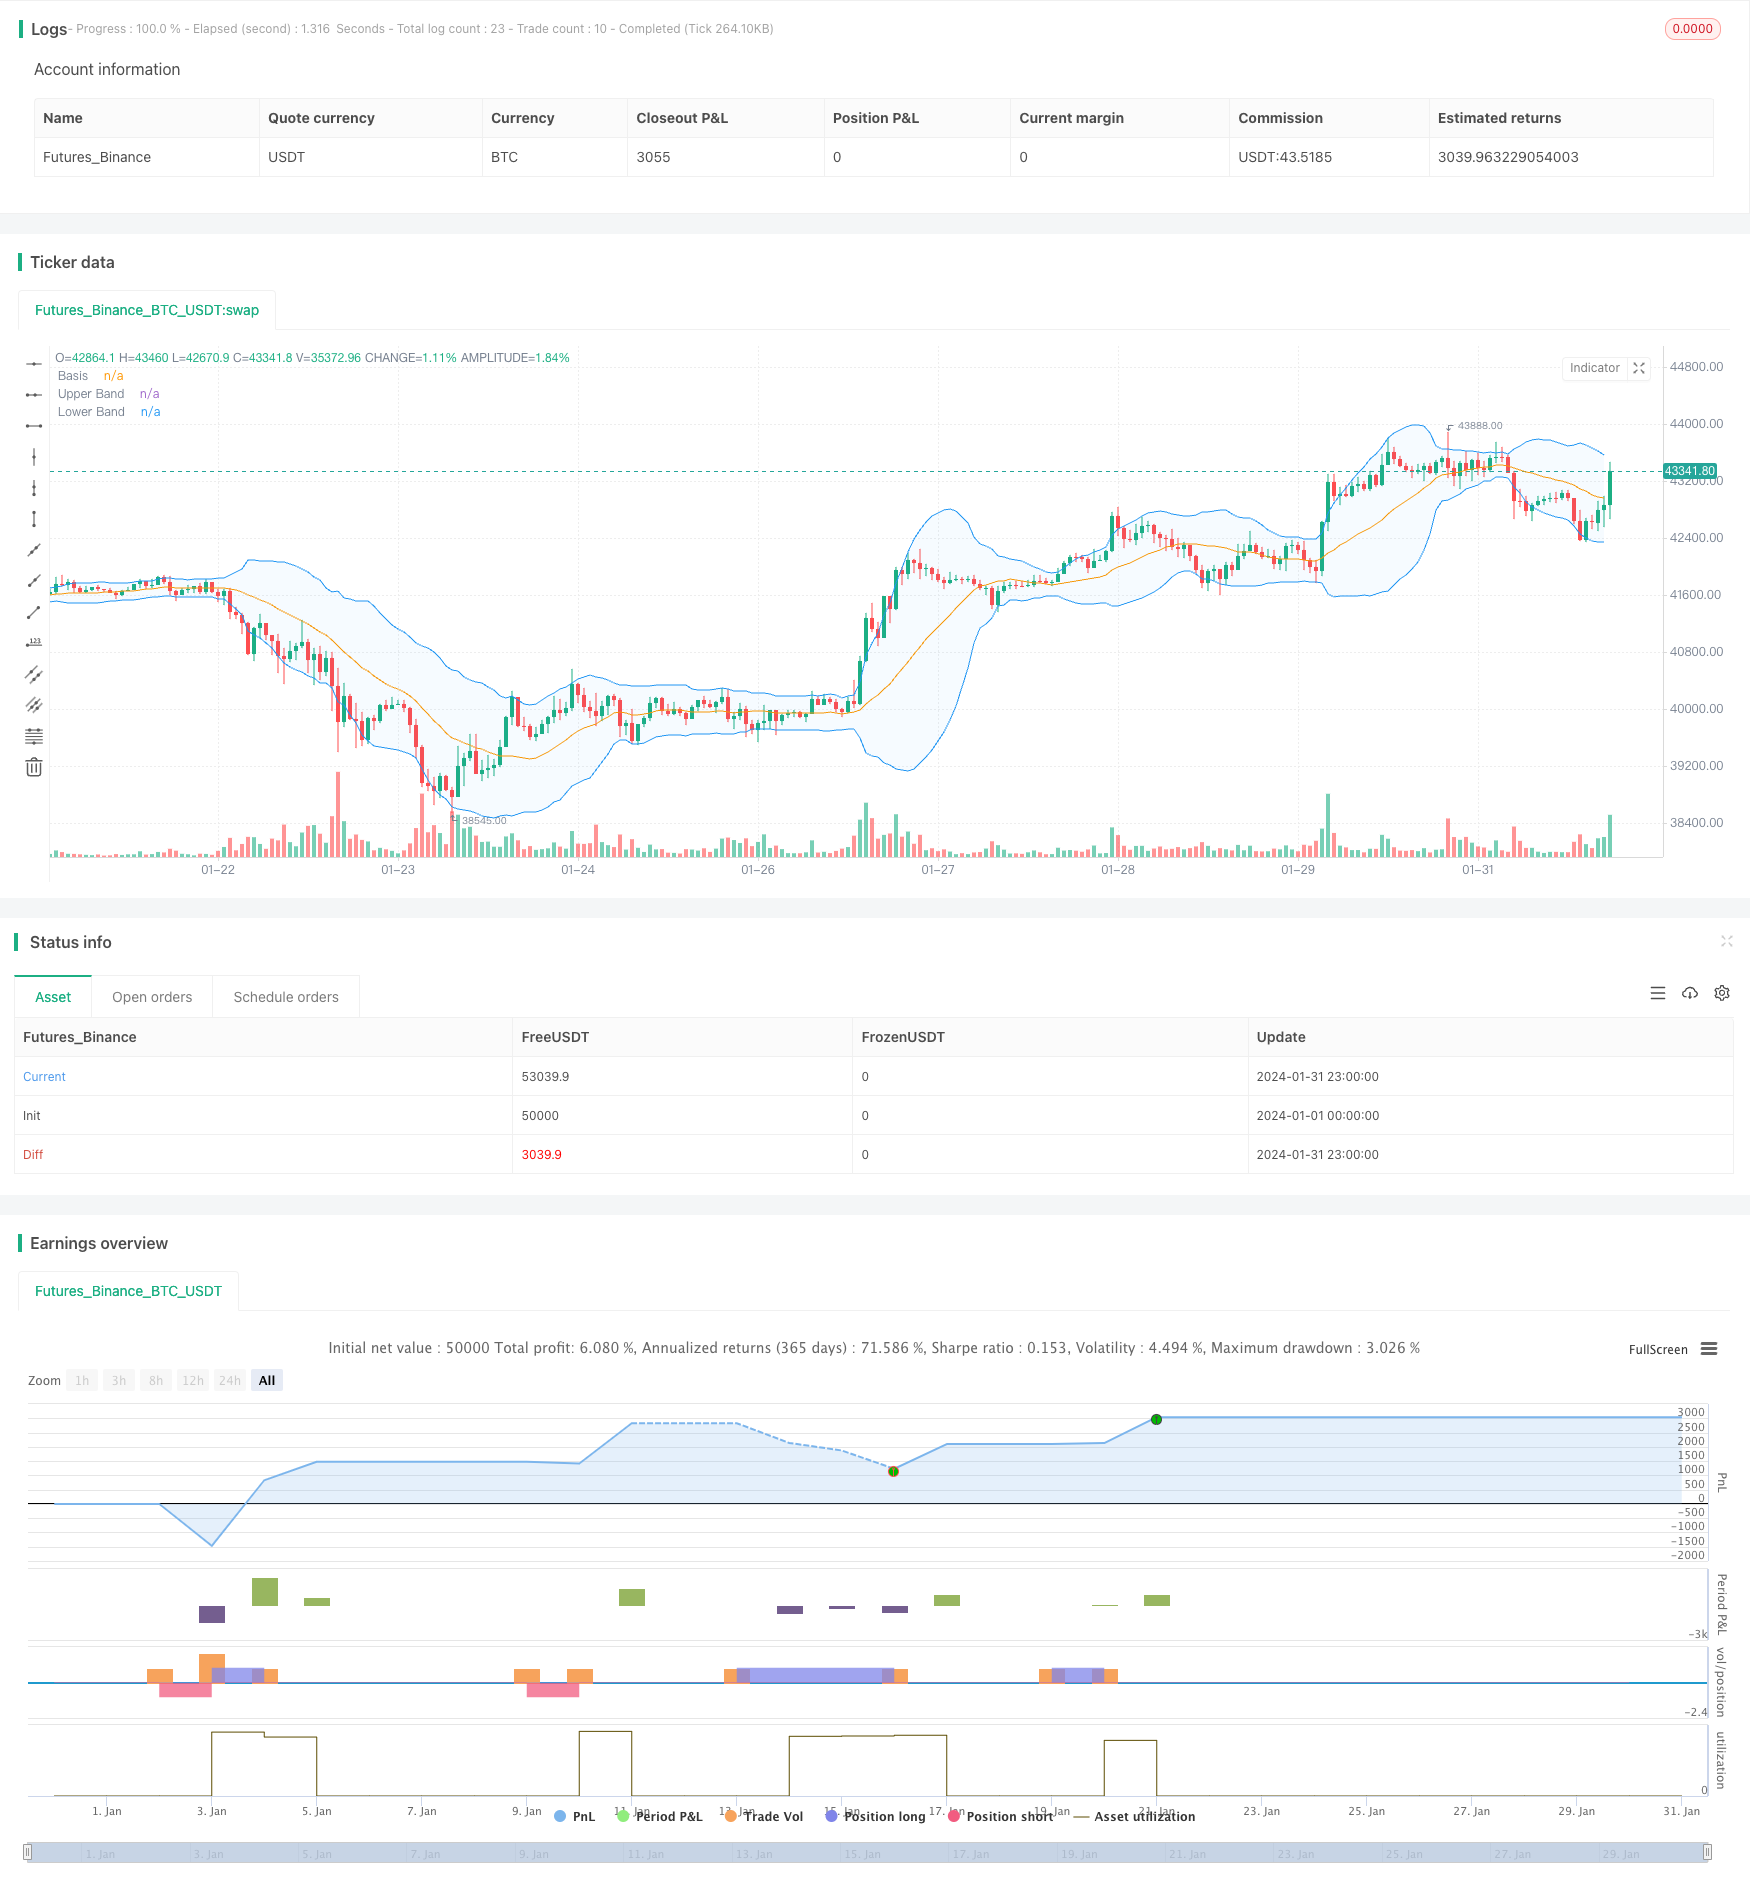
/*backtest
start: 2024-01-01 00:00:00
end: 2024-01-31 23:59:59
period: 1h
basePeriod: 15m
exchanges: [{"eid":"Futures_Binance","currency":"BTC_USDT"}]
*/

// This Pine Script™ code is subject to the terms of the Mozilla Public License 2.0 at https://mozilla.org/MPL/2.0/
// © Noway0utstorm

//@version=5
strategy(title='RSI + BB  over 3 bar+--- vortex0.71.3  ', shorttitle='NoWaytruongphuthinh', format=format.price, precision=4,overlay = true)

length = input(20, title="Length")
mult = input(2.0, title="Multiplier")
source = close

basis = ta.sma(source, length)
dev = mult * ta.stdev(source, length)

upperBand = basis + dev
lowerBand = basis - dev

isClosedBar = ta.change(time("15"))

var bool closeAboveUpperBand = false
var bool closeBelowLowerBand = false


// Vortex Indicator Settings
period_ = input.int(14, title='Period', minval=2)

VMP = math.sum(math.abs(high - low[1]), period_)
VMM = math.sum(math.abs(low - high[1]), period_)
STR = math.sum(ta.atr(1), period_)
VIP = VMP / STR
VIM = VMM / STR

//
lengthrsi = input(14, title="RSI Length")
overboughtLevel = input(70, title="Overbought Level")
oversoldLevel = input(30, title="Oversold Level")

sourcersi = close
rsiValue = ta.rsi(sourcersi, lengthrsi)

shouldShort = rsiValue > overboughtLevel
shouldLong = rsiValue < oversoldLevel


if bool(isClosedBar[1]) and bool(isClosedBar[2]) and bool(isClosedBar[3])

    if close[1] > upperBand[1] and close[2] > upperBand[2] and close[3] > upperBand[3] and VIP > 1.25 and VIM < 0.7 and rsiValue > overboughtLevel
        strategy.entry("Short", strategy.short)
        closeAboveUpperBand := false  // Reset the condition when entering a new Short position
    if close[1] < lowerBand[1] and close[2] < lowerBand[2] and close[3] < lowerBand[3] and VIP < 0.7 and VIM > 1.25 and rsiValue < oversoldLevel
        strategy.entry("Long", strategy.long)
        closeBelowLowerBand := false  // Reset the condition when entering a new Long position


if strategy.position_size > 0  // Check if there is an open Long position
    closeAboveUpperBand := close > upperBand  // Update the condition based on close price
    if closeAboveUpperBand
        strategy.close("Long",disable_alert=true)  // Close the Long position if close price is above upper band

if strategy.position_size < 0  // Check if there is an open Short position
    closeBelowLowerBand := close < lowerBand  // Update the condition based on close price
    if closeBelowLowerBand
        strategy.close("Short",disable_alert=true)  // Close the Short position if close price is below lower band

// Plots
plot(basis, color=color.orange, title="Basis")
p1 = plot(upperBand, color=color.blue, title="Upper Band")
p2 = plot(lowerBand, color=color.blue, title="Lower Band")
fill(p1, p2, title = "Background", color=color.rgb(33, 150, 243, 95))