トリプルMACD移動平均クロスオーバーと相対力指数を組み合わせた高頻度暗号通貨取引戦略

概要
この記事では,TrippleMACD平均線交差と相対的に弱い指標 ((RSI)) を組み合わせた高周波暗号通貨取引戦略について説明します.この戦略は,3つの異なるパラメータのMACD指標を利用し,それらのシグナルラインを平均し,同時にRSI指標と組み合わせて最適な買入と販売のタイミングを決定します.この戦略は,1分間の時間枠での自動取引として設計され,多頭取引のみを考慮します.さらに,この戦略は,市場の整合期を識別するために,線形還元を利用し,揺れの中での取引を回避します.
戦略原則
この戦略の核心は,3つの異なるパラメータのMACD指標を使用して,異なる時間尺度のトレンドシグナルを捉えることです.この3つのMACD指標の信号ラインを平均することで,ノイズを効果的に平らげ,より信頼性の高い取引信号を提供します.同時に,RSI指標は,多頭トレンドの強さを確認するために使用されます.この戦略は,すべての3つのMACD指標が多頭トレンドの強さを示し,RSI指標も多頭トレンドの強さを確認したときにのみ,購入シグナルを発信します.
さらに,この戦略は,市場が収束段階にあることを識別するために線形回帰を使用する. <unk>図上の下影線と実体比を計算することによって,現在の市場が収束状態にあるかどうかを判断することができる. 上下影線の長さが実体長さの2倍以上である場合,市場は収束段階にあると考えられ,この戦略は,この時点で取引を回避する.
優位分析
-
マルチタイムスケール分析:この戦略は,3つの異なるパラメータのMACD指標を使用して,異なる時間スケールのトレンド信号を捉え,取引の正確性と信頼性を向上させます.
-
信号平準化: 3組のMACD指標の信号線を平均することで,ノイズを効果的に平準化して,単一の指標で発生する可能性のある誤導的な信号を回避する.
-
トレンド確認:多頭トレンドの強さを確認するためにRSIと組み合わせることで,取引シグナルの信頼性をさらに高めることができます.
-
整合識別: 市場整合の段階を識別するために線形回帰を使用し,波動的な状況で取引を避けるため,戦略のリスクを軽減します.
-
自動取引:この戦略は,1分間の時間枠で自動取引を設計し,市場の変化に迅速に反応し,取引を実行し,取引効率を向上させます.
リスク分析
-
パラメータ最適化:この戦略は,三組のMACD指標の快慢線周期,RSI指標の周期など,複数のパラメータに関与する.これらのパラメータの選択は,戦略のパフォーマンスに重要な影響を与える.パラメータ最適化が不適切であれば,戦略の性能が低下する可能性があります.
-
過度に適合するリスク:この戦略は,特定の歴史的データでうまく機能するかもしれないが,実際の応用では,市場の変化に適応できず,戦略が失敗する可能性がある.
-
ブラック・スウィーン・イベント:この戦略は,技術的な指標に大きく基づいており,いくつかの重要な基本的イベントに対して,反応が不十分である可能性があり,これは,戦略が極端な市場環境で不十分なパフォーマンスを発揮する可能性がある.
最適化の方向
-
動的パラメータ調整:市場の状況の変化に合わせて,戦略のパラメータ,例えばMACD指標の快慢線周期,RSI指標の周期などに動的に調整し,異なる市場環境に対応する.
-
より多くの指標を追加:既存のMACDとRSIの指標に基づいて,取引シグナルの正確性と信頼性をさらに向上させるために,ブリン帯,移動平均などの他の技術指標を追加することを検討することができます.
-
リスク管理の最適化: 戦略に動的停止,ポジション管理などのより優れたリスク管理措置を加え,戦略の全体的なリスクを低減する.
-
機械学習最適化: 戦略のパラメータと取引ルールを最適化するために,戦略の適応性と安定性を高めるために,神経ネットワーク,支持ベクトルマシンなどの機械学習アルゴリズムを使用する.
要約する
この記事では,TrippleMACD均線交差とRSI指標を組み合わせた高周波暗号通貨取引戦略を紹介する.この戦略は,3つの異なるパラメータのMACD指標とRSI指標を利用して信頼できる取引信号を生成し,同時に,市場の収束段階を認識するために線形回帰を利用して,揺れの中での取引を避ける.この戦略の優点は,複数の時間尺度で信号を分析し,平滑化,トレンド確認,収束を認識し,自動化取引などの側面にあります.しかし,パラメータ最適化,過度調整,ブラック天文などのリスクもあります.将来,この戦略は,パラメータ最適化,より多くの指標の追加,リスク管理の最適化,機械学習の最適化などの側面から改善され,適応性と安定性を向上させ,暗号通貨市場の変化によりよく対応することができます.
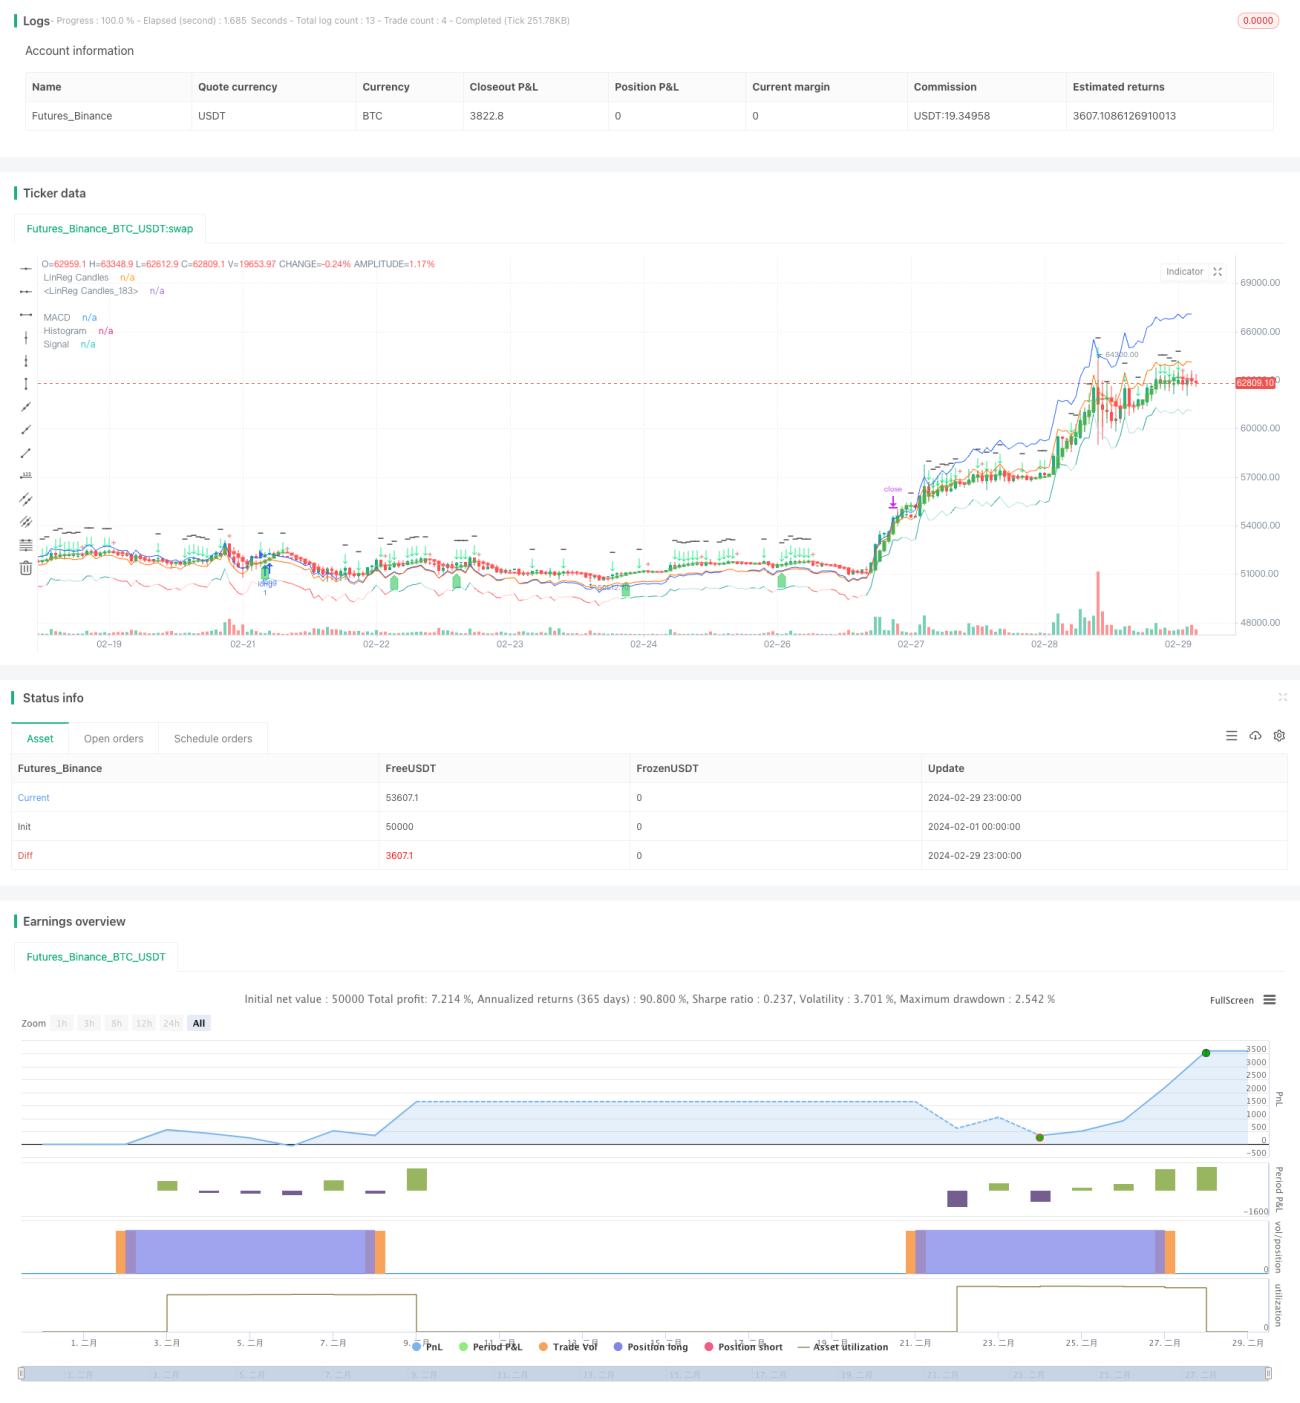
/*backtest
start: 2024-02-01 00:00:00
end: 2024-02-29 23:59:59
period: 1h
basePeriod: 15m
exchanges: [{"eid":"Futures_Binance","currency":"BTC_USDT"}]
*/

//@version=5
//indicator("Triplle",shorttitle="Triplle MACD", overlay=true, scale = scale.none)
//indicator("Triplle","TrippleMACD",true)
strategy(title="TrippleMACD", shorttitle="TrippleMACD + RSI strategy", format=format.price, precision=4, overlay=true)- 1