1
フォロー
1750
フォロワー
概要
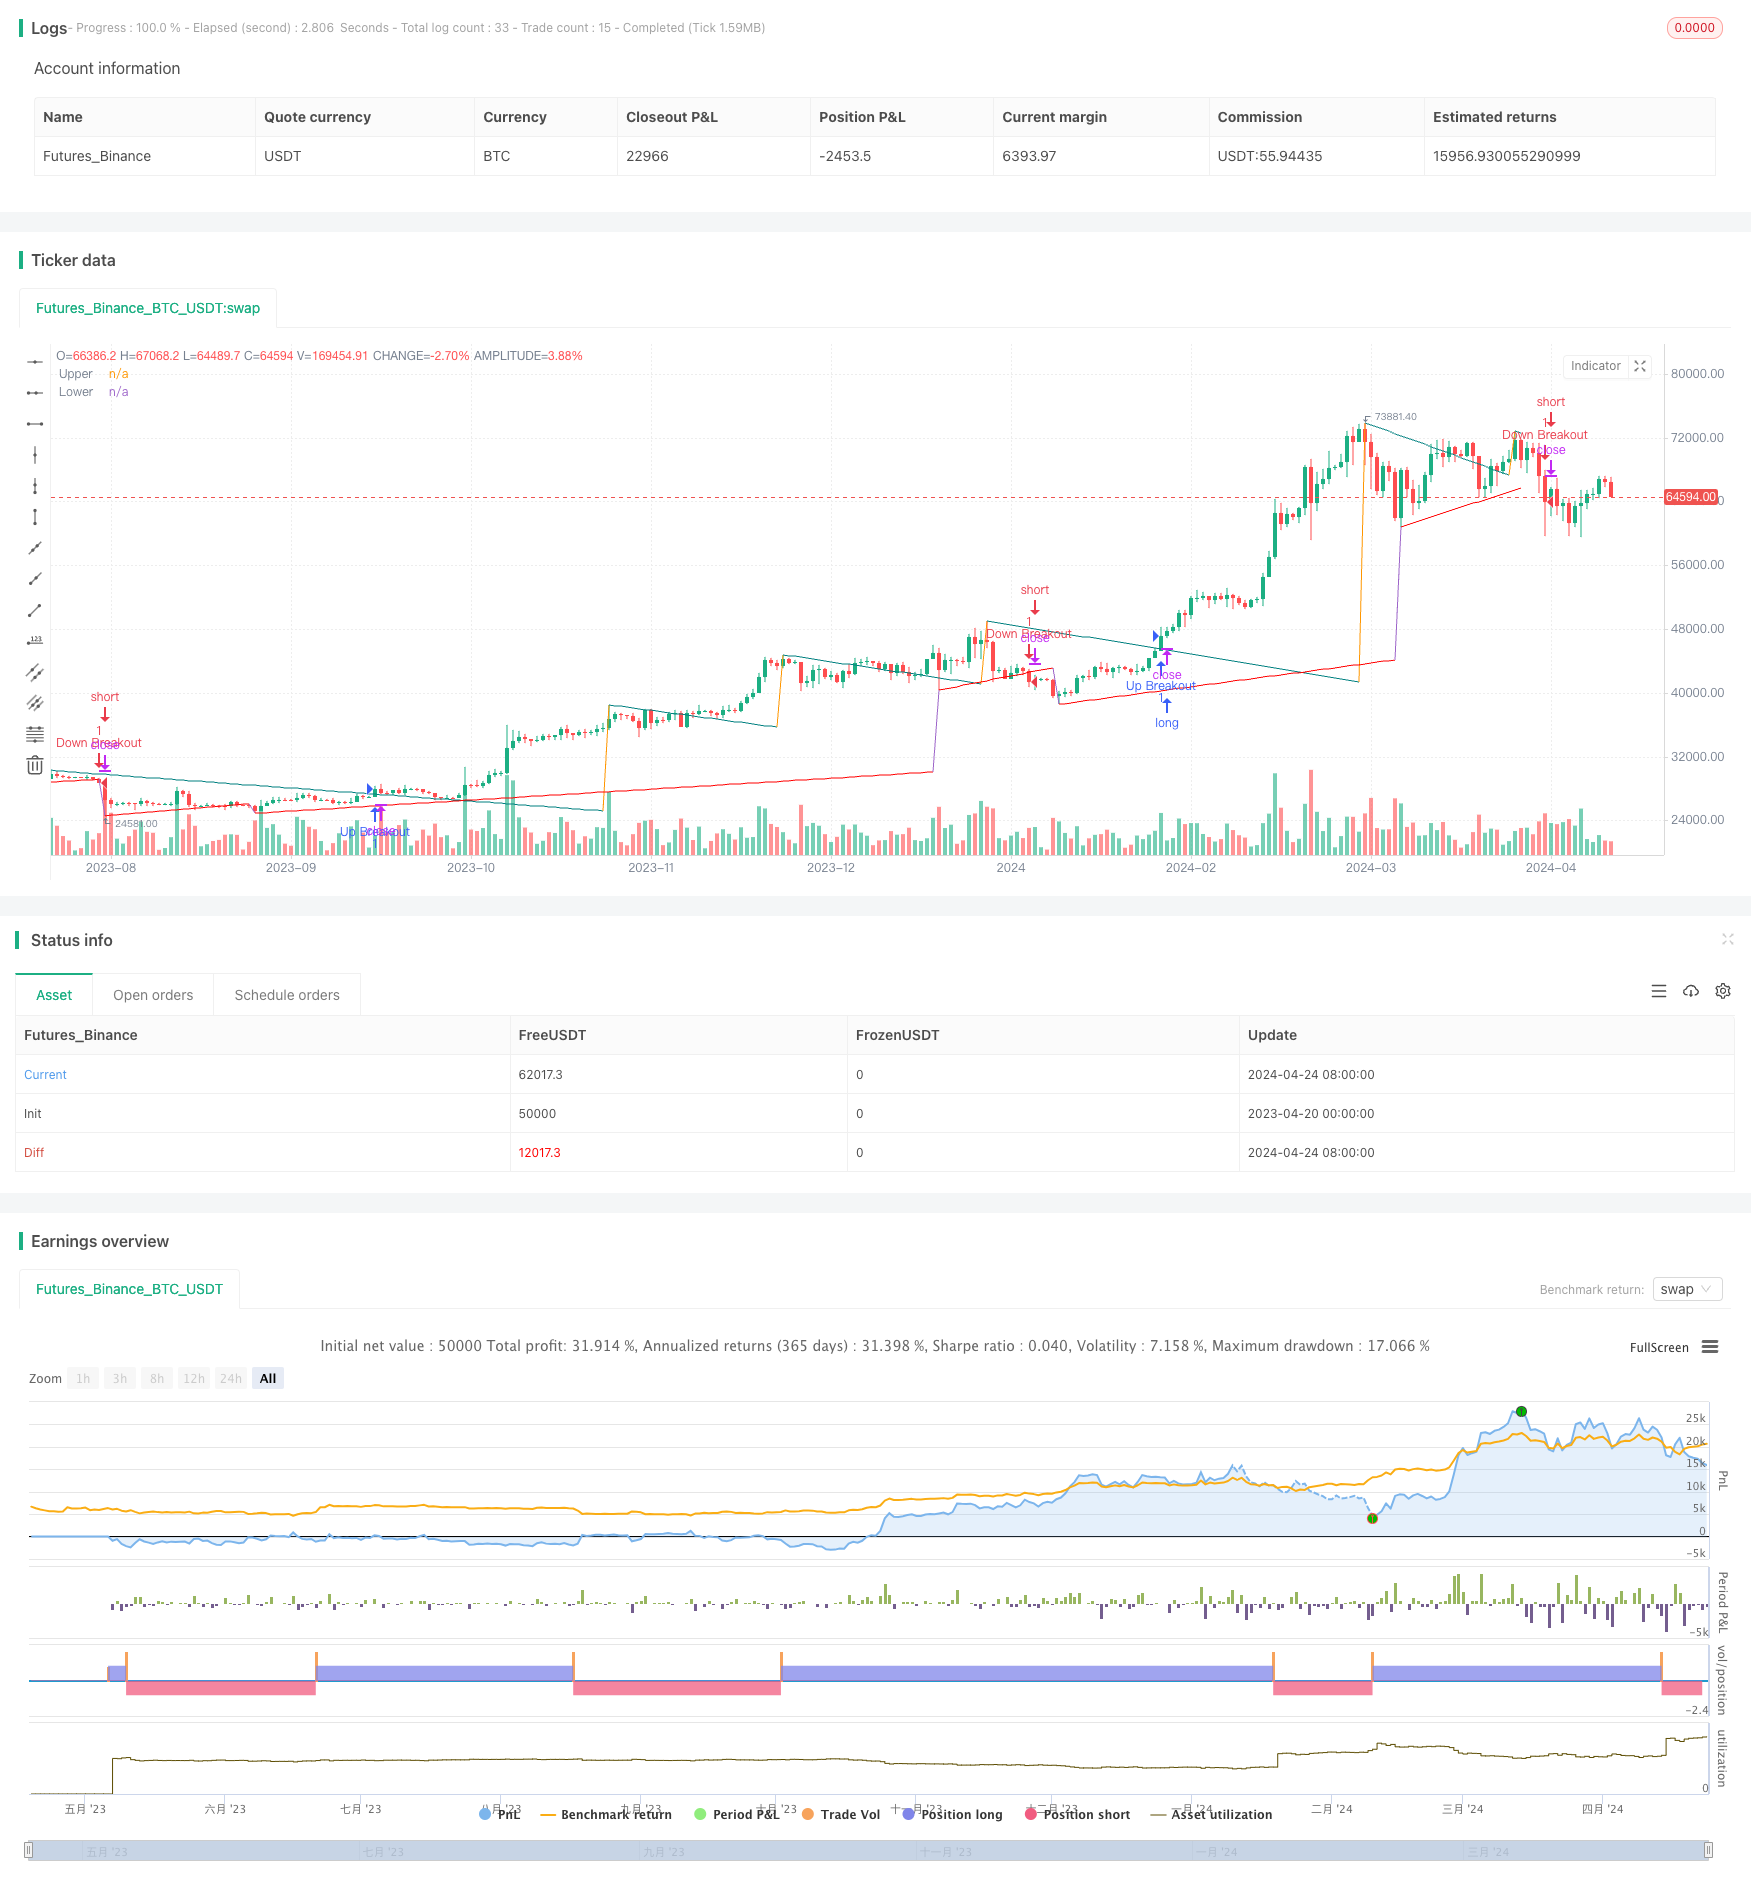
この戦略は,支柱 ((PivotHighとPivotLow) を使用して,価格の波動的高点と低点を識別し,それに基づいて上下トレンドラインを描きます.トレンドラインの傾きは,ATR ((平均リアルレンジ)),標準差または線形回帰などの方法によって計算され,傾き因子で調整されます.価格がトレンドラインを突破すると,この戦略は,購入または販売のシグナルを生成します.
戦略原則
- ta.pivothigh ((() とta.pivotlow ((() の関数を用いて,過去一定の周期における波動高点 (((ph)) と波動低点 (((pl)) を検出する.
- 選択した計算方法 ((ATR,標準差または線形回帰) に基づいてトレンドラインの斜率を計算し,斜率因子 ((mult) で調整する.
- 斜率と支点価格を使用して,上向きのトレンドライン (upper) と下向きのトレンドライン (lower) の現在の値を計算します.
- 現在の閉店価格がトレンドラインを突破したかどうかを判断する.閉店価格が上向きトレンドラインより高い場合は,上向きの突破シグナルを生成する.閉店価格が下向きトレンドラインより低い場合は,下向きの突破シグナルを生成する.
- トレンドラインをグラフに描いて,トレンドラインを延長するかどうかを選択します.
- 突破シグナルに従って取引する:上へ突破して多項開く,下へ突破して空項開く.
戦略的優位性
- この戦略は,価格行動の客観的な事実 (支点とトレンドライン) に基づいて取引信号を生成し,一定の信頼性と安定性を持っています.
- トレンドラインの傾きは,市場の変動に応じて動的に調整され,異なる市場環境に適応することができます.
- ユーザは,斜率計算方法とパラメータの設定を柔軟に選択して,戦略のパフォーマンスを最適化できます.
- 戦略は,リアルタイム信号と遅延信号の2つのモードを提供し,異なるユーザーのニーズを満たすことができます.
- 警告機能が内蔵されているため,取引機会を早期に入手できます.
戦略リスク
- この戦略は,波動的な市場やトレンドが不明なときに,頻繁に偽信号を生じ,収益性を低下させる可能性があります.
- 戦略のパフォーマンスはパラメータ設定に依存し,不適切なパラメータは戦略の失敗や過剰な取引を引き起こす可能性があります.
- 遅延シグナルモードでは,反測があるため,実際の取引結果と歴史テストの結果が異なる可能性があります.
戦略最適化の方向性
- トレンドラインの突破信号の確認を支援し,信号の質を向上させるため,取引量,変動率などの技術指標や価格行動特性を導入します.
- トレンドラインの破綻の持続時間や破綻の幅などの要因を考慮して取引信号をフィルターして,偽信号を減らす.
- ポジション管理とリスク管理を最適化します.例えば,市場トレンドの強さや波動率の動向に応じてポジションサイズを調整し,合理的なストップ・ロズとストップ・ストップの位置を設定します.
- パラメータを最適化します.例えば,機械学習や最適化アルゴリズムを使用して,最適なパラメータの組み合わせを探します.
要約する
この戦略は支点とトレンドラインの斜率を利用して,リアルタイムでトレンドライン取引システムを構築する.トレンドラインの突破事件を捕捉することで,戦略はトレンド形成の初期段階で取引することができる.この戦略には一定の利点があるにもかかわらず,揺れ動いている市場でのリスクに注意し,より多くの情報,最適化されたシグナルフィルタリングおよびポジション管理などの方法を導入することにより,戦略の安定性と収益性をさらに向上させる必要がある.
ストラテジーソースコード
/*backtest
start: 2023-04-20 00:00:00
end: 2024-04-25 00:00:00
period: 1d
basePeriod: 1h
exchanges: [{"eid":"Futures_Binance","currency":"BTC_USDT"}]
*/

//@version=5
strategy(" only Ajay ", overlay=true)

//------------------------------------------------------------------------------
//Settings
//------------------------------------------------------------------------------{
length = input.int(14, 'Swing Detection Lookback')
mult = input.float(1., 'Slope', minval = 0, step = .1)
calcMethod = input.string('Atr', 'Slope Calculation Method', options = ['Atr','Stdev','Linreg'])
backpaint = input(true, tooltip = 'Backpainting offset displayed elements in the past. Disable backpainting to see real time information returned by the indicator.')

//Style
upCss = input.color(color.teal, 'Up Trendline Color', group = 'Style')
dnCss = input.color(color.red, 'Down Trendline Color', group = 'Style')
showExt = input(true, 'Show Extended Lines')

//------------------------------------------------------------------------------}
//Calculations
//------------------------------------------------------------------------------{
var upper = 0.
var lower = 0.
var slope_ph = 0.
var slope_pl = 0.

var offset = backpaint ? length : 0

n = bar_index
src = close

ph = ta.pivothigh(length, length)
pl = ta.pivotlow(length, length)

//Slope Calculation Method
slope = switch calcMethod
    'Atr'    => ta.atr(length) / length * mult
    'Stdev'  => ta.stdev(src,length) / length * mult
    'Linreg' => math.abs(ta.sma(src * n, length) - ta.sma(src, length) * ta.sma(n, length)) / ta.variance(n, length) / 2 * mult

//Get slopes and calculate trendlines
slope_ph := ph ? slope : slope_ph
slope_pl := pl ? slope : slope_pl

upper := ph ? ph : upper - slope_ph
lower := pl ? pl : lower + slope_pl

var upos = 0
var dnos = 0
upos := ph ? 0 : close > upper - slope_ph * length ? 1 : upos
dnos := pl ? 0 : close < lower + slope_pl * length ? 1 : dnos

//------------------------------------------------------------------------------}
//Extended Lines
//------------------------------------------------------------------------------{
// var uptl  = line.new(na,na,na,na, color = upCss, style = line.style_dashed, extend = extend.right)
// var dntl  = line.new(na,na,na,na, color = dnCss, style = line.style_dashed, extend = extend.right)

// if ph and showExt
//     uptl.set_xy1(n-offset, backpaint ? ph : upper - slope_ph * length)
//     uptl.set_xy2(n-offset+1, backpaint ? ph - slope : upper - slope_ph * (length+1))

// if pl and showExt
//     dntl.set_xy1(n-offset, backpaint ? pl : lower + slope_pl * length)
//     dntl.set_xy2(n-offset+1, backpaint ? pl + slope : lower + slope_pl * (length+1))

//------------------------------------------------------------------------------}
//Plots
//------------------------------------------------------------------------------{
plot(backpaint ? upper : upper - slope_ph * length, 'Upper', color = ph ? na : upCss, offset = -offset)
plot(backpaint ? lower : lower + slope_pl * length, 'Lower', color = pl ? na : dnCss, offset = -offset)

//Breakouts
upBreakout = upos > upos[1]
dnBreakout = dnos > dnos[1]

if (upBreakout)
    strategy.entry("Up Breakout", strategy.long)

if (dnBreakout)
    strategy.entry("Down Breakout", strategy.short)

//------------------------------------------------------------------------------}
//Alerts
//------------------------------------------------------------------------------{
alertcondition(upos > upos[1], 'Upward Breakout', 'Price broke the down-trendline upward')
alertcondition(dnos > dnos[1], 'Downward Breakout', 'Price broke the up-trendline downward')

//------------------------------------------------------------------------------}