윌리엄스 %R - 부드럽다
저자:차오장, 2022-05-09 12:04:48 날짜태그:WMAEMA
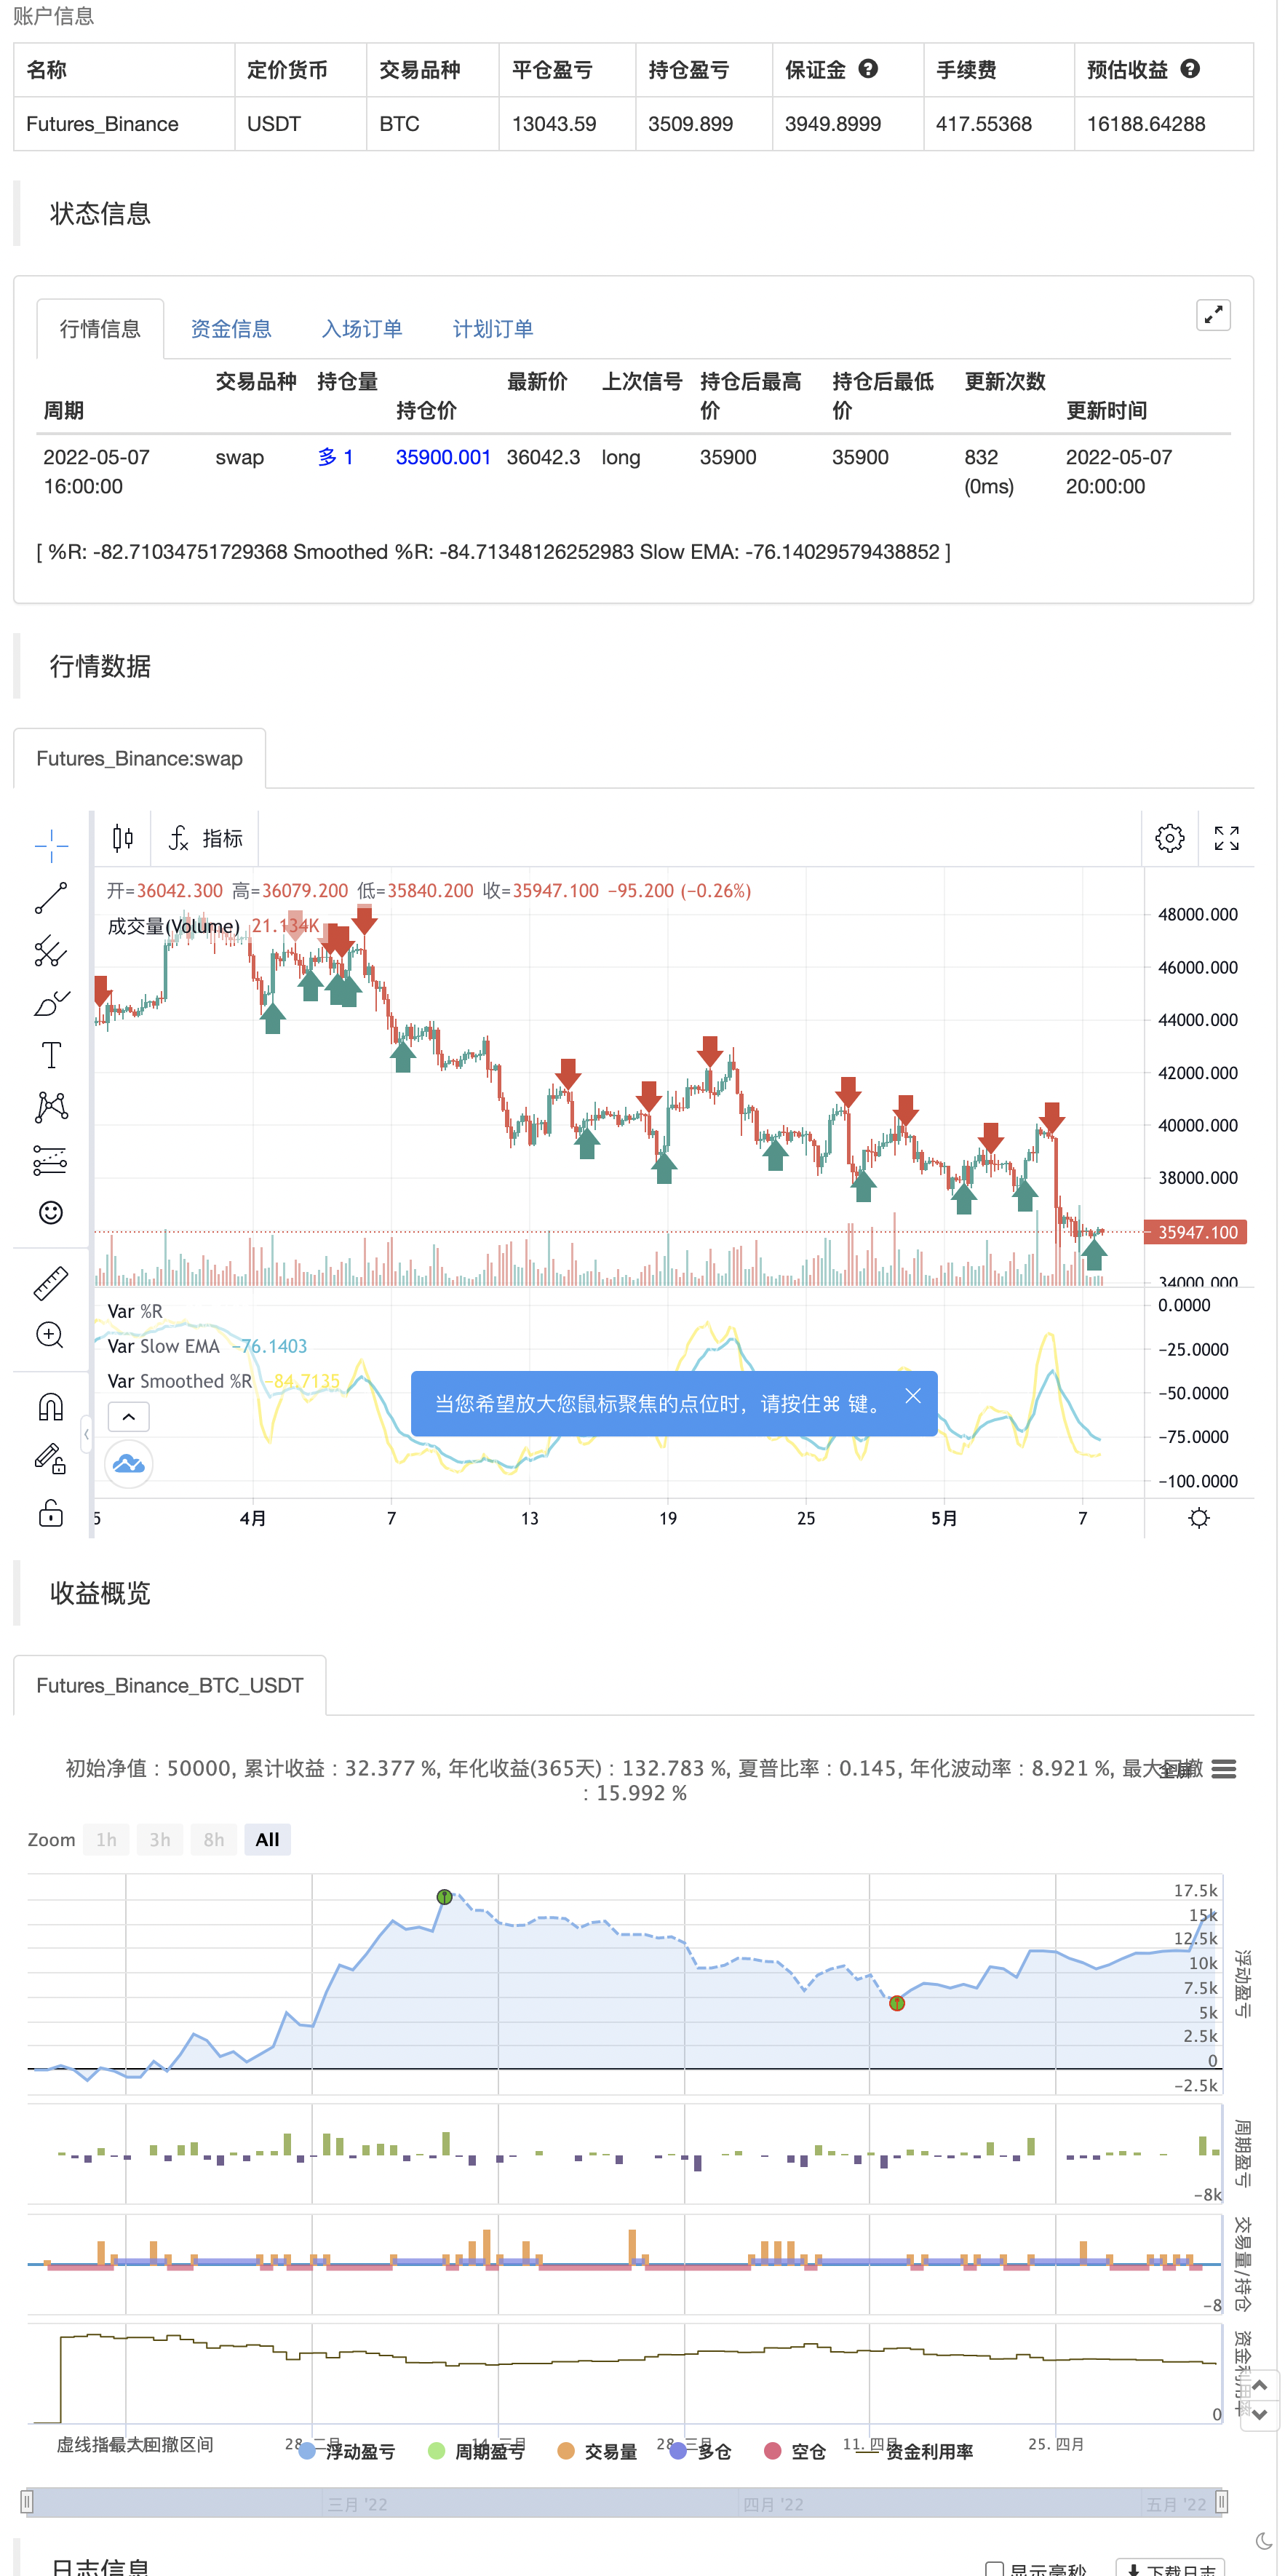
트레이딩뷰의 설명에서: 윌리엄스 %R (%R) 는 기술 분석에서 주로 과잉 구매 및 과잉 판매 조건을 식별하는 데 사용되는 모멘텀 기반 오시일레이터이다. %R은 사용자가 정의한 워크백 기간의 현재 클로즈와 최고 최고치 사이의 비교를 기반으로합니다. %R은 0에서 -100 (부적 값에 유의하십시오) 사이로 오시일레이션하며, 더 많은 과잉 구매 조건을 나타내는 0에 가까운 판독과 과잉 판매를 나타내는 -100에 가까운 판독으로 나타납니다. 일반적으로 %R은 과잉 구매 및 과잉 판매 조건뿐만 아니라 전반적인 모멘텀 변화를 기반으로 설정을 생성 할 수 있습니다.
뭐가 특별해? 이 지표는 원래의 윌리엄스 %R 지표에 두 개의 추가 EMA 라인을 추가합니다. 기본 EMA 길이는 5 및 13입니다. 결과는 더 부드러운 평균 라인 2 개이며 읽기 쉽습니다. 이 지표는 다음을 포함합니다.
- EMA 크로스 신호. EMA 크로스는 확인 된 트렌드 변화를 표시하는 데 도움이 될 수 있습니다. 기본 색상은 녹색과 빨간색입니다.
- 더 빠른 EMA 라인에서의 트렌드 반전 신호입니다. 기본 색상은 파란색과 주황색입니다.
올림/하림 크로스오버 및 역행에 대한 경고가 가능합니다.
즐기세요~~!
백테스트
/*backtest
start: 2022-02-08 00:00:00
end: 2022-05-08 00:00:00
period: 4h
basePeriod: 15m
exchanges: [{"eid":"Futures_Binance","currency":"BTC_USDT"}]
*/

// This source code is subject to the terms of the Mozilla Public License 2.0 at https://mozilla.org/MPL/2.0/
// © platsn

//@version=5
indicator(title='Williams %R - Smoothed', shorttitle='The Smooth Willy')

// Williams %R
length = input.int(defval=34, minval=1)
upper = ta.highest(length)
lower = ta.lowest(length)

output = 100 * (close - upper) / (upper - lower)

fast_period = input(defval=5, title='Smoothed %R Length')
slow_period = input(defval=13, title='Slow EMA Length')

fast_ema = ta.wma(output,fast_period)
slow_ema = ta.ema(output,slow_period)

// Plot
//h1 = hline(-20, title='Upper Band')
//h2 = hline(-80, title='Lower Band')
//fill(h1, h2, title='Background', transp=90)

plot(output, title='%R', color=color.new(color.white, 80), linewidth=1)
plot(fast_ema, title='Smoothed %R', color=color.new(color.yellow, 0), linewidth=2)
plot(slow_ema, title='Slow EMA', color=color.new(color.aqua, 0), linewidth=2)

bullX = ta.crossover(fast_ema, slow_ema)
bearX = ta.crossunder(fast_ema, slow_ema)
bullreverse = fast_ema[2] > fast_ema[1] and fast_ema > fast_ema[1] and fast_ema < -30
bearreverse = fast_ema[2] < fast_ema[1] and fast_ema < fast_ema[1] and fast_ema > -70

plotX = input.bool(true, "Show EMA Crossovers")
plotRev = input.bool(true, "Show trend reversals")

//plotshape(plotX and bearX ,"Cross down", color=color.red, style=shape.triangledown, location = location.top, size =size.tiny, offset=-1)
//plotshape(plotX and bullX ,"Cross up", color=color.green, style=shape.triangleup, location = location.bottom, size =size.tiny, offset=-1)
//plotshape(plotRev and bearreverse ,"Bear reversal", color=color.orange, style=shape.triangledown, location = location.top, size =size.tiny, offset=-1)
//plotshape(plotRev and bullreverse ,"Bull reversal", color=color.blue, style=shape.triangleup, location = location.bottom, size =size.tiny, offset=-1)

//alertcondition(bearX,"Bearish Crossover", "Bearish cross on William %R")
//alertcondition(bullX,"Bullish Crossover", "Bullish cross on William %R")
//alertcondition(bearreverse,"Bearish Reversal", "Bearish Reversal on William %R")
//alertcondition(bullreverse,"Billish Reversal", "Bullish Reversal on William %R")

if plotRev and bullreverse
    strategy.entry("Enter Long", strategy.long)
else if plotRev and bearreverse
    strategy.entry("Enter Short", strategy.short)
관련
- 낮은 스캐너 전략 암호화
- 이동 평균과 볼린거 대역에 기초한 양적 거래 전략
- RedK 부피 가속 방향 에너지 비율
- HALFTREND + HEMA + SMA (거짓 신호의 전략)
- 스윙 헐/rsi/EMA 전략
- 이동 평균 크로스 알림, 다중 시간 프레임 (MTF)
- 가장 좋은 삼키기 + 탈출 전략
- 에너지 바와 함께 레드K 듀얼 바더
- 레드K 모멘텀 바
- 레인보우 오시레이터
더 많은
- 빅 스냅퍼 경고 R3.0 + Chaiking 변동성 상태 + TP RSI
데 크롤 스톱 - CCI + EMA와 RSI 크로스 전략
- EMA 대역 + leledc + Bollinger 대역 트렌드 포스팅 전략
- RSI MTF Ob+Os
- MACD 위일리 전략
- RSI - 구매 판매 신호
- 하이킨-아시 추세
- HA 시장 편견
- 이치모쿠 클라우드 매끄러운 오시레이터
- QQE MOD + SSL 하이브리드 + 와다 아타르 폭발
- Strat를 구매/판매
- EMA와 ADX와 함께 트리플 슈퍼트렌드
- 톰 데마크 연속 열 지도
- jma + dwma 다 곡물
- 매직 MACD
- 신호로 Z 점수
神 易波率策略 파인 언어 버전 - 3EMA + 볼링거 + PIVOT
- 다곡물 바게트