HA 시장 편견
저자:차오장, 날짜: 2022-05-09 14:07:28태그:EMA
안녕하세요. 여러분 모두 잘 지내셨으면 좋겠습니다. 제가 제 첫 번째 시나리오를 올린 지 오래 됐습니다. 많은 반응이 있었습니다.
그래서 저는 이 시나리오를 모두에게 공유해야 한다고 생각했습니다. 그리고 유용하게 생각할 수 있는 모든 사람들에게도 말이죠. 개인적으로, 저는 이 시나리오를 시장의 일반적인 상황을 알리기 위해 사용합니다.
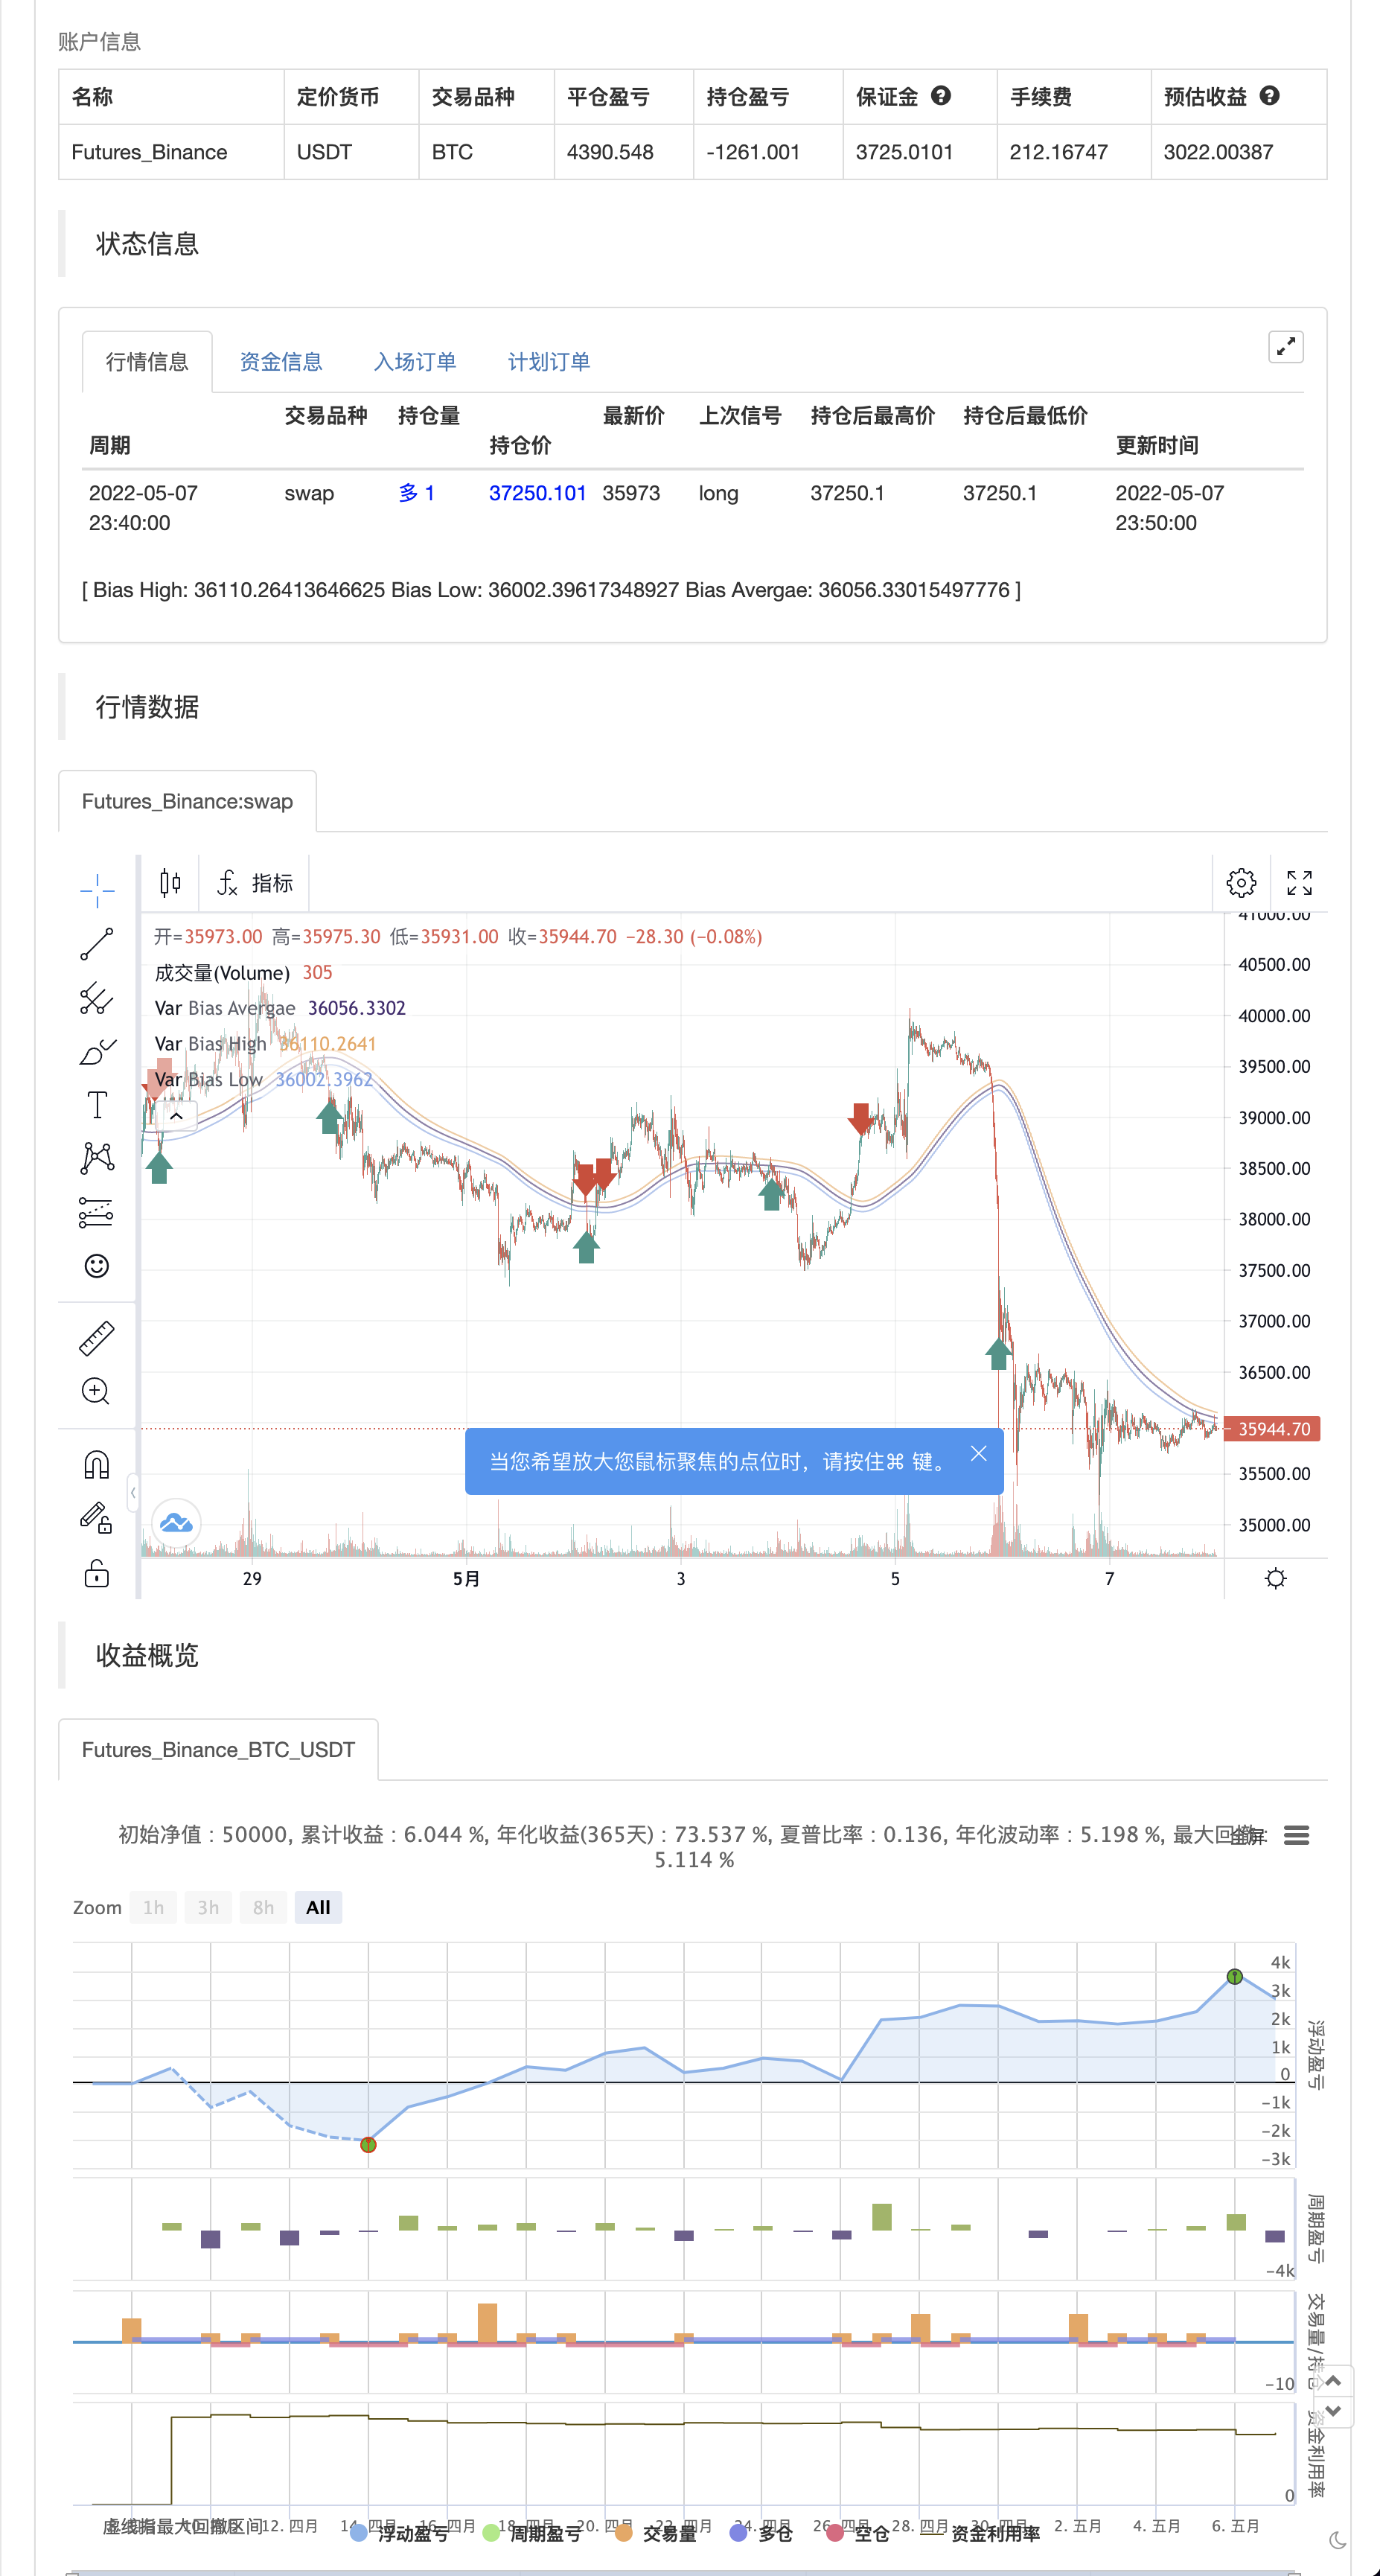
여기 내가 어떻게 작동하는지: 스크립트는 평탄한 하이켄 아시 촛불을 사용하여 시장의 전반적인 방향을 결정하려고합니다. 색상 시스템은 (밝고 어두운 색을 사용하여) 강한 시장과 약한 시장 조건을 감지하려는 시도입니다. 스크립트 내에 오시레이터도 있지만 현재로서는 그래프되지 않습니다. @jackvmk에 대한 크레딧, 나는이 지표에서 그의 오픈 스크립트 코드의 일부를 사용했습니다.
나는 지표 그래프의 기울기를 시장 조건의 필터로 사용하는 것을 고려했습니다. 그래프는
이 글이 유용하다고 생각하시길 바랍니다. 이 글의 사용법을 알아낸다면, 댓글 섹션에서 커뮤니티와 공유하시기 바랍니다.
참고: 이것은 결코 금융 자문이 아닙니다. 당신은 당신의 연구를 수행하고 당신의 거래 스타일과 전략에이 지표를 적용하는 방법을 찾아내야합니다.
그런데, 저는 지금부터 제가 발표하는 모든 후속 시나리오에 대해
백테스트
/*backtest
start: 2022-04-08 00:00:00
end: 2022-05-07 23:59:00
period: 10m
basePeriod: 1m
exchanges: [{"eid":"Futures_Binance","currency":"BTC_USDT"}]
*/

// This source code is subject to the terms of the Mozilla Public License 2.0 at https://mozilla.org/MPL/2.0/
// © Professeur_X

//@version=5

indicator(title='HA Market Bias', shorttitle='HA Market Bias', overlay=true)

tf(_res, _exp, gaps_on) =>
    gaps_on == 0 ? request.security(syminfo.tickerid, _res, _exp) : gaps_on == true ? request.security(syminfo.tickerid, _res, _exp, barmerge.gaps_on, barmerge.lookahead_off) : request.security(syminfo.tickerid, _res, _exp, barmerge.gaps_off, barmerge.lookahead_off)

ha_htf = ''
show_ha = input.bool(true, "Show HA Plot/ Market Bias", group="HA Market Bias")
ha_len = input(100, 'Period', group="HA Market Bias")
ha_len2 = input(100, 'Smoothing', group="HA Market Bias")

// Calculations {
o = ta.ema(open, ha_len)
c = ta.ema(close, ha_len)
h = ta.ema(high, ha_len)
l = ta.ema(low, ha_len)

haclose = tf(ha_htf, (o + h + l + c) / 4, 0)
xhaopen = tf(ha_htf, (o + c) / 2, 0)
haopen = na(xhaopen[1]) ? (o + c) / 2 : (xhaopen[1] + haclose[1]) / 2
hahigh = math.max(h, math.max(haopen, haclose))
halow = math.min(l, math.min(haopen, haclose))


o2 = tf(ha_htf, ta.ema(haopen, ha_len2), 0)
c2 = tf(ha_htf, ta.ema(haclose, ha_len2), 0)
h2 = tf(ha_htf, ta.ema(hahigh, ha_len2), 0)
l2 = tf(ha_htf, ta.ema(halow, ha_len2), 0)

ha_avg = (h2 + l2) / 2
// }

// Oscillator {
osc_len = input.int(7, "Oscillator Period", group="HA Market Bias")

osc_bias = 100 *(c2 - o2)
osc_smooth = ta.ema(osc_bias, osc_len)

sigcolor =
  (osc_bias > 0) and (osc_bias >= osc_smooth) ? color.new(color.lime, 35) :
  (osc_bias > 0) and (osc_bias < osc_smooth) ? color.new(color.lime, 75) :
  (osc_bias < 0) and (osc_bias <= osc_smooth) ? color.new(color.red, 35) :
  (osc_bias < 0) and (osc_bias > osc_smooth) ? color.new(color.red, 75) :
  na
// }

// Plots {
p_h = plot(h2, "Bias High", display=display.none, editable=false)
p_l = plot(l2, "Bias Low", display=display.none, editable=false)
p_avg = plot(ha_avg, "Bias Avergae", display=display.none, editable=false)


col = o2 > c2 ? color.red : color.lime

if o2 > c2
    strategy.entry("Enter Long", strategy.long)
else if o2 < c2
    strategy.entry("Enter Short", strategy.short)
관련
- EMA의 긴 입장은 위험 관리 전략과 교차합니다
- VWAP 거래 전략
- 웨이브 트렌드 크로스 레이지 베어 전략
- AlphaTradingBot 거래 전략
- RSI와 듀얼 EMA 크로스오버 신호 양적 전략
- 엘리엇 파동 이론 4-9 충동 파동 자동 탐지 거래 전략
- KRK aDa AI 향상과 함께 스토카스틱 느린 평균 반전 전략
- EMA23/EMA50 이중 이동 평균 크로스오버 양적 거래 전략
- MACD 골든 크로스와 데스 크로스 전략
- MACD-V 및 피보나치 다중 시간 프레임 동적 영업 전략
- 이동 평균과 볼린거 대역에 기초한 양적 거래 전략
더 많은
- TV의 높고 낮은 전략
- 가장 좋은 트레이딩 뷰 전략
- 빅 스냅퍼 경고 R3.0 + Chaiking 변동성 상태 + TP RSI
데 크롤 스톱 - CCI + EMA와 RSI 크로스 전략
- EMA 대역 + leledc + Bollinger 대역 트렌드 포스팅 전략
- RSI MTF Ob+Os
- MACD 위일리 전략
- RSI - 구매 판매 신호
- 하이킨-아시 추세
- 이치모쿠 클라우드 매끄러운 오시레이터
- 윌리엄스 %R - 부드럽다
- QQE MOD + SSL 하이브리드 + 와다 아타르 폭발
- Strat를 구매/판매
- EMA와 ADX와 함께 트리플 슈퍼트렌드
- 톰 데마크 연속 열 지도
- jma + dwma 다 곡물
- 매직 MACD
- 신호로 Z 점수
神 易波率策略 파인 언어 버전