수퍼트렌드 ATR TRAILING STOP LOSS
저자:차오장, 날짜: 2022-05-23 14:54:31태그:ATR
슈퍼트렌드는 변동성 (ATR) 에 기반한 이동 스톱 및 역전 라인입니다.
이 전략은 가격 움직임이 1%일 때 당신의 스톱 로스를 올릴 것입니다.
이 전략은 시장 가격이 스톱 로스를 넘었을 때 거래를 종료합니다.
이 전략은 변동성에 기반한 선을 넘을 때 거래를 종료합니다.
이 전략은 다음과 같은 매개 변수를 가지고 있습니다.
- ATR 기간- 계산을 실행하기 위해 다시 바를 선택
- ATR MULTPLIER- 변동성에 더 많은 요소를 추가하기 위해
- 초기 STOP 손실- 먼저 멈출 수 있는 값이 어디죠?
- 포지션 타입- 거래 위치를 선택할 수 있습니다.
- 역시험 기간- 범위를 선택해
면책
- 나는 라이선스 금융 자문가 또는 중개 딜러가 아닙니다. 나는 언제 또는 무엇을 구입하거나 판매하는 것을 말하지 않습니다. 나는 당신이 트레이딩뷰를 사용하여 수동 또는 자동화 트레이드를 수행 할 수있는이 소프트웨어를 개발했습니다. 소프트웨어는 당신이 트레이드를 입력하고 종료하는 데 원하는 기준을 설정 할 수 있습니다.
- 잃을 수 없는 돈으로 거래를 하지 말라.
- 저는 일정한 수익을 보장하지 않습니다. 그리고 저는 성배를 팔지 않습니다.
- 모든 시스템에는 승패가 있습니다.
- 자금 관리는 거래의 결과에 큰 역할을 합니다. 예를 들어: 롯 크기, 계정 크기, 중개자 레버리지, 중개자 마진 콜 규칙 모두 결과에 영향을 미칩니다. 또한, 개별 쌍 거래 및 전체 계정 주식을위한 수익 및 손실 중지 설정은 결과에 큰 영향을 미칩니다. 거래에 처음 접하고 이러한 항목을 이해하지 못한다면 지식을 더 발전시키기 위해 교육 자료를 찾는 것이 좋습니다.
당신은 당신을 위해 가장 잘 작동하는 거래 시스템을 찾고 사용해야합니다.
저는 트레이딩뷰에서 이 프로그램으로 거래할 수 있는 옵션이 있는 도구밖에 제공하지 않았습니다.
참고:
백테스트
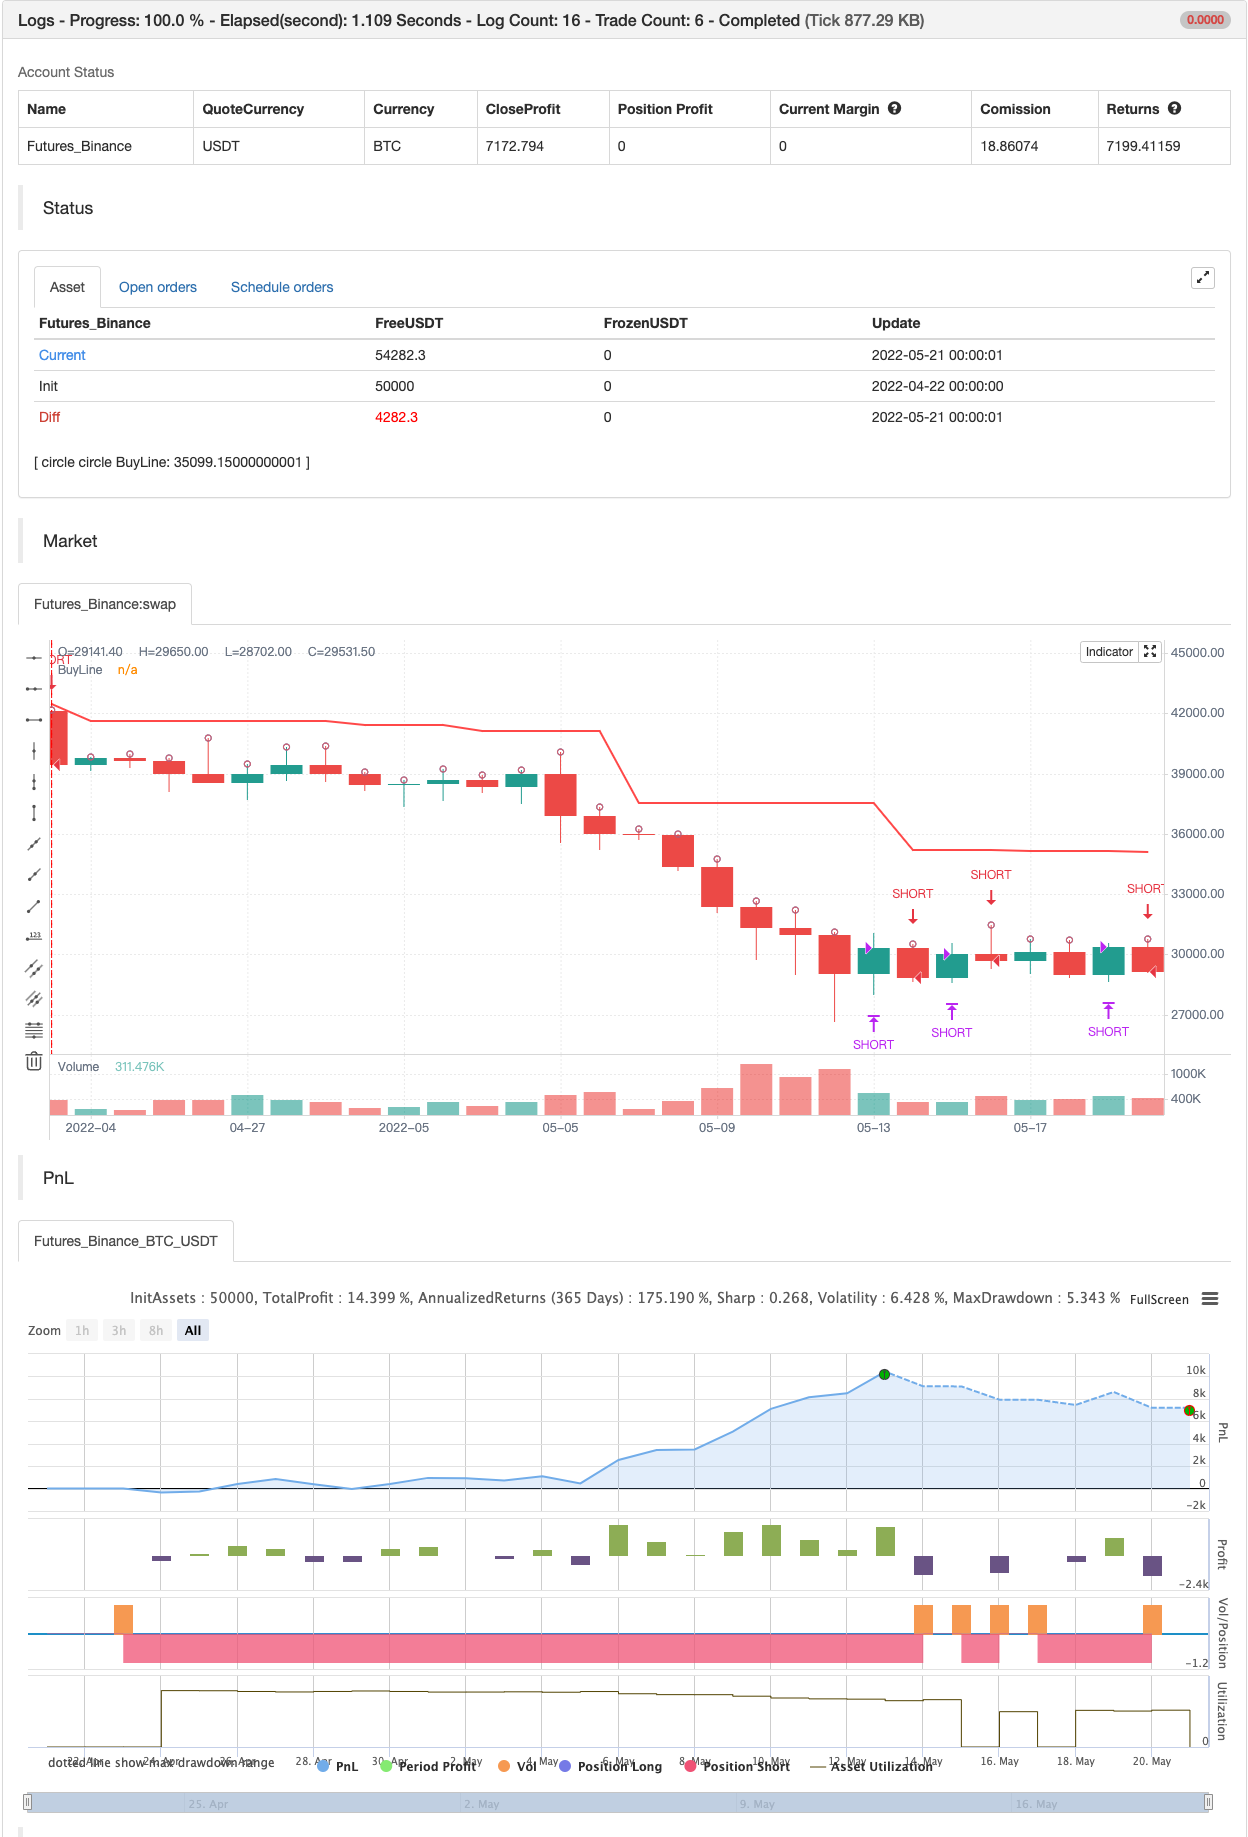
/*backtest
start: 2022-02-22 00:00:00
end: 2022-05-22 00:00:00
period: 1d
basePeriod: 1h
exchanges: [{"eid":"Futures_Binance","currency":"BTC_USDT"}]
*/

//@version=4
//
// ▒▒▒▒▒▒▒▒▒▒▒▒▒▒▒▒▒▒▒▒▒▒▒▒▒▒▒▒▒▒▒▒▒▒▒▒▒▒▒▒▒▒▒▒▒▒▒▒▒▒▒▒▒▒▒▒▒▒▒▒▒▒▒▒▒▒▒▒▒▒▒▒▒▒▒▒▒▒▒▒▒▒▒▒▒▒▒▒▒▒▒▒▒▒▒▒▒▒▒▒▒▒▒▒▒▒▒▒▒▒▒▒▒▒
//  -----------------------------------------------------------------------------
//  Copyright 2019 Mauricio Pimenta | exit490
//  SuperTrend with Trailing Stop Loss script may be freely distributed under the MIT license.
//
//  Permission is hereby granted, free of charge,
//  to any person obtaining a copy of this software and associated documentation files (the "Software"),
//  to deal in the Software without restriction, including without limitation the rights to use, copy, modify, merge,
//  publish, distribute, sublicense, and/or sell copies of the Software, and to permit persons to whom the Software is furnished to do so,
//  subject to the following conditions:
//
//  The above copyright notice and this permission notice shall be included in all copies or substantial portions of the Software.
//
//  THE SOFTWARE IS PROVIDED "AS IS", WITHOUT WARRANTY OF ANY KIND,
//  EXPRESS OR IMPLIED, INCLUDING BUT NOT LIMITED TO THE WARRANTIES OF MERCHANTABILITY,
//  FITNESS FOR A PARTICULAR PURPOSE AND NONINFRINGEMENT. IN NO EVENT SHALL THE AUTHORS OR COPYRIGHT HOLDERS BE LIABLE FOR ANY CLAIM,
//  DAMAGES OR OTHER LIABILITY, WHETHER IN AN ACTION OF CONTRACT, TORT OR OTHERWISE, ARISING FROM,
//  OUT OF OR IN CONNECTION WITH THE SOFTWARE OR THE USE OR OTHER DEALINGS IN THE SOFTWARE.
//
//  -----------------------------------------------------------------------------
//
//  Authors:  @exit490
//  Revision: v1.0.0
//  Date:     5-Aug-2019
//
//  Description
//  ===========
//  SuperTrend is a moving stop and reversal line based on the volatility (ATR).
//  The strategy will ride up your stop loss when price moviment 1%.
//  The strategy will close your operation when the market price crossed the stop loss.
//  The strategy will close operation when the line based on the volatility will crossed
//
//  The strategy has the following parameters:
//
//  INITIAL STOP LOSS - Where can isert the value to first stop.
//  POSITION TYPE - Where can to select trade position.
//  ATR PERIOD - To select number of bars back to execute calculation
//  ATR MULTPLIER - To add a multplier factor on volatility
//  BACKTEST PERIOD - To select range.
//
//  -----------------------------------------------------------------------------
//  Disclaimer:
//    1. I am not licensed financial advisors or broker dealers. I do not tell you
//       when or what to buy or sell. I developed this software which enables you
//       execute manual or automated trades multplierFactoriplierFactoriple trades using TradingView. The
//       software allows you to set the criteria you want for entering and exiting
//       trades.
//    2. Do not trade with money you cannot afford to lose.
//    3. I do not guarantee consistent profits or that anyone can make money with no
//       effort. And I am not selling the holy grail.
//    4. Every system can have winning and losing streaks.
//    5. Money management plays a large role in the results of your trading. For
//       example: lot size, account size, broker leverage, and broker margin call
//       rules all have an effect on results. Also, your Take Profit and Stop Loss
//       settings for individual pair trades and for overall account equity have a
//       major impact on results. If you are new to trading and do not understand
//       these items, then I recommend you seek education materials to further your
//       knowledge.
//
//    YOU NEED TO FIND AND USE THE TRADING SYSTEM THAT WORKS BEST FOR YOU AND YOUR
//    TRADING TOLERANCE.
//
//    I HAVE PROVIDED NOTHING MORE THAN A TOOL WITH OPTIONS FOR YOU TO TRADE WITH THIS PROGRAM ON TRADINGVIEW.
//
//    I accept suggestions to improve the script.
//    If you encounter any problems I will be happy to share with me.
//  -----------------------------------------------------------------------------
//
// ▒▒▒▒▒▒▒▒▒▒▒▒▒▒▒▒▒▒▒▒▒▒▒▒▒▒▒▒▒▒▒▒▒▒▒▒▒▒▒▒▒▒▒▒▒▒▒▒▒▒▒▒▒▒▒▒▒▒▒▒▒▒▒▒▒▒▒▒▒▒▒▒▒▒▒▒▒▒▒▒▒▒▒▒▒▒▒▒▒▒▒▒▒▒▒▒▒▒▒▒▒▒▒▒▒▒▒▒▒▒▒▒▒▒ //

strategy(title = "SUPERTREND ATR WITH TRAILING STOP LOSS",
         shorttitle = "SUPERTREND ATR WITH TSL",
         overlay = true,
         precision = 8,
         calc_on_order_fills = true,
         calc_on_every_tick = true,
         backtest_fill_limits_assumption = 0,
         default_qty_type = strategy.percent_of_equity,
         default_qty_value = 100,
         initial_capital = 1000,
         currency = currency.USD,
         linktoseries = true)

//
// ▒▒▒▒▒▒▒▒▒▒▒▒▒▒▒▒▒▒▒▒▒▒▒▒▒▒▒▒▒▒▒▒▒▒▒▒▒▒▒▒▒▒▒▒▒▒▒▒▒▒▒▒▒▒▒▒▒▒▒▒▒▒▒▒▒▒▒▒▒▒▒▒▒▒▒▒▒▒▒▒▒▒▒▒▒▒▒▒▒▒▒▒▒▒▒▒▒▒▒▒▒▒▒▒▒▒▒▒▒▒▒▒▒▒ //

// === BACKTEST RANGE ===
backTestSectionFrom = input(title = "═══════════════ FROM ═══════════════", defval = true, type = input.bool)

FromMonth       = input(defval = 1, title = "Month", minval = 1)
FromDay         = input(defval = 1, title = "Day", minval = 1)
FromYear        = input(defval = 2019, title = "Year", minval = 2014)

backTestSectionTo = input(title = "════════════════ TO ════════════════", defval = true, type = input.bool)
ToMonth         = input(defval = 31, title = "Month", minval = 1)
ToDay           = input(defval = 12, title = "Day", minval = 1)
ToYear          = input(defval = 9999, title = "Year", minval = 2014)

backTestPeriod() => (time > timestamp(FromYear, FromMonth, FromDay, 00, 00)) and (time < timestamp(ToYear, ToMonth, ToDay, 23, 59))

//
// ▒▒▒▒▒▒▒▒▒▒▒▒▒▒▒▒▒▒▒▒▒▒▒▒▒▒▒▒▒▒▒▒▒▒▒▒▒▒▒▒▒▒▒▒▒▒▒▒▒▒▒▒▒▒▒▒▒▒▒▒▒▒▒▒▒▒▒▒▒▒▒▒▒▒▒▒▒▒▒▒▒▒▒▒▒▒▒▒▒▒▒▒▒▒▒▒▒▒▒▒▒▒▒▒▒▒▒▒▒▒▒▒▒▒ //

parameterSection = input(title = "═════════════ STRATEGY ═════════════", defval = true, type = input.bool)
// === INPUT TO SELECT POSITION ===
positionType = input(defval="SHORT", title="Position Type", options=["LONG", "SHORT"])

// === INPUT TO SELECT INITIAL STOP LOSS
initialStopLossPercent = input(defval = 3.0, minval = 0.0, title="Initial Stop Loss")

// === INPUT TO SELECT BARS BACK
barsBack = input(title="ATR Period", defval=1)

// === INPUT TO SELECT MULTPLIER FACTOR
multplierFactor = input(title="ATR multplierFactoriplier", step=0.1, defval=3.0)

//
// ▒▒▒▒▒▒▒▒▒▒▒▒▒▒▒▒▒▒▒▒▒▒▒▒▒▒▒▒▒▒▒▒▒▒▒▒▒▒▒▒▒▒▒▒▒▒▒▒▒▒▒▒▒▒▒▒▒▒▒▒▒▒▒▒▒▒▒▒▒▒▒▒▒▒▒▒▒▒▒▒▒▒▒▒▒▒▒▒▒▒▒▒▒▒▒▒▒▒▒▒▒▒▒▒▒▒▒▒▒▒▒▒▒▒ //

// LOGIC TO FIND DIRECTION WHEN THERE IS TREND CHANGE ACCORDING VOLATILITY
atr = multplierFactor * atr(barsBack)

longStop = hl2 - atr
longStopPrev = nz(longStop[1], longStop)
longStop := close[1] > longStopPrev ? max(longStop, longStopPrev) : longStop

shortStop = hl2 + atr
shortStopPrev = nz(shortStop[1], shortStop)
shortStop := close[1] < shortStopPrev ? min(shortStop, shortStopPrev) : shortStop

direction = 1
direction := nz(direction[1], direction)
direction := direction == -1 and close > shortStopPrev ? 1 : direction == 1 and close < longStopPrev ? -1 : direction

longColor = color.blue
shortColor = color.blue

var valueToPlot = 0.0
var colorToPlot = color.white

if (direction == 1)
    valueToPlot := longStop
    colorToPlot := color.green
else
    valueToPlot := shortStop
    colorToPlot := color.red

//
// ▒▒▒▒▒▒▒▒▒▒▒▒▒▒▒▒▒▒▒▒▒▒▒▒▒▒▒▒▒▒▒▒▒▒▒▒▒▒▒▒▒▒▒▒▒▒▒▒▒▒▒▒▒▒▒▒▒▒▒▒▒▒▒▒▒▒▒▒▒▒▒▒▒▒▒▒▒▒▒▒▒▒▒▒▒▒▒▒▒▒▒▒▒▒▒▒▒▒▒▒▒▒▒▒▒▒▒▒▒▒▒▒▒▒ //
//
// === GLOBAL VARIABLES AND FUNCTIONS TO STORE IMPORTANT CONDITIONALS TO TRAILING STOP
hasEntryLongConditional() => direction == 1
hasCloseLongConditional() => direction == -1

hasEntryShortConditional() => direction == -1
hasCloseShortConditional() => direction == 1

stopLossPercent = positionType == "LONG" ? initialStopLossPercent * -1 : initialStopLossPercent

var entryPrice = 0.0
var updatedEntryPrice = 0.0
var stopLossPrice = 0.0

hasOpenTrade() => strategy.opentrades != 0
notHasOpenTrade() => strategy.opentrades == 0

strategyClose() =>
    if positionType == "LONG"
        strategy.close("LONG", when=true)
    else
        strategy.close("SHORT", when=true)

strategyOpen() =>
    if positionType == "LONG"
        strategy.entry("LONG", strategy.long, when=true)
    else
        strategy.entry("SHORT", strategy.short, when=true)

isLong() => positionType == "LONG" ? true : false
isShort() => positionType == "SHORT" ? true : false


//
// ▒▒▒▒▒▒▒▒▒▒▒▒▒▒▒▒▒▒▒▒▒▒▒▒▒▒▒▒▒▒▒▒▒▒▒▒▒▒▒▒▒▒▒▒▒▒▒▒▒▒▒▒▒▒▒▒▒▒▒▒▒▒▒▒▒▒▒▒▒▒▒▒▒▒▒▒▒▒▒▒▒▒▒▒▒▒▒▒▒▒▒▒▒▒▒▒▒▒▒▒▒▒▒▒▒▒▒▒▒▒▒▒▒▒ //
//
// === LOGIC TO TRAILING STOP IN LONG POSITION

if (isLong())

    crossedStopLoss = close <= stopLossPrice
    terminateOperation = hasOpenTrade() and (crossedStopLoss or hasCloseLongConditional())

    if (terminateOperation)
        entryPrice := 0.0
        updatedEntryPrice := entryPrice
        stopLossPrice := 0.0
        strategyClose()

    startOperation = notHasOpenTrade() and hasEntryLongConditional()

    if(startOperation)
        entryPrice := close
        updatedEntryPrice := entryPrice
        stopLossPrice := entryPrice + (entryPrice * stopLossPercent) / 100
        strategyOpen()

    strategyPercentege = (close - updatedEntryPrice) / updatedEntryPrice * 100.00
    rideUpStopLoss = hasOpenTrade() and strategyPercentege > 1

    if (isLong() and rideUpStopLoss)
        stopLossPercent := stopLossPercent + strategyPercentege - 1.0
        newStopLossPrice = updatedEntryPrice + (updatedEntryPrice * stopLossPercent) / 100
        stopLossPrice := max(stopLossPrice, newStopLossPrice)
        updatedEntryPrice := stopLossPrice

//
// ▒▒▒▒▒▒▒▒▒▒▒▒▒▒▒▒▒▒▒▒▒▒▒▒▒▒▒▒▒▒▒▒▒▒▒▒▒▒▒▒▒▒▒▒▒▒▒▒▒▒▒▒▒▒▒▒▒▒▒▒▒▒▒▒▒▒▒▒▒▒▒▒▒▒▒▒▒▒▒▒▒▒▒▒▒▒▒▒▒▒▒▒▒▒▒▒▒▒▒▒▒▒▒▒▒▒▒▒▒▒▒▒▒▒ //
//
// === LOGIC TO TRAILING STOP IN SHORT POSITION

if (isShort())

    crossedStopLoss = close >= stopLossPrice
    terminateOperation = hasOpenTrade() and (crossedStopLoss or hasCloseShortConditional())

    if (terminateOperation)
        entryPrice := 0.0
        updatedEntryPrice := entryPrice
        stopLossPrice := 0.0
        strategyClose()

    startOperation = notHasOpenTrade() and hasEntryShortConditional()

    if(startOperation)
        entryPrice := close
        updatedEntryPrice := entryPrice
        stopLossPrice := entryPrice + (entryPrice * stopLossPercent) / 100
        strategyOpen()

    strategyPercentege = (close - updatedEntryPrice) / updatedEntryPrice * 100.00
    rideDownStopLoss = hasOpenTrade() and strategyPercentege < -1

    if (rideDownStopLoss)
        stopLossPercent := stopLossPercent + strategyPercentege + 1.0
        newStopLossPrice = updatedEntryPrice + (updatedEntryPrice * stopLossPercent) / 100
        stopLossPrice := min(stopLossPrice, newStopLossPrice)
        updatedEntryPrice := stopLossPrice

//
// ▒▒▒▒▒▒▒▒▒▒▒▒▒▒▒▒▒▒▒▒▒▒▒▒▒▒▒▒▒▒▒▒▒▒▒▒▒▒▒▒▒▒▒▒▒▒▒▒▒▒▒▒▒▒▒▒▒▒▒▒▒▒▒▒▒▒▒▒▒▒▒▒▒▒▒▒▒▒▒▒▒▒▒▒▒▒▒▒▒▒▒▒▒▒▒▒▒▒▒▒▒▒▒▒▒▒▒▒▒▒▒▒▒▒
//
// === DRAWING SHAPES

entryPricePlotConditinal = entryPrice == 0.0 ? na : entryPrice
trailingStopLossPlotConditional = stopLossPrice == 0.0  ? na : stopLossPrice

plotshape(entryPricePlotConditinal, title= "Entry Price", color=color.blue, style=shape.circle, location=location.absolute, size=size.tiny)
plotshape(trailingStopLossPlotConditional, title= "Stop Loss", color=color.red, style=shape.circle, location=location.absolute, size=size.tiny)

plot(valueToPlot == 0.0 ? na : valueToPlot, title="BuyLine", linewidth=2, color=colorToPlot)
plotshape(direction == 1 and direction[1] == -1 ? longStop : na, title="Buy", style=shape.labelup, location=location.absolute, size=size.normal, text="Buy", transp=0, textcolor = color.white, color=color.green, transp=0)
plotshape(direction == -1 and direction[1] == 1 ? shortStop : na, title="Sell", style=shape.labeldown, location=location.absolute, size=size.normal, text="Sell", transp=0, textcolor = color.white, color=color.red, transp=0)

alertcondition(direction == 1 and direction[1] == -1 ? longStop : na, title="Buy", message="Buy!")
alertcondition(direction == -1 and direction[1] == 1 ? shortStop : na, title="Sell", message="Sell!")
관련
- 트리플 EMA 크로스오버 전략
- 토요일 전환 전략 (주말 필터)
- RSI/MACD/ATR과 함께 강화된 EMA 크로스오버 전략
- 전략에 따른 다중 지표 트렌드
- 피보나치 트렌드 역전 전략
- AlphaTradingBot 거래 전략
- 베가스 슈퍼 트렌드 강화 전략
- RSI 트렌드 역전 전략
- 엘리엇 파동 이론 4-9 충동 파동 자동 탐지 거래 전략
- 일내 변동성 거래 전략
- 피보트 포인트 및 기울기 기반의 실시간 트렌드 라인 거래
더 많은
- 선형 회귀 ++
- 에너지 바와 함께 레드K 듀얼 바더
- 통합 구역 - 라이브
- 양적 질적 평가
- 이동 평균 크로스 알림, 다중 시간 프레임 (MTF)
- MACD 재충전 전략
- 슈퍼트렌드 이동 평균
- 거래 ABC
- 15MIN BTCUSDTPERP BOT
논 엔트로피 V2 - 부피 흐름 v3
- ma & rsi - ogcheckers와 함께 암호화 선물 시간 스칼핑
- ATR 평평화
- 주문 블록 검색어
- 트렌드 스칼프-프랙탈박스-3EMA
- QQE 신호
- U비트 격자 팽창 필터링
- CM MACD 사용자 지정 지표 - 여러 시간 프레임 - V2
- HODL 라인
- 2 이동 평균 색 방향 탐지