개요
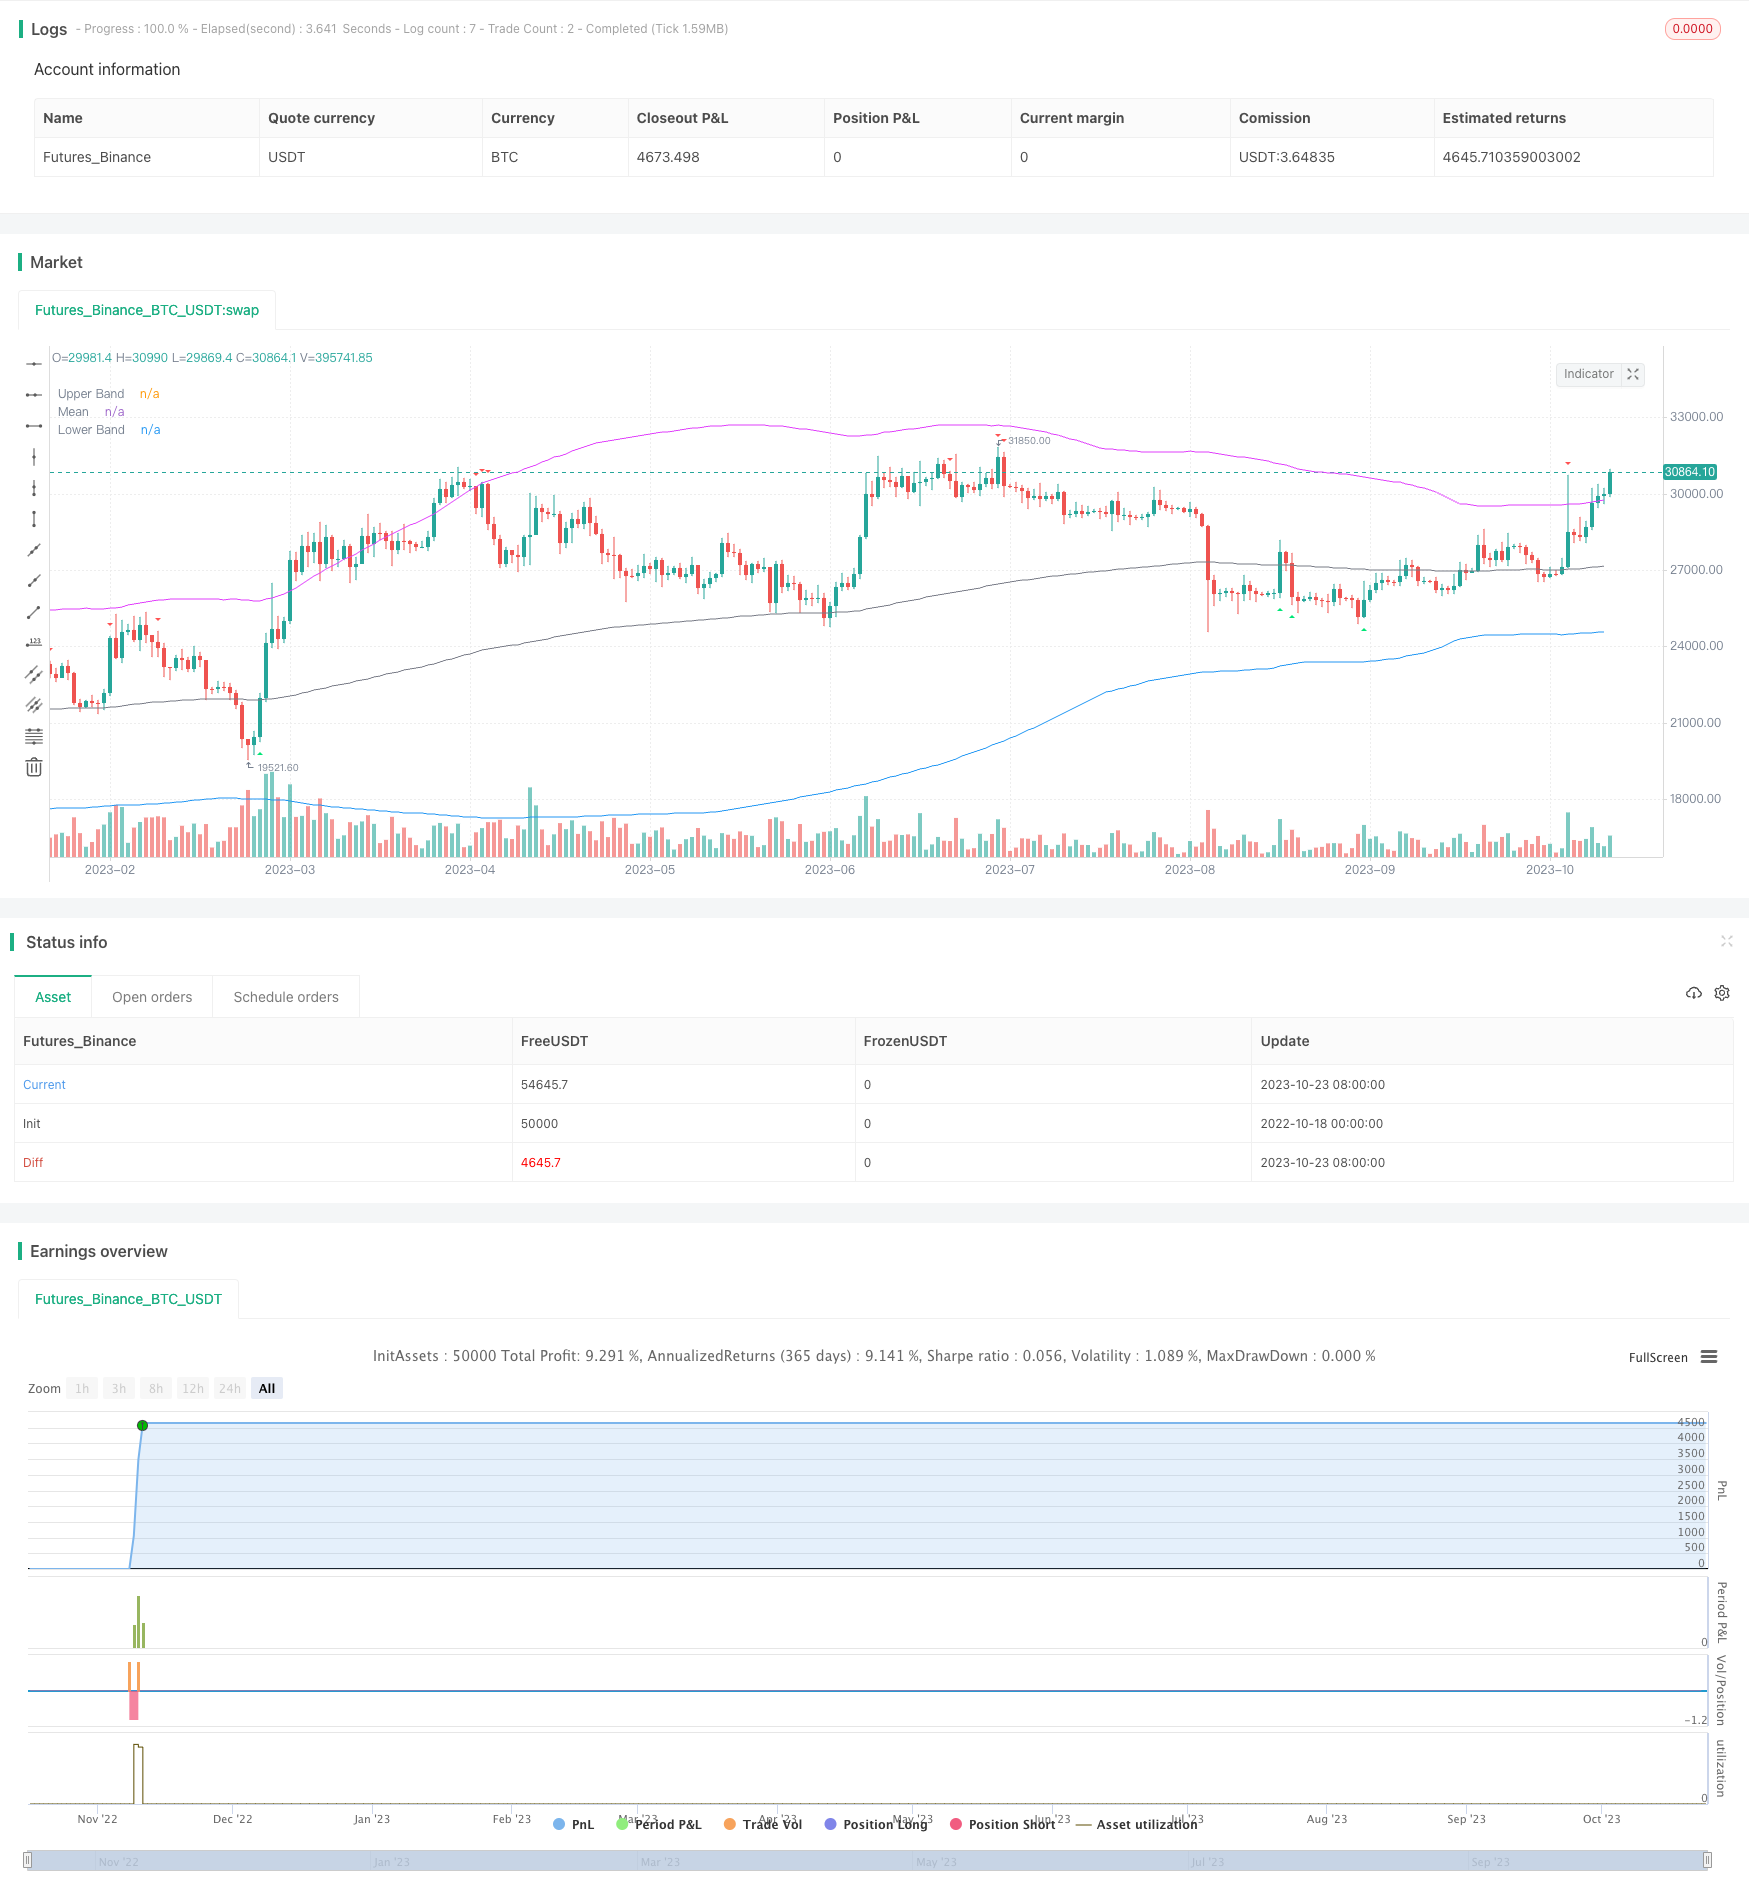
이 전략은 CCI 지표와 동력 지표가 RSI 지표와 결합되어 시장의 추세를 식별하고, 오버 바이 오버 셀드 영역이 폭파 현상을 발견했을 때 진입하며, 브린을 사용하여 추세를 식별하고 중앙으로 돌아갑니다. 이 전략은 돌파구를 효과적으로 식별하고, 추세가 시작되는 단계에서 진입하고, 파라미터를 통해 자유롭게 조정할 수 있습니다.
전략 원칙
우선, 전략은 CCI 지표 또는 동력 지표의 0 축 상과 0 축 아래를 통과하여 구매 및 판매 신호를 판단한다. 동시에, RSI 지표가 초상 구매 초상 판매 영역에 있는 것을 요구한다. 즉, RSI가 65보다 높으면 초상 구매 영역, 35보다 낮으면 초상 판매 영역이다. 이렇게하면 초상 구매 초상 판매 영역이 아닌 잘못된 신호를 발산하는 것을 피할 수 있다.
또한, 전략은 RSI의 bullish divergence (조그만 상승) 과 bearish divergence (조그만 하락) 을 판단할 수 있습니다.
CCI 또는 동력의 구매 신호에 부합하고 RSI가 초매권에 있을 때, 전략은 이전 고점과 낮은점이 모두 부린 반도 중앙 위에 있는지 여부를 판단하고, 만약 그렇다면 구매 신호를 발생시킨다. 반대로, 판매 신호에 부합하고 이전 고점과 낮은점이 모두 부린 반도 중앙 아래에 있을 때 판매 신호를 발생시킨다.
이렇게 함으로써, 전략은 동시적으로 트렌드 지수와 쇼크 지수를 활용하여 트렌드가 시작될 때 적시에 포착할 수 있고, 중앙 판단을 사용하여 가짜 브레이크를 피할 수 있다. 가격이 브린 반에서 벗어난 후 하향으로 갈 때, 전략은 수익을 고정하고 회수 확장을 방지하기 위해 완전히 평평해진다.
우위 분석
트렌드 지수와 변동 지수를 결합하여 트렌드 초기에 진입할 수 있으며, 변동 시장에서 불필요한 입장을 피합니다.
브린 벨트에서 축 결합 공을 입력 신호로 사용하여 가짜 돌파를 효과적으로 필터링 할 수 있습니다.
RSI 지표의 역사적인 흐름을 살펴보면 잘못된 거래 신호를 방지할 수 있습니다.
완전히 자동화 된 거래, 인적 개입이 필요없고 알고리즘 거래에 적합합니다.
전략 파라미터는 다양한 거래 유형에 맞게 자유롭게 조정할 수 있습니다.
스톱 로즈 스톱을 설정하여 위험을 효과적으로 제어할 수 있습니다.
위험 분석
부린 벨트 파라미터를 잘못 설정하면 중앙 판단이 실패할 수 있습니다.
지표 변수가 잘못 설정되어 너무 많은 오류 신호가 발생할 수 있습니다.
파격이 실패하고, 가격이 다시 브린 중심부로 회전할 때 시간적 중단이 필요합니다.
거래 품종이 유동성이 부족할 때, 브레이크엔드는 좋지 않을 수 있습니다.
거래 전, 역사 데이터의 충분성을 확인하여 곡선의 부적응을 피하십시오.
거래시간에 주의를 기울여 가짜 돌파구를 피해야 합니다.
최적화 방향
브린 벨트 변수를 최적화하여 중앙을 안정화합니다.
다양한 품종에 대한 다양한 지표 변수의 효과를 테스트합니다.
거래량 통제를 강화하고 단일 포지션의 과잉을 방지합니다.
시간대에 대한 판단을 높이고, 주요 거래 시간에 작동
기계 학습 알고리즘을 추가하여 더 지능적인 신호를 생성합니다.
더 많은 데이터에 접근하여 시장의 전반적인 흐름을 파악할 수 있습니다.
더 많은 지표의 통합을 통해 지표 포트폴리오를 형성하는 것
요약하다
이 전략은 트렌드 지수와 흔들림 지수를 통합하여 트렌드가 시작될 때 시장에 진입할 수 있다. 동시에 브린 벨트의 중심 결합 공을 입문 신호로 사용하여 가짜 돌파구를 효과적으로 방지할 수 있다. 전략 매개 변수는 다양한 품종에 적응할 수 있도록 유연하게 조정할 수 있으며, 재검토 효과는 우수하다. 다음 단계는 최적화된 매개 변수 설정과 모델 융합을 통해 전략을 더 안정적으로 신뢰할 수 있도록 하여 장기적으로 안정적인 초과 이익을 얻을 수 있다.
/*backtest
start: 2022-10-18 00:00:00
end: 2023-10-24 00:00:00
period: 1d
basePeriod: 1h
exchanges: [{"eid":"Futures_Binance","currency":"BTC_USDT"}]
*/

//@version=5
strategy(title='BroTheJo Strategy', shorttitle='BTJ', overlay=true)

// Input settings
ccimomCross = input.string('CCI', 'Entry Signal Source', options=['CCI', 'Momentum'])
ccimomLength = input.int(10, minval=1, title='CCI/Momentum Length')
useDivergence = input.bool(false, title='Find Regular Bullish/Bearish Divergence')
rsiOverbought = input.int(65, minval=1, title='RSI Overbought Level')
rsiOversold = input.int(35, minval=1, title='RSI Oversold Level')
rsiLength = input.int(14, minval=1, title='RSI Length')
plotMeanReversion = input.bool(true, 'Plot Mean Reversion Bands on the chart')
emaPeriod = input(200, title='Lookback Period (EMA)')
bandMultiplier = input.float(1.6, title='Outer Bands Multiplier')

// CCI and Momentum calculation
momLength = ccimomCross == 'Momentum' ? ccimomLength : 10
mom = close - close[momLength]
cci = ta.cci(close, ccimomLength)
ccimomCrossUp = ccimomCross == 'Momentum' ? ta.cross(mom, 0) : ta.cross(cci, 0)
ccimomCrossDown = ccimomCross == 'Momentum' ? ta.cross(0, mom) : ta.cross(0, cci)

// RSI calculation
src = close
up = ta.rma(math.max(ta.change(src), 0), rsiLength)
down = ta.rma(-math.min(ta.change(src), 0), rsiLength)
rsi = down == 0 ? 100 : up == 0 ? 0 : 100 - 100 / (1 + up / down)
oversoldAgo = rsi[0] <= rsiOversold or rsi[1] <= rsiOversold or rsi[2] <= rsiOversold or rsi[3] <= rsiOversold
overboughtAgo = rsi[0] >= rsiOverbought or rsi[1] >= rsiOverbought or rsi[2] >= rsiOverbought or rsi[3] >= rsiOverbought

// Regular Divergence Conditions
bullishDivergenceCondition = rsi[0] > rsi[1] and rsi[1] < rsi[2]
bearishDivergenceCondition = rsi[0] < rsi[1] and rsi[1] > rsi[2]

// Mean Reversion Indicator
meanReversion = plotMeanReversion ? ta.ema(close, emaPeriod) : na
stdDev = plotMeanReversion ? ta.stdev(close, emaPeriod) : na
upperBand = plotMeanReversion ? meanReversion + stdDev * bandMultiplier : na
lowerBand = plotMeanReversion ? meanReversion - stdDev * bandMultiplier : na

// Entry Conditions
prevHigh = ta.highest(high, 1)
prevLow = ta.lowest(low, 1)
longEntryCondition = ccimomCrossUp and oversoldAgo and (not useDivergence or bullishDivergenceCondition) and (prevHigh >= meanReversion) and (prevLow >= meanReversion)
shortEntryCondition = ccimomCrossDown and overboughtAgo and (not useDivergence or bearishDivergenceCondition) and (prevHigh <= meanReversion) and (prevLow <= meanReversion)

// Plotting
oldLongEntryCondition = ccimomCrossUp and oversoldAgo and (not useDivergence or bullishDivergenceCondition)
oldShortEntryCondition = ccimomCrossDown and overboughtAgo and (not useDivergence or bearishDivergenceCondition)
plotshape(oldLongEntryCondition, title='BUY', style=shape.triangleup, location=location.belowbar, color=color.new(color.lime, 0), textcolor=color.new(color.white, 0), size=size.tiny)
plotshape(oldShortEntryCondition, title='SELL', style=shape.triangledown, location=location.abovebar, color=color.new(color.red, 0), textcolor=color.new(color.white, 0), size=size.tiny)

// Strategy logic
if (longEntryCondition)
    strategy.entry("Buy", strategy.long)
if (shortEntryCondition)
    strategy.entry("Sell", strategy.short)

// Close all open positions when outside of bands
closeAll = (high >= upperBand) or (low <= lowerBand)

if (closeAll)
    strategy.close_all("Take Profit/Cut Loss")


// Plotting
plot(upperBand, title='Upper Band', color=color.fuchsia, linewidth=1)
plot(meanReversion, title='Mean', color=color.gray, linewidth=1)
plot(lowerBand, title='Lower Band', color=color.blue, linewidth=1)