양방향 ATR 파동 거래 전략

개요
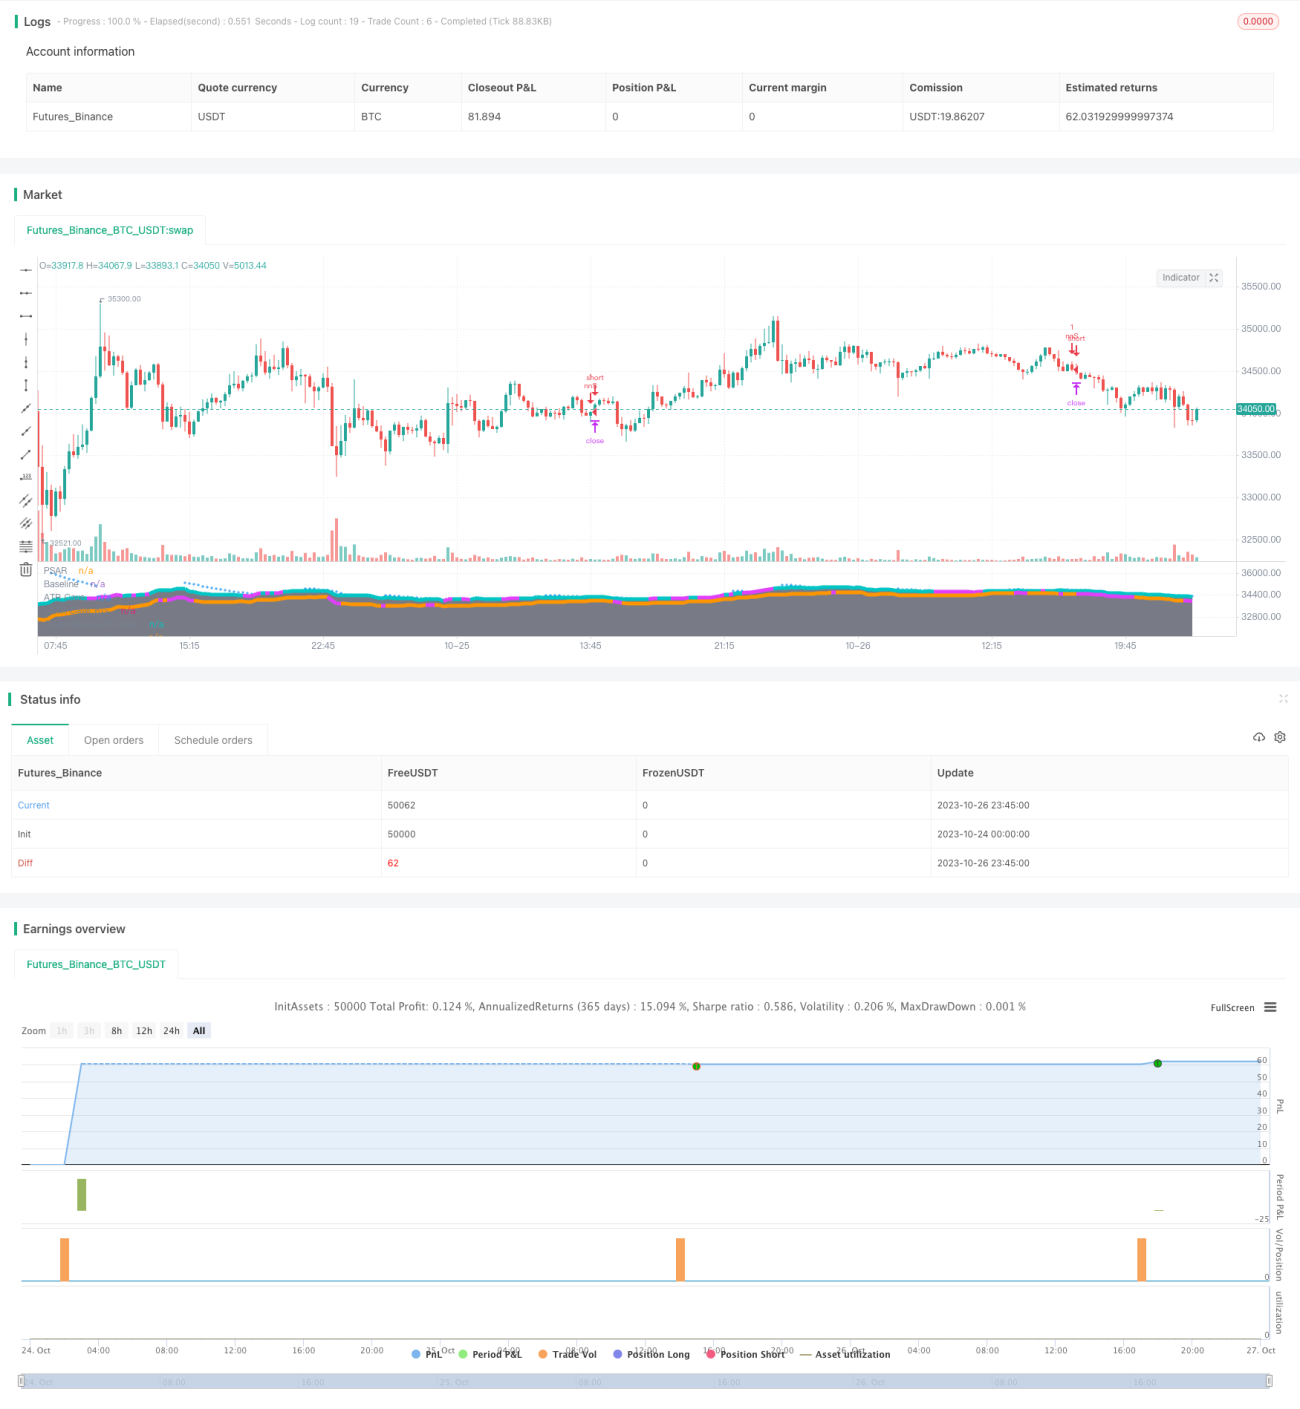
양방향 ATR 웨이브 트레이딩 전략은 동선, ATR 및 여러 기술 지표를 결합하여 트렌드 방향이 설정된 후 트렌드 추적 거래를 수행하는 트렌드 추적 전략입니다.
전략 원칙
이 전략은 Kijun 선을 주요 평평선 지표로 사용하여 가격 트렌드 방향을 판단한다. 이 전략은 ATR 통로를 결합하면서 가격 활동 범위를 제한한다. 가격이 상향 궤도에 접근 할 때 너무 많이하지 않고, 가격이 하향 궤도에 접근 할 때 공백을 두지 않고, 상하를 쫓는 것을 피한다.
키<unk> 라인이 위쪽으로 돌파할 때 구매 신호를 생성하고, 아래로 돌파할 때 판매 신호를 생성한다. 오류 신호를 필터링하기 위해, 전략은 아론 지표, RSI 지표, MACD 지표 및 PSAR 지표를 포함한 여러 기술 지표를 도입했다. 모든 지표의 확인 조건을 충족하면 구매 및 판매 신호를 생성한다.
시장에 진입한 후, 전략은 스톱로스 및 스톱<unk> 방식을 사용하여 포지션을 관리한다. 스톱로스 포인트는 0.5 ATR, 스톱<unk> 포인트는 0.5%이다. 가격이 다시 키<unk> 라인 반전을 돌파했을 때, 즉시 스톱로스 탈퇴를 선택한다.
전략적 이점
- 기<unk> 선을 사용하여 트렌드 방향을 판단하여 변동하는 시장에 갇히지 마십시오.
- ATR 통로는 가격 활동 범위를 제한하고 위험을 통제하는 데 도움이 됩니다.
- 여러 기술 지표가 확인되어 오류 신호를 크게 필터링할 수 있습니다.
- 스톱로스 스톱<unk> 리스크 관리와 결합하여 수익을 장점으로 고정합니다.
전략적 위험
- 여러 지표가 신호 지연을 확인하여 트렌드 시작 단계를 놓칠 수 있습니다.
- 스톱포인트가 너무 작으면 자주 스톱포인트가 됩니다.
- Kijun 라인 및 ATR 파라미트가 부합하지 않으면 빈번한 오류 신호가 발생할 수 있다.
- 매개 변수 최적화 및 역사 데이터 매칭 결과에 따라 실디 디스크는 좋지 않을 수 있습니다.
최적화 방향
- 이치모쿠 클라우드 그래프와 같은 더 고급 트렌드 지표를 시도해보세요.
- 스톱로스 스톱포인트를 조정하고 손실 비율을 최적화합니다.
- 다양한 시장에서 최적의 조합을 테스트하는 방법
- 실시간 시장에 따라 변수를 조정하는 자동 조정 기능을 추가합니다.
- 다양한 확인 측정치 조합의 효과를 테스트합니다.
요약하다
양방향 ATR 파동 거래 전략은 평균선, ATR 채널 및 여러 보조 기술 지표를 통합하여 트렌드 방향을 결정한 후 트렌드 추적 작업을 수행합니다. 단일 지표 전략에 비해 신호 품질과 수익률을 크게 향상시킬 수 있습니다. 동시에 제약 장치 제어 위험을 막습니다. 매개 변수 최적화 및 조합 테스트를 통해 전략은 안정적인 수익을 얻을 수 있습니다. 그러나 역사적 데이터에 지나치게 의존하는 문제에 주의해야하며 실제 디스크 효과는 여전히 검증해야합니다. 지속적인 최적화는 전략 효과를 보장하는 데 중요합니다.
- 1