저점 스캐닝 지능형 추적 방식

개요
하위 점 스캔 지능 추적법은 비 역동적인 Forex 거래 전략이다. 그것은 하위 점 스캐너를 사용하여 최저 지점을 찾고, 헐 이동 평균과 결합하여 거래 신호 판단을 수행하여 높은 승률을 달성 할 수 있다.
원리 분석
이 전략은 먼저 낮은 점 스캐너를 사용하여 최저점을 찾습니다. 낮은 점 스캐너는 가격과 거래량의 RSI 값을 계산하고 WMA 곡선과 비교하여 RSI 값이 WMA보다 낮을 때 최저점이라고 판단합니다.
다음으로, 전략은 Hull 이동 평균을 사용하여 거래 신호 판단을 수행한다. 그것은 두 개의 다른 기간의 Hull MA를 계산하며, 짧은 기간의 Hull MA가 긴 기간의 Hull MA를 통과 할 때 더 많은 것을하고, 낮은 기간의 Hull MA를 통과 할 때 공백을 만듭니다.
마지막으로, 전략은 최저점 스캔과 Hull MA의 신호를 결합하여 최저점 스캐너가 최저점 신호를 준 경우에만 Hull MA의 거래 신호를 발산하여 입점 전략을 형성한다.
이런 식으로, 시장의 최저 지점을 식별하고 추세를 추적함으로써, 잘못된 진입 시기를 효과적으로 피할 수 있으며, 거래 시스템의 승률을 높일 수 있다.
우위 분석
낮은 점 스캔의 장점은 다음과 같습니다.
-
낮은 점 스캐너를 사용하면 시장의 최저점을 정확하게 식별할 수 있으며, 높은 점에서 구매하는 것을 피할 수 있습니다.
-
헐 MA는 좋은 트렌드 추적 지표로, 큰 트렌드를 순차적으로 잡을 수 있다.
-
낮은 점 스캔과 Hull MA 상호 검증과 결합하여, 많은 양의 소음을 필터링하여 가짜 신호를 줄일 수 있다.
-
점진적 손실 퇴출 메커니즘을 적용하여 수익을 최대한 고정하고 회귀를 피할 수 있습니다.
-
이 전략은 역동적인 지표가 아니라, 역사적 데이터를 조작하지 않고, 진실하고 신뢰할 수 있습니다.
위험 분석
이 전략에는 다음과 같은 위험들이 있습니다.
-
최저점 스캐너는 최저점의 일부를 누락할 수 있으며, 이는 거래 기회를 놓치게 할 수 있다. 스캐닝 범위를 넓히기 위해 파라미터를 적절히 조정할 수 있다.
-
급격한 반전이 발생할 수 있으며, 이로 인해 중지 손실이 발생할 수 있습니다. 중지 손실 범위를 적절히 완화하고 위치 크기를 합리적으로 제어 할 수 있습니다.
-
잘못된 매개 변수 설정으로 인해 거래 신호가 너무 많거나 너무 적을 수 있습니다. 최적의 매개 변수 조합을 찾기 위해 여러 번 반복적으로 최적화해야합니다.
-
이 전략은 트렌드가 뚜렷한 FOREX 품종에만 적용되며, 평형, 흔들리는 시장의 거래에는 적합하지 않습니다.
최적화 방향
이 전략은 다음과 같은 측면에서 최적화될 수 있습니다.
-
최저점 스캐너의 파라미터를 최적화하여 최저점을 더 정확하게 식별할 수 있도록 한다.
-
헐 MA의 파라미터를 최적화하여 트렌드를 보다 정확하게 추적할 수 있도록 한다.
-
MACD, KDJ 등과 같은 다른 지표 필터를 추가하여 신호의 신뢰성을 높인다.
-
기계 학습 모델 예측 결과를 추가하여 거래 신호 판단을 지원합니다.
-
시장의 변동에 따라 동적으로 조정할 수 있도록 손해 방지 장치를 최적화하십시오.
-
포지션 관리 전략을 최적화하여 시스템에서 자금 관리 규칙에 따라 포지션을 동적으로 조정할 수 있도록 한다.
요약하다
하위점 스캔 지능 추적법은 높은 승률의 비 역동적인 외환 거래 전략이다. 그것은 시장의 최저점을 정확하게 식별할 수 있고, 추세가 명확할 때 순차적으로 입문하고, 점진적 인 손실을 차단하여 수익을 고정 할 수 있다. 이 전략은 최적화 할 수있는 공간이 넓고, 여러 측면에서 개선 할 수 있으며, 강력한 자동 거래 시스템으로 만들 수 있다.
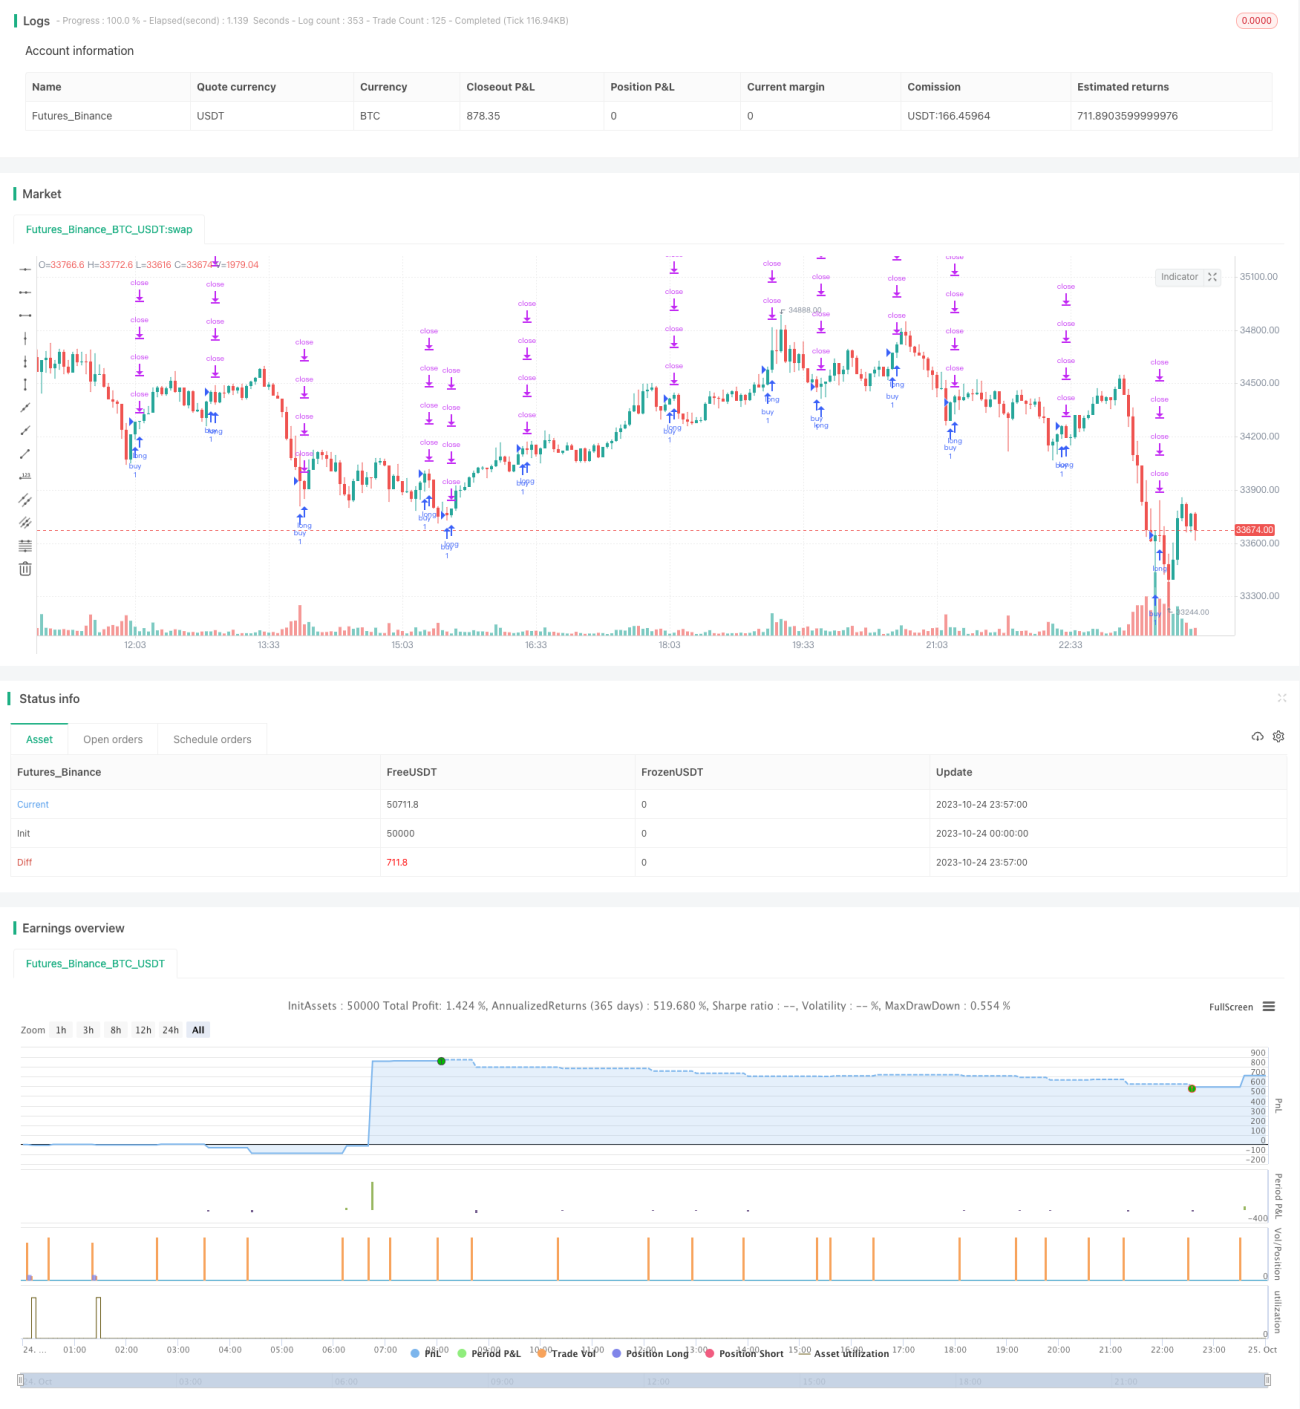
/*backtest
start: 2023-10-24 00:00:00
end: 2023-10-25 00:00:00
period: 3m
basePeriod: 1m
exchanges: [{"eid":"Futures_Binance","currency":"BTC_USDT"}]
*/

// © theCrypster 2020

//@version=4
// strategy(title = "Low Scanner Forex strategy", overlay = false, pyramiding=1,initial_capital = 1000, default_qty_type= strategy.percent_of_equity, default_qty_value = 100, calc_on_order_fills=false, slippage=0,commission_type=strategy.commission.percent,commission_value=0)- 1