
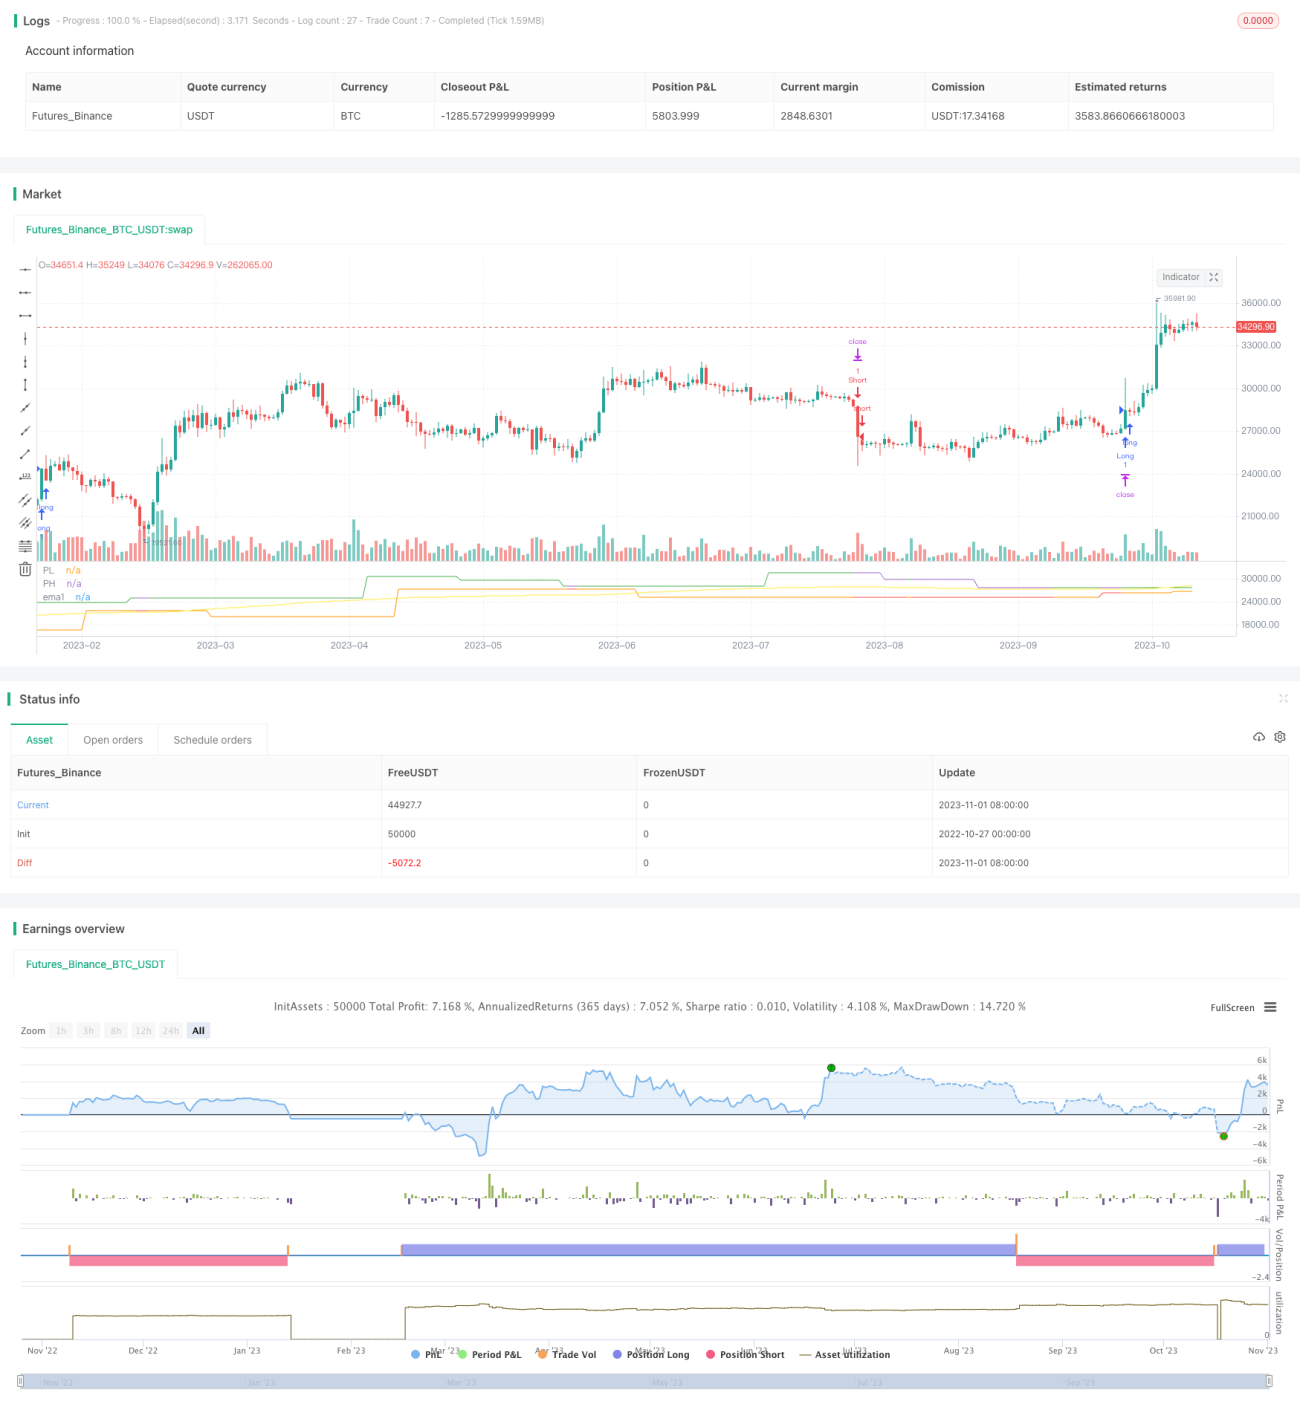
이 전략은 이동량의 돌파구를 기반으로 거래 신호를 생성합니다. 주요 아이디어는 지정된 시간 동안 가격의 움직임을 관찰하고 이동량의 돌파구를 통해 가격의 경향 변화를 판단하는 것입니다.
이 전략은 가격의 움직임을 판단하기 위해 특정 기간 동안의 최고 가격과 최저 가격, 즉 피벗 하이와 피벗 로우를 계산합니다.
구체적으로, 전략은 과거 N 근 K 선의 최고값을 피벗 하이, 과거 M 근 K 선의 최저값을 피벗 로우로 계산한다. 현재 K 선의 최고점이 피벗 하이를 초과할 때, 다중 신호를 생성한다. 현재 K 선의 최저점이 피벗 로우를 넘어설 때, 다중 신호를 생성한다.
오이즈와 코스카이즈 후, 전략은 ATR을 사용하여 중지 손실을 설정하고 하루 동안 단계적으로 중지합니다. 동시에, 전략은 특정 시간 동안 (예: 14:55 분) 모든 위치를 청산합니다.
이 전략은 특정 시간 범위 내의 가격 돌파구를 간단하고 효과적으로 사용하여 트렌드를 포착합니다. 이는 하루 단시간 거래에 적합합니다. 계산이 명확하고 실행하기 쉽습니다.
적절하게 조정할 수 있는 시간, 또는 다른 지표의 조합으로 진출 시점을 결정할 수 있다.
적절한 파라미터를 조정하거나, 트렌드 지표, 거래량 등과 같은 필터 조건을 추가할 수 있습니다.
포지션 크기를 조정할 수 있습니다. 또는 포지션 기간을 적절하게 연장할 수 있습니다.
다른 시장 상황에 따라 매개 변수를 조정하거나 기계 학습과 같은 방법을 사용하여 자동으로 최적화하십시오.
다른 가격 데이터를 시도해 보세요.
거래량이나 변동률을 증가시키는 필터 조건
다른 변수 조합을 시도합니다.
트렌드 지표와 함께 트렌드 방향을 결정합니다.
기계학습을 사용하여 자동으로 최적화합니다.
이 비디오는 한 시간 동안의 시간으로 확장되고,
이 전략의 전체적인 아이디어는 명확하고 간결하며, 가격의 이동 돌파구를 효과적으로 활용하여 단기 트렌드를 포착하여 높은 수익 인자를 달성합니다. 전략의 매개 변수는 적고, 테스트 및 최적화가 쉽고, 일일 단선 작동에 적합합니다.
/*backtest
start: 2022-10-27 00:00:00
end: 2023-11-02 00:00:00
period: 1d
basePeriod: 1h
exchanges: [{"eid":"Futures_Binance","currency":"BTC_USDT"}]
*/
// ____________ _________ _____________
// |____________| ||________| ||__________|
// || || || ||
// || ||________|| ||
// || H E ||________ U L L || H A R T I S T
// || || || ||
// || ||________|| ||__________
// || ||________| ||__________|
//@version=5
// strategy("PIVOT STRATEGY [5MIN TF]",overlay=true ,commission_type = strategy.cash, commission_value = 30 , slippage = 2, default_qty_value = 60, currency = currency.NONE, pyramiding = 0)
leftbars = input(defval = 10)
rightbars = input(defval = 15)
// ═══════════════════════════ //
// ——————————> INPUTS <——————— //
// ═══════════════════════════ //
EMA1 = input.int(title='PRICE CROSS EMA', defval = 150, minval = 10 ,maxval = 400)
factor1 = input.float(title='_ATR LONG',defval = 3.2 , minval = 1 , maxval = 5 , step = 0.1, tooltip = "ATR TRAIL LONG")
factor2 = input.float(title='_ATR SHORT',defval = 3.2 , minval = 1 , maxval = 5 , step = 0.1, tooltip = "ATR TRAIL SHORT")
risk = input.float(title='RISK',defval = 200 , minval = 1 , maxval = 5000 , step = 50, tooltip = "RISK PER TRADE")
var initialCapital = strategy.equity
t = time(timeframe.period, '0935-1400:1234567')
time_cond = true
// ══════════════════════════════════ //
// ———————————> EMA DATA <——————————— //
// ══════════════════════════════════ //
ema1 = ta.ema(close, EMA1)
plot(ema1, color=color.new(color.yellow, 0), style=plot.style_linebr, title='ema1')
// ══════════════════════════════════ //
// ————————> TRAIL DATA <———————————— //
// ══════════════════════════════════ //
// *******Calculate LONG TRAIL data*****
ATR_LO = ta.atr(14)*factor1
// *******Calculate SHORT TRAIL data*****
ATR_SH = ta.atr(14)*factor2
longStop = close - ATR_LO
shortStop = close + ATR_SH
// Plot atr data
//plot(longStop, color=color.new(color.green, 0), style=plot.style_linebr, title='Long Trailing Stop')
//plot(shortStop , color=color.new(color.red, 0), style=plot.style_linebr, title='Short Trailing Stop')
// ══════════════════════════════════════════════════════════════════════════════════════════════════════════════════════════════════════════════════════════════════════════ //
// ————————————————————————————————————————————————————————> PIVOT DATA <———————————————————————————————————————————————————————————————————————————————————————————————————— //
// ══════════════════════════════════════════════════════════════════════════════════════════════════════════════════════════════════════════════════════════════════════════ //
ph = ta.pivothigh(close,leftbars, rightbars)
pl = ta.pivotlow(close,leftbars, rightbars)
pvt_condition1 = not na(ph)
upper_price = 0.0
upper_price := pvt_condition1 ? ph : upper_price[1]
pvt_condition2 = not na(pl)
lower_price = 0.0
lower_price := pvt_condition2 ? pl : lower_price[1]
// Signals
long = ta.crossover(high, upper_price + syminfo.mintick)
short = ta.crossunder(low, lower_price - syminfo.mintick)
plot(upper_price, color= close > ema1 ? color.green : na, style=plot.style_line, title='PH')
plot(lower_price, color= close < ema1 ? color.red : na, style=plot.style_line, title='PL')
// ══════════════════════════════════//
// ————————> LONG POSITIONS <————————//
// ══════════════════════════════════//
//******barinstate.isconfirmed used to avoid repaint in real time*******
if ( long and strategy.opentrades==0 and barstate.isconfirmed and time_cond and close >= ema1 )
strategy.entry(id= "Long" ,direction = strategy.long, comment = "B")
//plot(longStop , color=color.new(color.blue, 0), style=plot.style_linebr, title='long Stop')
if strategy.position_size > 0
strategy.exit("long tsl", "Long" , stop = longStop ,comment='S')
// ═════════════════════════════════════//
// ————————> SHORT POSITIONS <————————— //
// ═════════════════════════════════════//
if ( short and strategy.opentrades==0 and barstate.isconfirmed and time_cond and close <= ema1 )
strategy.entry(id = "Short" ,direction = strategy.short, comment = "S")
if strategy.position_size < 0
strategy.exit("short tsl", "Short" , stop = shortStop ,comment='B')
// ════════════════════════════════════════════════//
// ————————> CLOSE ALL POSITIONS BY 3PM <————————— //
// ════════════════════════════════════════════════//
strategy.close_all(when = hour == 14 and minute == 55)
// ════════════════════════════════════════//
// ————————> MAX INTRADAY LOSS <————————— //
// ════════════════════════════════════════//
// strategy.risk.max_intraday_loss(type = strategy.cash, value = risk)