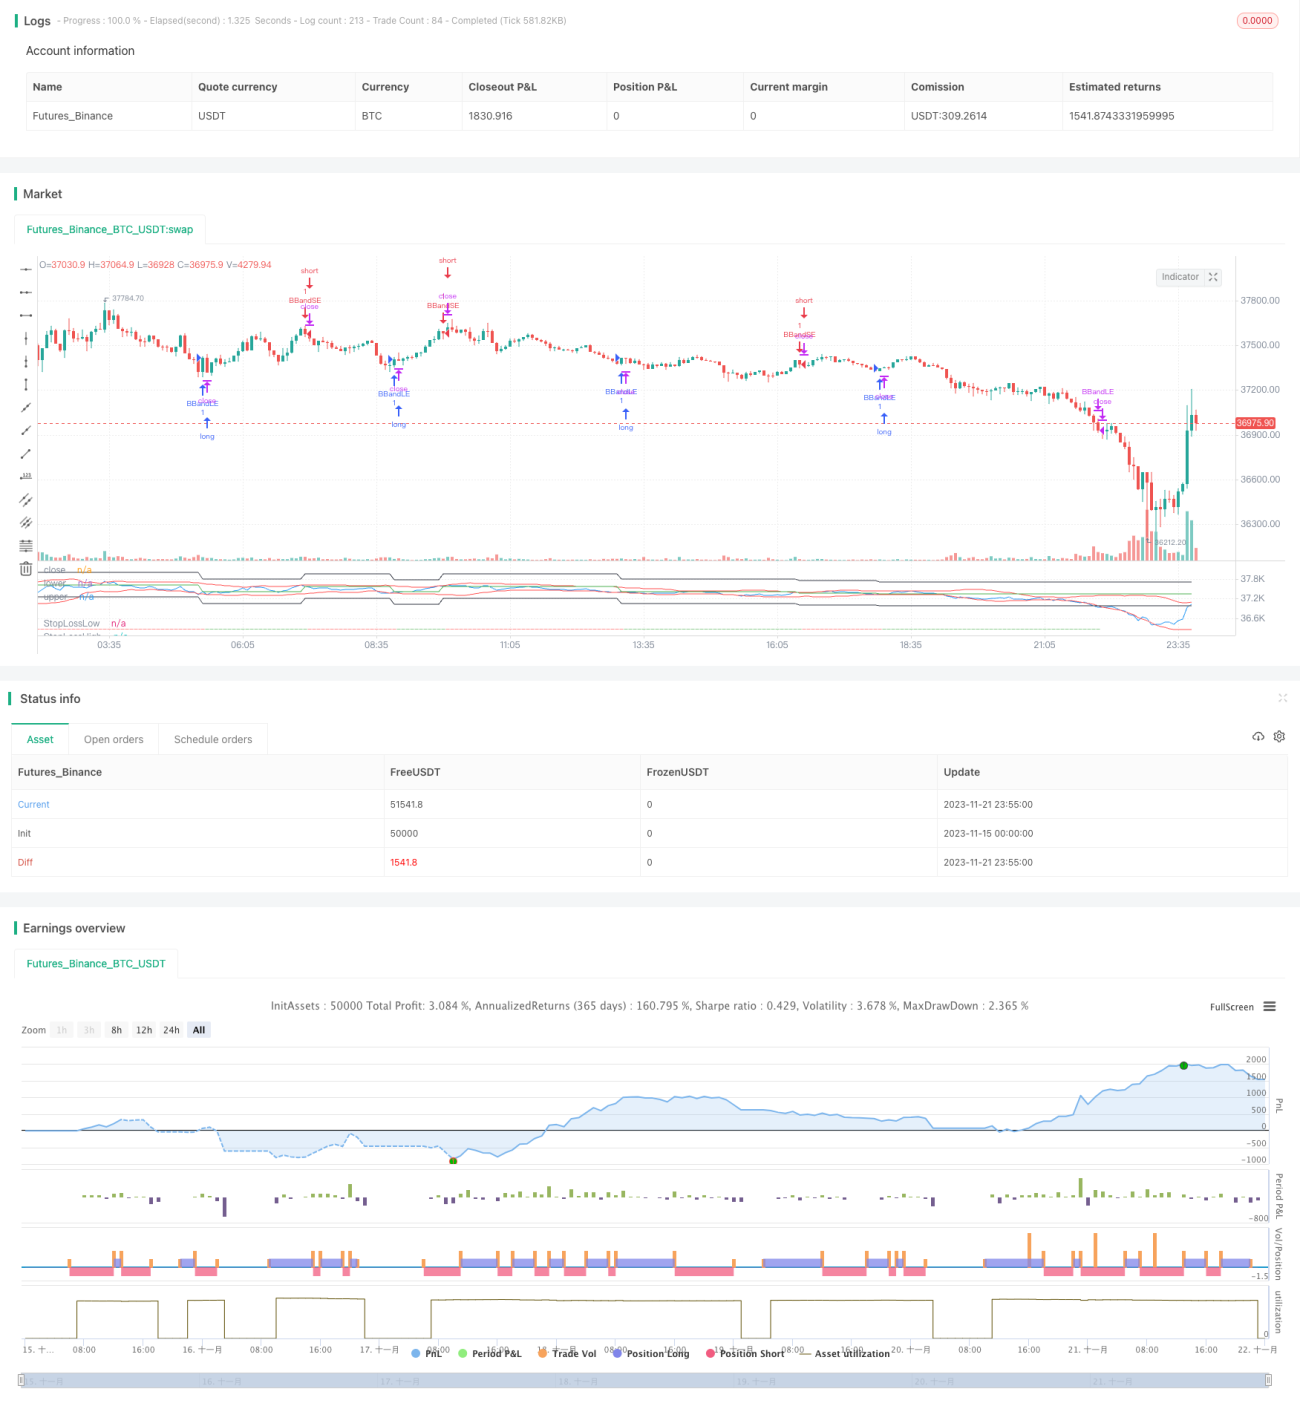
볼링거 밴드 스톱 로스 전략

저자:차오장, 날짜: 2023-11-23 15:49:12
태그:

img

전반적인 설명

볼링거 밴드 전략 (Bollinger Bands Strategy) 은 트렌드 추적 및 과잉 구매 / 과잉 판매 신호를 위해 볼링거 밴드를 사용하는 고전적인 전략이다. 이 버전은 원래 전략보다 위험을 제어하기 위해 스톱 로스 메커니즘을 추가합니다.

이 전략은 포지션을 설정하기 위해 상부/하부 볼링거 밴드의 황금/죽은 크로스오버를 통해 과반 구매/ 과반 판매 조건을 판단합니다. 밴드 사이의 영역은 현재 시장 변동성 범위를 반영합니다. 밴드는 중부, 상부 및 하부 밴드로 구성되며, 중부 밴드는 N 일간 간단한 이동 평균이며 상부/하부 밴드는 중부 밴드 +/- K 표준 편차입니다.

원칙

볼링거 밴드는 시장의 변동성과 변동 범위를 반영합니다. 하위 밴드를 만지는 것은 과잉 판매 현상을 의미합니다 - 격차는 채워질 확률이 높습니다. 따라서 평균 반전 원칙에 따라 긴 포지션을 고려해야합니다. 마찬가지로 상위 밴드를 만지는 것은 잠재적인 과잉 구매 조건과 가능성이 높은 가격 반전을 나타냅니다. 따라서 하위 움직임에서 이익을 얻기 위해 짧은 포지션을 설정 할 수 있습니다.

이 전략은 트렌드 추적 엔트리를 위해 볼링거 밴드에서 과잉 구매 / 과잉 판매 신호를 결합합니다. 위험 통제를 위해 스톱 로스 메커니즘이 통합됩니다.

가격이 하위 범위를 넘을 때 시장은 지나친 판매 영역을 합리적인 범위로 빠져 나간다. 긴 포지션은 열 수 있다. 가격이 상위 범위를 넘을 때 시장은 지나친 구매가 된다. 그 다음 쇼트 포지션은 열 수 있다.

주문이 완료되면 위험을 관리하기 위해 일정한 비율의 스톱 로스 레벨이 설정됩니다. 손실이 스톱 로스 비율을 초과하면 추가 손실을 제한하기 위해 현재 포지션은 중단됩니다.

장점

  1. 범주 크로스오버를 판단하여 낮은 구매-높은 판매 설정에 대한 볼링거 밴드를 사용하여 과소 구매/ 과소 판매 수준을 식별합니다.

  2. 볼링거 밴드의 변동성 특성을 통해 트렌드를 포착합니다.

  3. 스톱 로스 메커니즘은 거래당 최대 손실을 효과적으로 제한합니다.

  4. 트렌드 추적과 스톱 로스를 결합하면 안정적인 이득이 됩니다.

위험 과 최적화

  1. 매개 변수 설정은 신호 품질에 영향을 미칩니다. 중간 대역 길이가 N이고 표준편차 배수자 K는 다른 시장에 합리적으로 설정되어야합니다. 그렇지 않으면 정확도가 떨어집니다.

  2. 너무 크거나 너무 작은 스톱 손실은 수익 안정성을 손상시킵니다. 너무 큰 비율은 거래 당 더 큰 손실을 초래할 위험이 있으며, 미미한 비율의 위험은 조기 스톱 손실을 유발합니다. 합리적인 비율은 다른 제품에 따라 설정해야합니다.

  3. 다른 지표가 있는 추가 필터는 신호의 정확도를 향상시킬 수 있습니다.

  4. 다른 보유 기간 설정을 테스트 할 수 있습니다. 예를 들어 더 높은 주파수 거래 및 자본 사용 효율성 향상을 위해 시간 또는 짧은 기간 대역을 결합하는 것.

결론

이 전략은 과잉 구매/ 과잉 판매 신호를 위해 볼링거 밴드를 활용하고 위험 통제를 위해 스톱 로스를 통합합니다. 이것은 일반적인 트렌드 추적 전략입니다. 매개 변수를 최적화하고 더 정확한 신호와 스톱 로스 수준을 통합함으로써 안정적인 이익을 얻을 수 있습니다.


/*backtest
start: 2023-11-15 00:00:00
end: 2023-11-22 00:00:00
period: 5m
basePeriod: 1m
exchanges: [{"eid":"Futures_Binance","currency":"BTC_USDT"}]
*/

//@version=5
strategy(title="Bollinger Bands Strategy", overlay=false, shorttitle="BBS", pyramiding=0, currency=currency.USD, commission_type=strategy.commission.percent, commission_value=0.03, initial_capital=1000)
source = input(close, "Source")
length = input.int(20, minval=1)
mult = input.float(2.0, minval=0.001, maxval=50, step=0.001)
stopLossFactor = input.float(1, "Stop Loss Percent", maxval = 100, minval = 0, step=0.1)

basis = ta.sma(source, length)
dev = mult * ta.stdev(source, length)
upper = basis + dev
lower = basis - dev

var float lastTradePrice = na
var float stopLossLow = na
var float stopLossHigh = na
var bool currentIsLong = na

var bool nextExpectedIsLong = true

var bool existedLong = false
var bool existedShort = false

buyEntry = ta.crossover(source, lower)
sellEntry = ta.crossunder(source, upper)

if (buyEntry and nextExpectedIsLong == true)
	strategy.entry("BBandLE", strategy.long, comment="BBandLE")
	nextExpectedIsLong := false
	if(nz(strategy.position_size[1], 0) < 0) // new position detected
	    lastTradePrice := close
	    stopLossLow := lastTradePrice * (1 - (stopLossFactor / 100))
	    stopLossHigh := lastTradePrice * (1 + (stopLossFactor / 100))
else
    strategy.cancel("BBandLE")

if (sellEntry and nextExpectedIsLong == false)
	strategy.entry("BBandSE", strategy.short, comment="BBandSE")
	nextExpectedIsLong := true
	if(nz(strategy.position_size[1], 0) > 0) // new position detected
        lastTradePrice := close
        stopLossLow := lastTradePrice * (1 - (stopLossFactor / 100))
        stopLossHigh := lastTradePrice * (1 + (stopLossFactor / 100))
else
    strategy.cancel("BBandSE")

strategy.close("BBandLE", close < stopLossLow)
strategy.close("BBandSE", close > stopLossHigh)

// if(nz(strategy.position_size[1], 0) < 0 and close > stopLossHigh)
//     strategy.entry("BBandLE", strategy.long, comment="BBandLE")
// 	lastTradePrice := close
// 	stopLossLow := lastTradePrice * (1 - (stopLossFactor / 100))
// 	stopLossHigh := lastTradePrice * (1 + (stopLossFactor / 100))
// if(nz(strategy.position_size[1], 0) > 0 and close < stopLossLow)
//     strategy.exit("BBandSE", strategy.short, comment="BBandSE")
//     lastTradePrice := close
//     stopLossLow := lastTradePrice * (1 - (stopLossFactor / 100))
//     stopLossHigh := lastTradePrice * (1 + (stopLossFactor / 100))

plot(source, "close", color.blue)
plot(lower, "lower", color.red)
plot(upper, "upper", color.red)
plot(stopLossLow, "StopLossLow", color.black)
plot(stopLossHigh, "StopLossHigh", color.black)
plot(lastTradePrice, "lastTradePrice", color.green)
plotchar(strategy.position_size > 0, char="-", size=size.tiny, location=location.bottom, color=color.green)
plotchar(strategy.position_size < 0, char="-", size=size.tiny, location=location.bottom, color=color.red)


더 많은