개요: 이 전략은 평행선 교차를 기반으로 한 고전적인 거래 전략이며, 지표는 간단한 이동 평균 ((SMA), 지수 이동 평균 ((EMA), 선형 가중 이동 평균 ((VWMA) 및 충격 가중 이동 평균 ((HMA) 을 포함한 쌍평균선을 선택했습니다.
원칙: 전략의 핵심 논리는 쌍평균선 교차이다. 두 개의 다른 변수의 평균을 계산하여, 빠른 평균선 위에 느린 평균선을 통과하면 구매 신호를 생성하고, 빠른 평균선 아래에 느린 평균선을 통과하면 판매 신호를 생성한다. 평평선 교차는 가격의 단기 및 장기 경향의 전환을 나타낸다.
장점 분석: 쌍평평선 교차 전략의 장점은 주로 간단하고 쉽게 작동하는 데 있습니다. 하나의 신호를 통해 가장 기본적인 추세를 판단 할 수 있습니다. 너무 많은 매개 변수 선택 및 조정이 필요하지 않습니다. 초보자 거래자에게 적합합니다. 그리고 다른 유형의 평평선은 테스트가 있으며, 다양한 조합을 선택할 수 있습니다.
위험 분석: 이 전략의 주요 위험은 일반적인 평균선 교차 전략에 많은 가짜 신호가 있을 수 있다는 점이며, 이로 인해 소액의 이익을 얻는 여러 차례의 청산 문제가 발생하여 전반적인 수익에 영향을 미칩니다. 또한, 고정된 빠르고 느린 평균선 길이 설정도 특정 주기 아래에서 작동하지 않습니다.
최적화 방향:1) 다양한 주기 테스트를 시도하여 최적의 평균선 교차 주기 조합을 결정한다。2) 두 번째 집합의 평균선과 RSI 지표의 보조 판단을 도입하는 것을 고려하여 거짓 신호를 줄인다。3) 간단한 교차가 아닌 MA 지표의 증가량 변화에 기반한 조건 판단을 도입하여 더 신뢰할 수 있는 교차 판단을 얻는다。
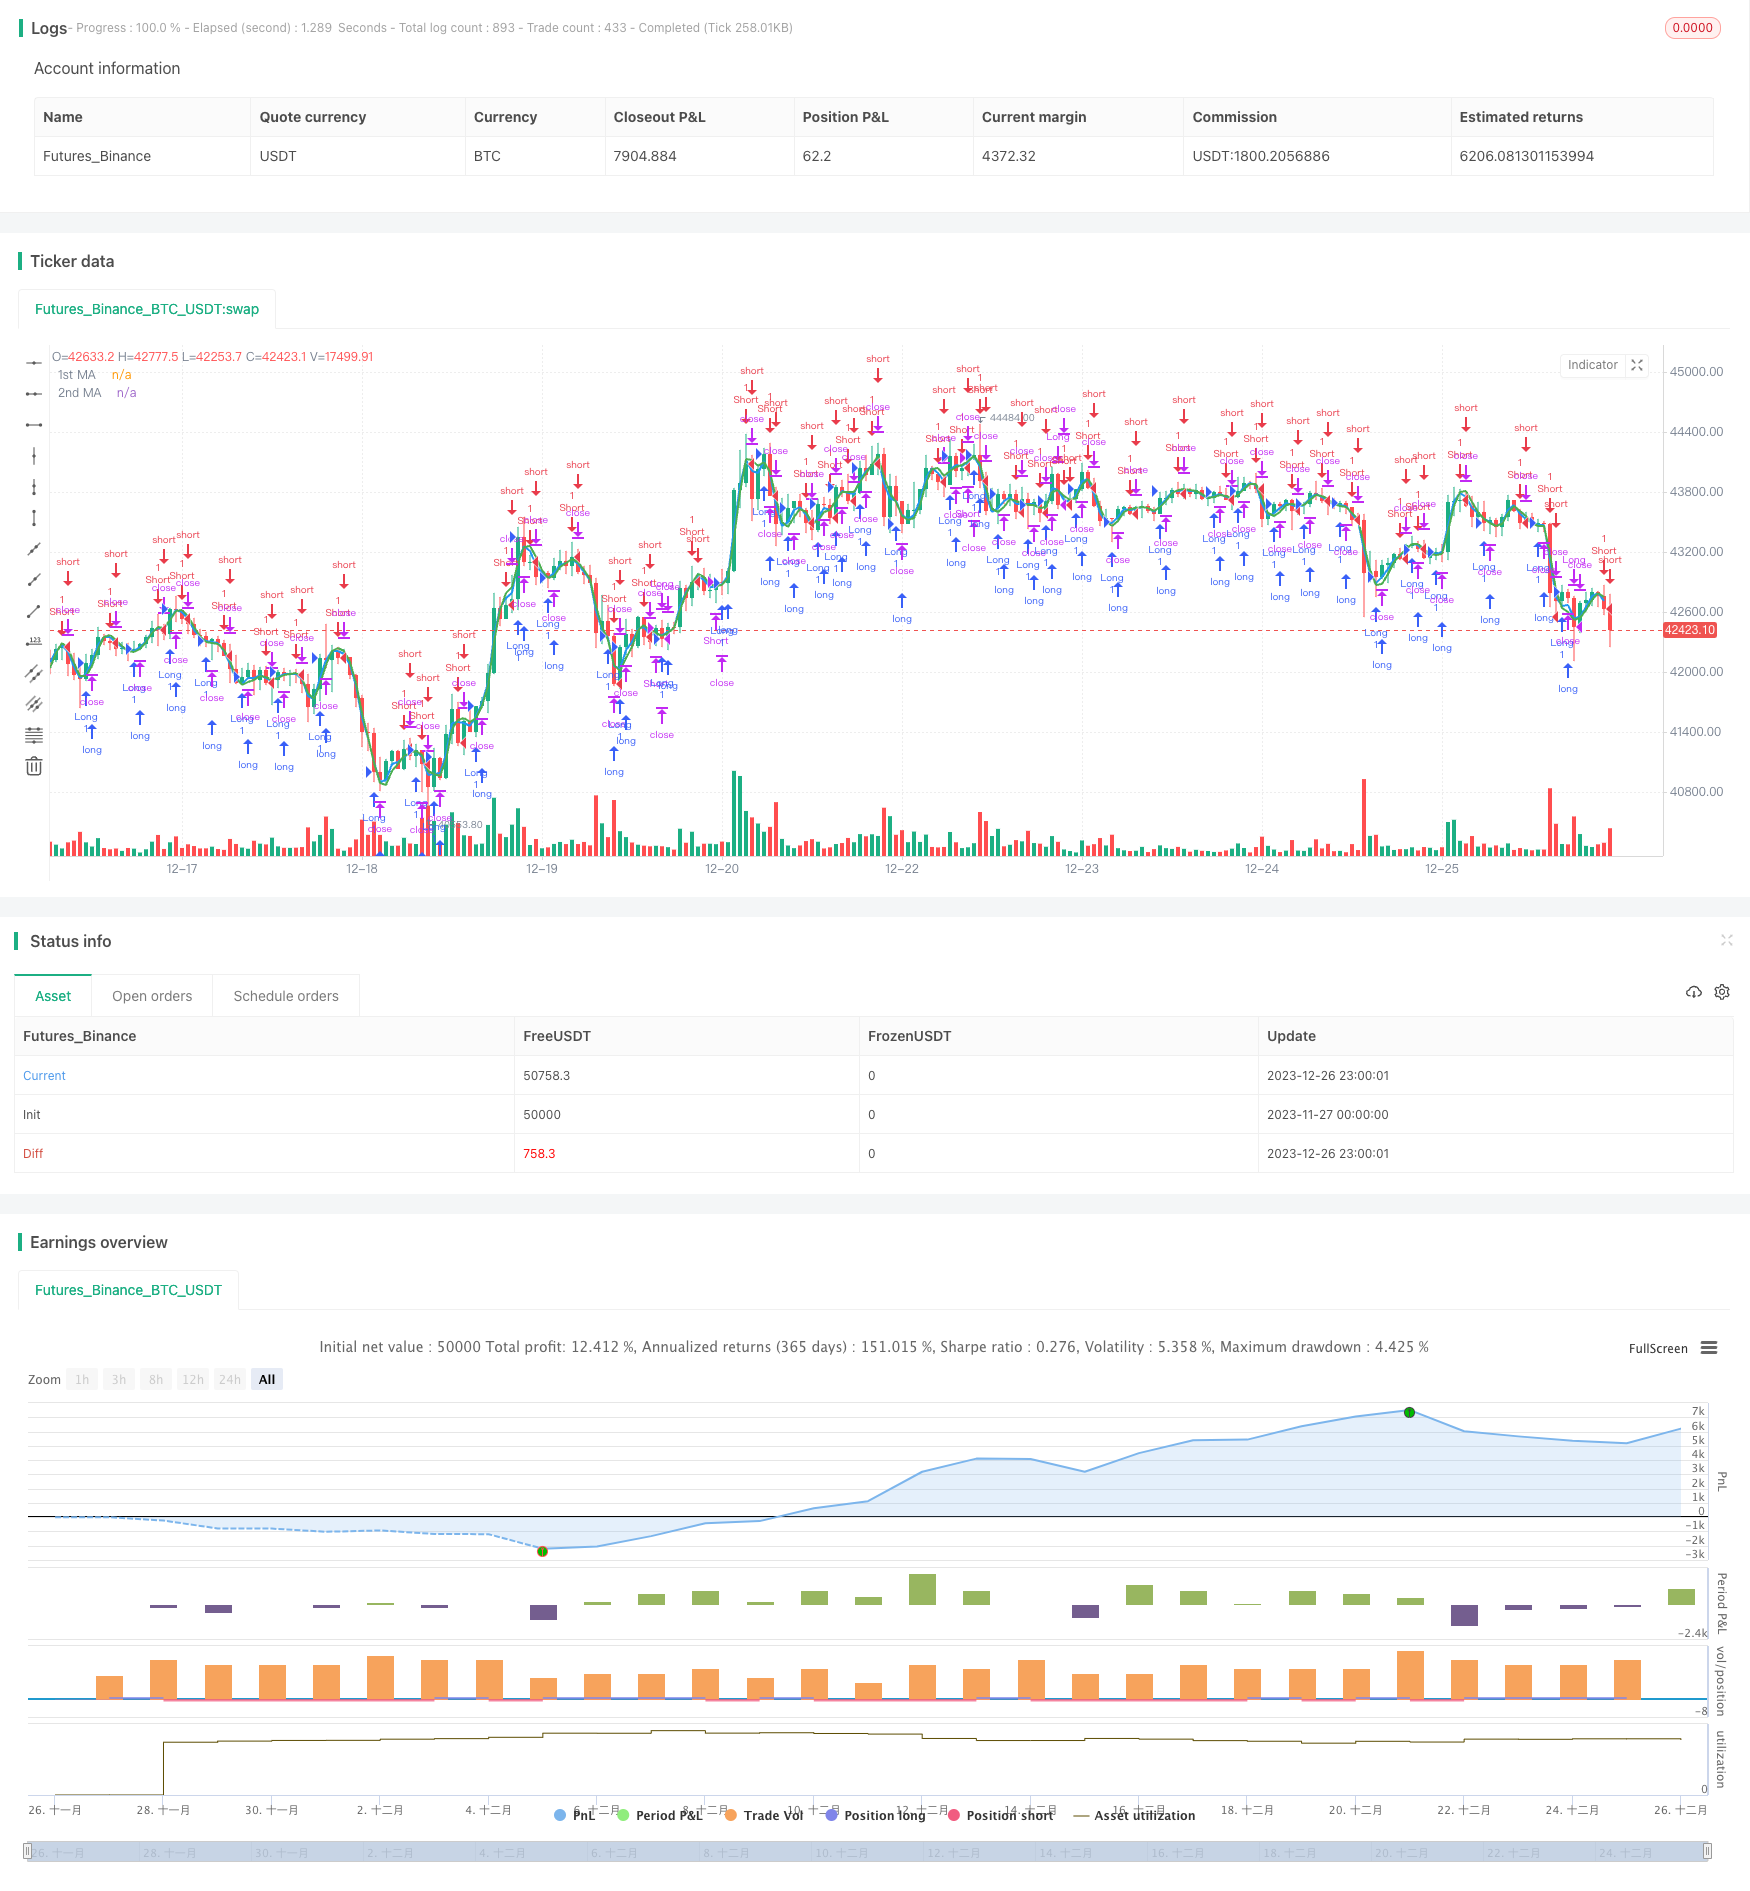
요약: 이 전략은 전통적인 평행선 교차 전략의 틀을 채택하고, 양평선 테스트를 수행하여 최적의 평행선 주기 조합을 찾으며, 평행선 ROC 및 가격에 기반한 손실 판단을 추가합니다.
/*backtest
start: 2023-11-27 00:00:00
end: 2023-12-27 00:00:00
period: 1h
basePeriod: 15m
exchanges: [{"eid":"Futures_Binance","currency":"BTC_USDT"}]
*/

//@version=3
//study(title="MA Crossover Strategy", overlay = true)
strategy("MA Crossover Strategy with MA Turning Point Exits", overlay=true)
src = input(close, title="Source")

price = request.security(syminfo.tickerid, timeframe.period, src)
ma1 = input(5, title="1st MA Length")
type1 = input("HMA", "1st MA Type", options=["SMA", "EMA", "HMA", "VWMA"])

ma2 = input(7, title="2nd MA Length")
type2 = input("HMA", "2nd MA Type", options=["SMA", "EMA", "HMA", "VWMA"])

f_hma(_src, _length)=>
    _return = wma((2*wma(_src, _length/2))-wma(_src, _length), round(sqrt(_length)))
price1 = if (type1 == "SMA")
    sma(price, ma1)
else
    if (type1 == "EMA")
        ema(price, ma1)
    else
        if (type1 == "VWMA")
            vwma(price, ma1)
        else
            f_hma(price, ma1)

price2 = if (type2 == "SMA")
    sma(price, ma2)
else
    if (type2 == "EMA")
        ema(price, ma2)
    else
        if (type2 == "VWMA")
            vwma(price, ma2)
        else
            f_hma(price, ma2)

//plot(series=price, style=line,  title="Price", color=black, linewidth=1, transp=0)
plot(series=price1, style=line,  title="1st MA", color=blue, linewidth=2, transp=0)
plot(series=price2, style=line, title="2nd MA", color=green, linewidth=2, transp=0)


longCondition = crossover(price1, price2)
if (longCondition) // and time>timestamp(2018,6,1,9,30)
    strategy.entry("Long", strategy.long)

shortCondition = crossunder(price1, price2)
if (shortCondition) // and time>timestamp(2018,6,1,9,30)
    strategy.entry("Short", strategy.short)

lookback1 = input(1, "Lookback 1")
roc1 = roc(price1, lookback1)

ma1up = false
ma1down = false
ma2up = false
ma2down = false

ma1up := nz(ma1up[1])
ma1down := nz(ma1down[1])
ma2up := nz(ma2up[1])
ma2down := nz(ma2down[1])

trendStrength1 = input(2, title="Minimum slope magnitude * 100", type=float) * 0.01

if crossover(roc1, trendStrength1)
    ma1up := true
    ma1down := false

if crossunder(roc1, -trendStrength1)
    ma1up := false
    ma1down := true

shortexitCondition = ma1up and ma1down[1]
if (shortexitCondition)
    strategy.close("Short")

longexitCondition = ma1down and ma1up[1]
if (longexitCondition)
    strategy.close("Long")