개요
이 전략은 고스 오차 함수를 기반으로 가격 변화의 P-Signal 지표를 계산하는 양적 거래 전략이다. P-Signal 지표를 사용하여 가격 동향과 전환점을 판단하고, 이를 통해 진입 및 퇴출 시간을 결정한다.
전략 원칙
이 전략의 핵심 지표는 P-Signal. P-Signal의 계산 공식은 다음과 같다:
fPSignal(ser, int) =>
    nStDev = stdev(ser, int)
    nSma = sma(ser, int)
    fErf(nStDev > 0 ? nSma/nStDev/sqrt(2) : 1.0)
여기서 ser는 가격의 순서를, int는 nPoints의 변수를 나타냅니다. 즉, 얼마나 많은 K줄을 보는지 살펴봅니다. 이 공식은 세 부분으로 구성됩니다:
- nStDev는 가격의 표준차입니다.
- nSma는 가격의 간단한 이동 평균입니다.
- fErf는 고스 오류 함수이다.
전체 공식은 가격의 이동 평균을 가격의 표준 차로 나누고, 다시 sqrt ((2) 로 나누고, 가스의 오류 함수를 통해 ((-1, 1) 영역으로 지도합니다. 즉, 가격의 변동이 평균보다 크면 P-Signal은 1에 가깝습니다. 가격의 변동이 평균보다 작다면 P-Signal은 -1에 가깝습니다.
전략은 P-Signal의 수와 그 변화된 기호를 사용하여 입출소를 결정한다:
strategy.entry("long", strategy.long, 1, when = nPSignal < 0 and ndPSignal > 0)

strategy.close("long", when = nPSignal > 0 and ndPSignal < 0)
P-Signal이 0보다 작고 긍정적으로 변할 때 더 많이; P-Signal이 0보다 크고 부정적으로 변할 때 평형한다.
전략적 이점
이 전략은 다음과 같은 장점을 가지고 있습니다.
- 가우스 오류 함수를 사용하여 가격 분포를 맞추어 . 가우스 오류 함수는 정상적인 분포를 잘 맞추어 주며, 이는 대부분의 금융 시간계 배열 분포 특성과 일치한다.
- 가격의 표준 차이를 이용해서 자동으로 변수를 조정한다. 이것은 전략 변수의 범위를 넓히고, 시장의 변화에 더 민감하게 반응한다.
- P-시그널 지표는 트렌드와 반전 트레이드의 장점을 결합한다. 그것은 가격 변동의 트렌드를 고려하고 가격 반전의 지점을 고려합니다. 이것은 트렌드 거래와 반전 거래 기회를 잡는 데 도움이됩니다.
위험 분석
이 전략에는 다음과 같은 위험도 있습니다.
- 높은 주파수 거래 위험. 이 전략은 전형적인 높은 주파수 거래 전략이며, 더 많은 거래를 생성하고, 더 높은 거래 비용과 슬라이드 포인트 위험을 감수한다.
- 불안정한 상황에서는 P-Signal 지표가 좋지 않습니다. P-Signal 지표는 가격의 명확한 추세와 규칙이 없는 시장에서 많은 가짜 신호를 생성합니다.
- 매개 변수 최적화가 어려워진다. 공식의 여러 매개 변수들 사이의 관계는 복잡하여 매개 변수 최적화가 상대적으로 어려워진다.
이러한 위험을 줄이기 위해, 필터링 조건을 추가하고 거래 횟수를 줄이는 것을 고려할 수 있습니다. 파라미터 조합과 거래 비용 설정을 최적화하고, 적당한 품종을 선택하여 실 디스크 마찰을 고려할 수 있습니다.
최적화 방향
이 전략에는 더 많은 최적화가 가능하며, 주요 방향은 다음과 같습니다.
- 필터링 조건을 추가하여 가짜 신호를 방지한다. 예를 들어, 다른 지표와 결합하여 AND 또는 OR 조건을 수행하여 Noise의 일부를 필터링한다.
- 최적화 변수 모음. n포인트의 크기를 다른 품종과 주기에서 조정하고 전략의 안정성을 개선한다.
- 동적 변수를 고려하십시오. nPoints 변수를 시장의 변동에 따라 조정하도록하십시오. 이것은 전략의 무작위성을 향상시킬 수 있습니다.
- 기계학습과 결합하여 AI 알고리즘을 사용하여 파라미터, 필터 조건 및 다중 품종 선택에 최적화하십시오.
요약하다
전체적으로 이 전략의 핵심 아이디어는 새로운 것으로, 가우스 함수를 사용하여 가격 분포를 맞추고, 자동으로 파라미터 범위를 조정한다. 하지만, 고주파 거래 전략으로서, 더 많은 테스트와 최적화가 필요하며, 특히 위험 제어와 파라미터 조정 측면에서, 실물 상에서 수익을 안정화하기 위해 필요하다.
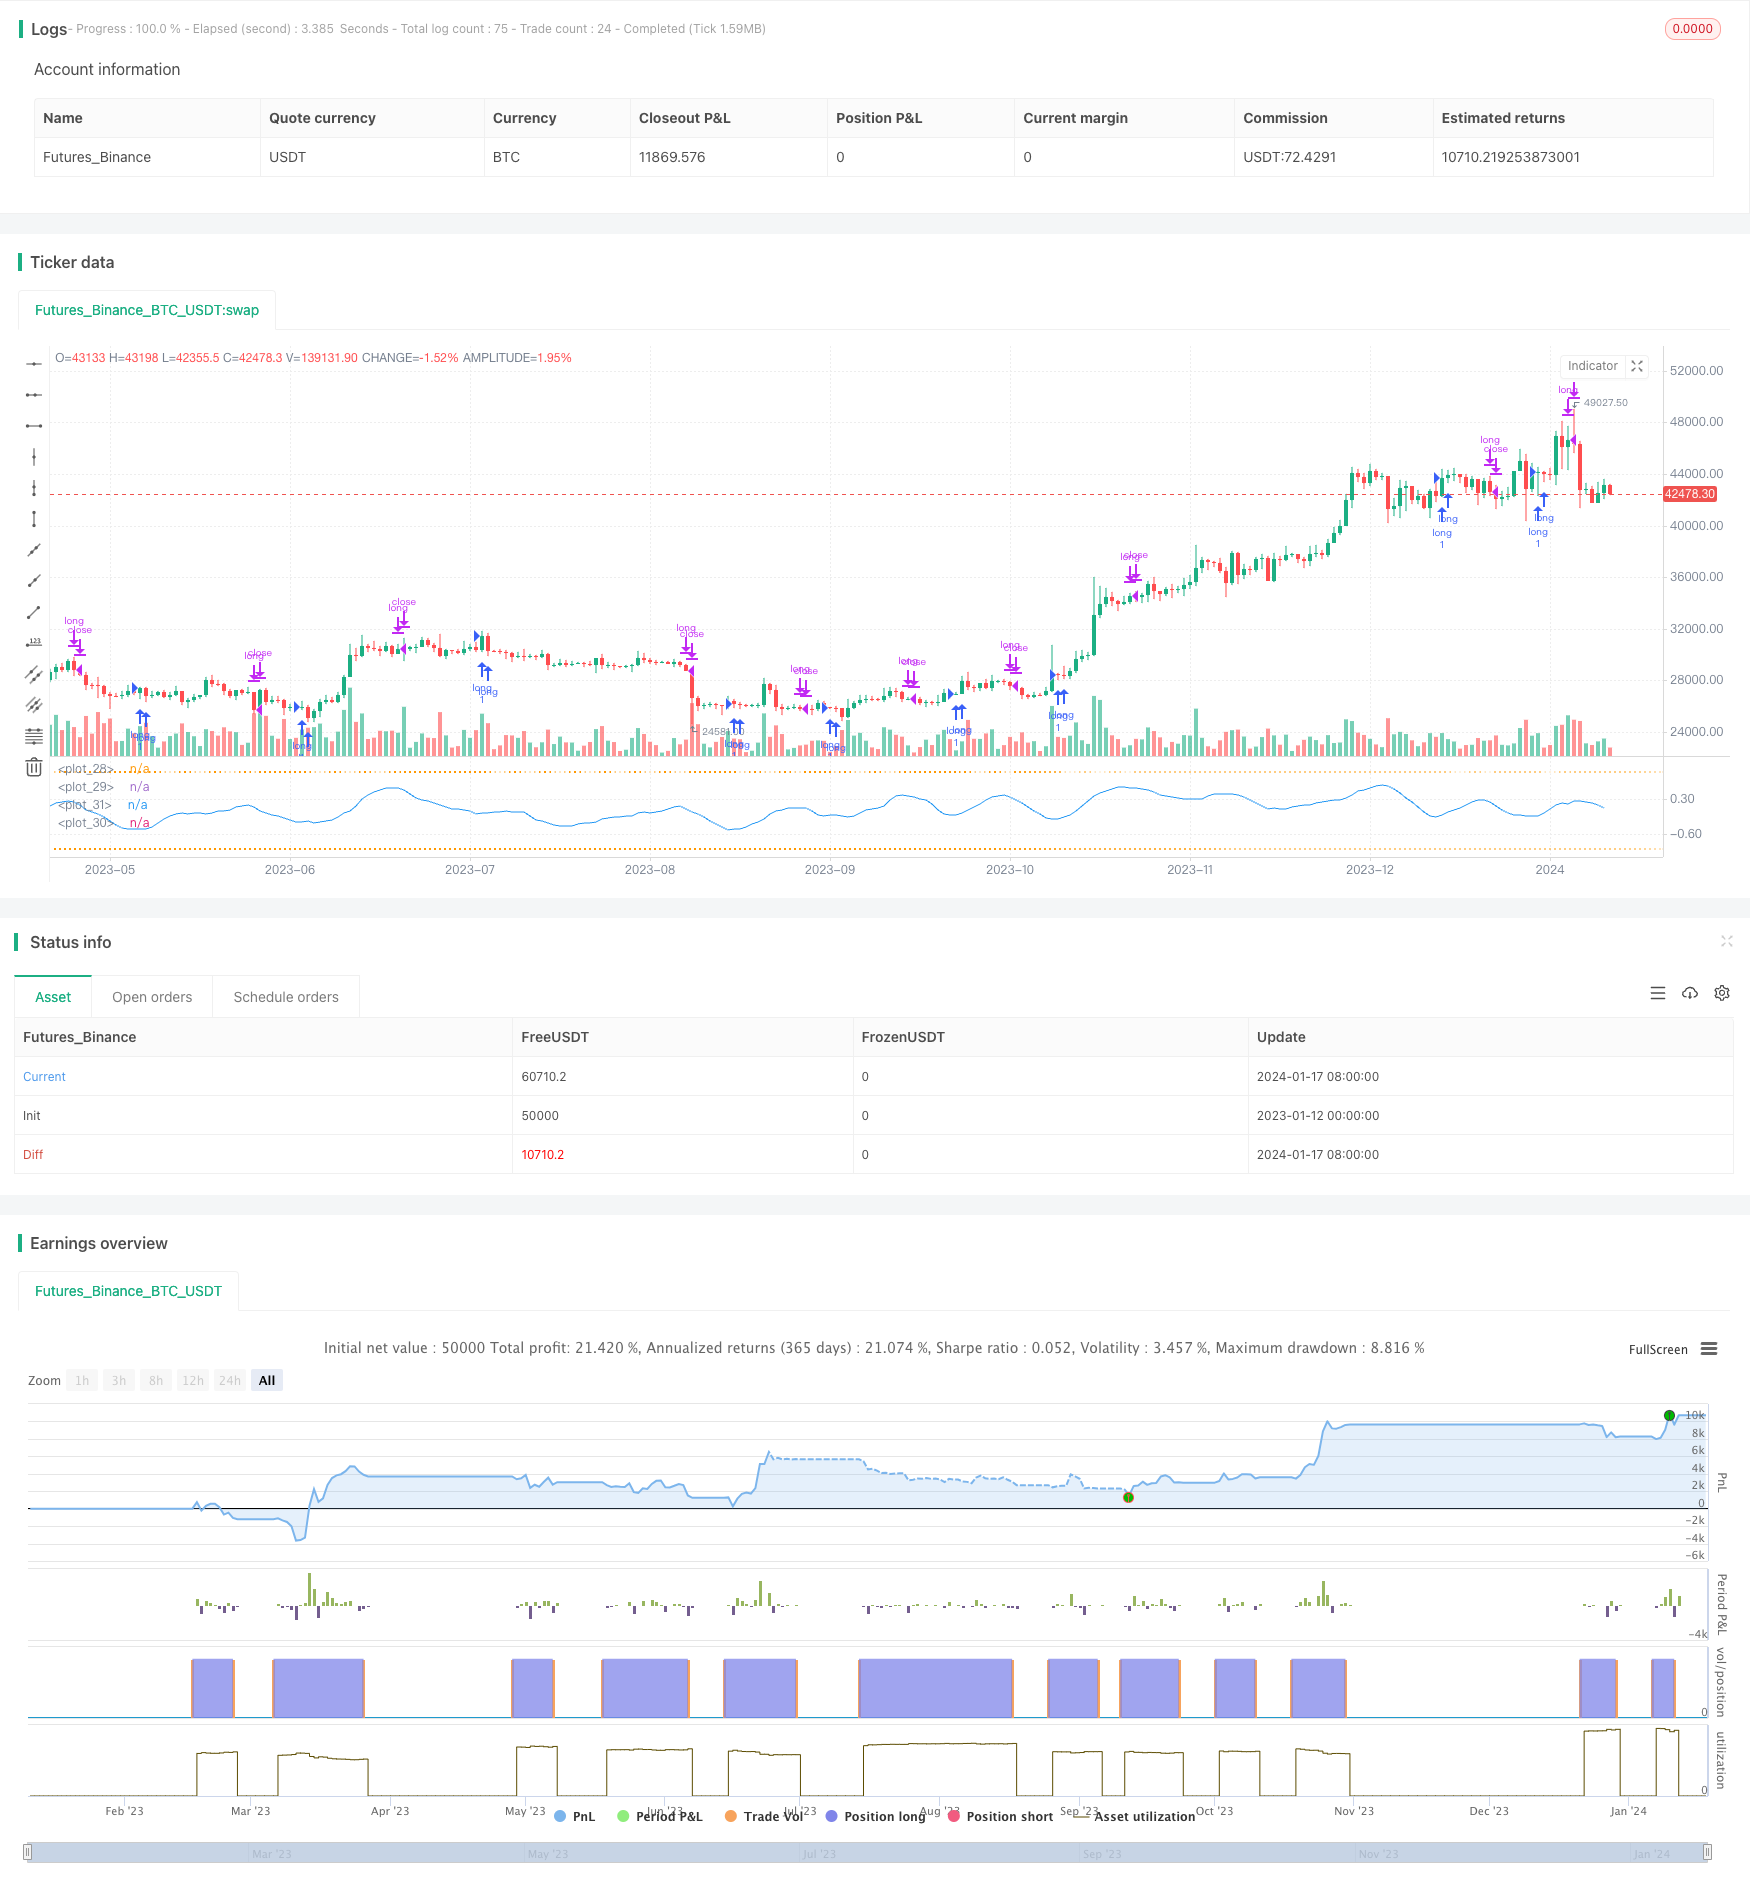
/*backtest
start: 2023-01-12 00:00:00
end: 2024-01-18 00:00:00
period: 1d
basePeriod: 1h
exchanges: [{"eid":"Futures_Binance","currency":"BTC_USDT"}]
*/

// **********************************************************************************************************
// This source code is subject to the terms of the Mozilla Public License 2.0 at https://mozilla.org/MPL/2.0/
// P-Signal Strategy © Kharevsky
// @version=4
// **********************************************************************************************************
strategy("P-Signal Strategy", precision = 3)
// Parameters and const of P-Signal.
nPoints = input(title = "Number of Bars", type = input.integer, defval = 9, minval = 4, maxval = 100, group = "Parameters of observation.")
int nIntr = nPoints - 1
// Horner's method for the error (Gauss) & P-Signal functions.
fErf(x) =>
    nT = 1.0/(1.0 + 0.5*abs(x))
    nAns = 1.0 - nT*exp(-x*x - 1.26551223 +
     nT*( 1.00002368 + nT*( 0.37409196 + nT*( 0.09678418 +
     nT*(-0.18628806 + nT*( 0.27886807 + nT*(-1.13520398 +
     nT*( 1.48851587 + nT*(-0.82215223 + nT*( 0.17087277 ))))))))))
    x >= 0 ? nAns : -nAns
fPSignal(ser, int) =>
    nStDev = stdev(ser, int)
    nSma = sma(ser, int)
    fErf(nStDev > 0 ? nSma/nStDev/sqrt(2) : 1.0)
// Strat.
float nPSignal = sma(fPSignal(change(ohlc4), nIntr), nIntr)
float ndPSignal = sign(nPSignal[0] - nPSignal[1])
strategy.entry("long", strategy.long, 1, when = nPSignal < 0 and ndPSignal > 0)
strategy.close("long", when = nPSignal > 0 and ndPSignal < 0)
// Plotting.
hline(+1.0, color = color.new(color.orange,70), linestyle = hline.style_dotted)
hline(-1.0, color = color.new(color.orange,70), linestyle = hline.style_dotted)
plot(nPSignal, color = color.blue, style = plot.style_line)
plot(strategy.position_size, color = color.white, style = plot.style_cross)
// Alerts.
if(strategy.position_size[0] > strategy.position_size[1])
    alert("P-Signal strategy opened the long position: " + syminfo.tickerid + " " + timeframe.period, alert.freq_once_per_bar)
if(strategy.position_size[0] < strategy.position_size[1])
    alert("P-Signal strategy closed the long position: " + syminfo.tickerid + " " + timeframe.period, alert.freq_once_per_bar)
// The end.