개요
이중 반전 진동대 트렌드 추적 전략은 이중 반전 신호와 진동대 지표를 결합하여 트렌드 추적 거래를 구현한다. 그것은 먼저 123 반전 시스템을 사용하여 반전 신호를 생성하고, 그 다음 Fractal Chaos Bands 지표 필터링 신호를 결합하여 트렌드 추적을 구현한다. 이 전략은 반전 기회를 식별하고 트렌드를 추적 할 수 있으며, 매우 포괄적인 거래 전략이다.
전략 원칙
123 회전 시스템
123 회전 시스템은 울프 센의 “나는 어떻게 선물 시장에서 3배의 수익을 얻는가”라는 책 183페이지의 내용에서 유래했다. 그것의 거래 신호는 다음과 같다:
2일 연속으로 종결 가격이 전날의 종결 가격보다 높고 9일 연속으로 슬로우 K 선이 50보다 낮으면 더 많은 돈을 벌고, 2일 연속으로 종결 가격이 전날의 종결 가격보다 낮고 9일 연속으로 패스트 K 선이 50보다 높으면 더 많은 돈을 벌고.
이 부분에서는 주로 스토카스틱 오실레이터 지표를 사용하여 과매매 영역에서 신호를 생성합니다. 주가가 지속적으로 상승하지만 스토카스틱 오실레이터 지표는 여전히 상승할 수 있는 공간이 더 많을 때, 보잉 전략을 취합니다. 주가가 지속적으로 하락하지만 스토카스틱 오실레이터 지표는 여전히 하락할 수 있는 공간이 더 많을 때, 하향 전략을 취합니다.
프랙탈 카오스 밴드
프랙탈 카오스 밴드 (Fractal Chaos Bands) 지표는 주식 가격의 최고점과 최저점을 그리며 상반도와 하반도를 형성하여 시장의 흐름을 판단한다. 구체적인 규칙은 다음과 같다.
가격 상승이 경로를 돌파할 때, 더 많이 하고, 가격이 하락이 경로를 돌파할 때, 더 적게 한다.
이 부분은 주로 트렌드 필터로 쓰이며, 123 역전 신호와 함께 사용된다. 두 신호가 일치할 때만 포지션이 열린다.
전략적 이점
- 역전과 트렌드를 결합하여 기회를 포괄적으로 포착합니다.
이중 반전 기동대 트렌드 추적 전략은 반전 기회를 잡을 수 있고, 트렌드를 추적할 수 있으며, 매우 포괄적입니다. 시장이 기동 상태 또는 트렌드 상태에서 거래 신호를 얻을 수 있습니다.
- 가짜 신호를 줄이고 승률을 높여라
단일 지표에 비해 이 전략은 이중 지표의 조합을 통해 필터링하여 가짜 신호를 크게 줄이고 실제 거래의 승률과 수익률을 높일 수 있습니다.
- 매개 변수 조정 유연성, 적응력
이중 반전 흔들림대 트렌드 추적 전략의 매개 변수는 잘 이해되며, 사용자는 자신의 필요와 시장 환경에 따라 조정할 수 있으며, 매우 유연하다. 흔들림 시장과 트렌드 시장 모두 매개 변수를 통해 조정할 수 있다.
위험과 최적화
- 큰 추세에 적응할 수 없습니다.
전략 자체는 중·단계 거래 기회에 더 의존한다. 큰 시장 추세에서 이 전략은 과도한 역전 신호를 생성하여 출전을 중단할 수 있다. 이것은 파라미터를 조정하여 최적화할 수 있다.
- 한자금 지원이 필요
이중 반전 오락대 트렌드 추적 전략은 빈번한 거래 유형이며, 포지션 보증금 수요를 지원하기 위해 충분한 마진 자금이 필요합니다. 자금이 부족한 사용자에게는 포지션을 적절히 축소해야 할 수 있습니다.
- 더 많은 지표 필터링이 가능합니다.
이 전략은 기존의 기반에 더 많은 다양한 유형의 지표를 도입하여 신호원을 풍부하게하고 전략의 안정성을 향상시킬 수 있습니다. 예를 들어 역전 및 트렌드 신호를 검사하기 위해 양력 지표, 변동률 지표 등을 추가합니다.
요약하다
이중 반전 진동带 트렌드 추적 전략은 반전 거래와 트렌드 추적의 장점을 성공적으로 결합하여 반전을 포착하고 트렌드를 따라갈 수 있으며 매우 포괄적이고 효율적입니다. 단일 지표에 비해 가짜 신호를 크게 줄여 실제 거래의 승률과 수익 수준을 향상시킬 수 있습니다. 또한, 이 전략의 매개 변수는 유연하게 조정되며 사용자는 자신의 스타일과 시장 환경에 따라 최적화 할 수 있습니다.
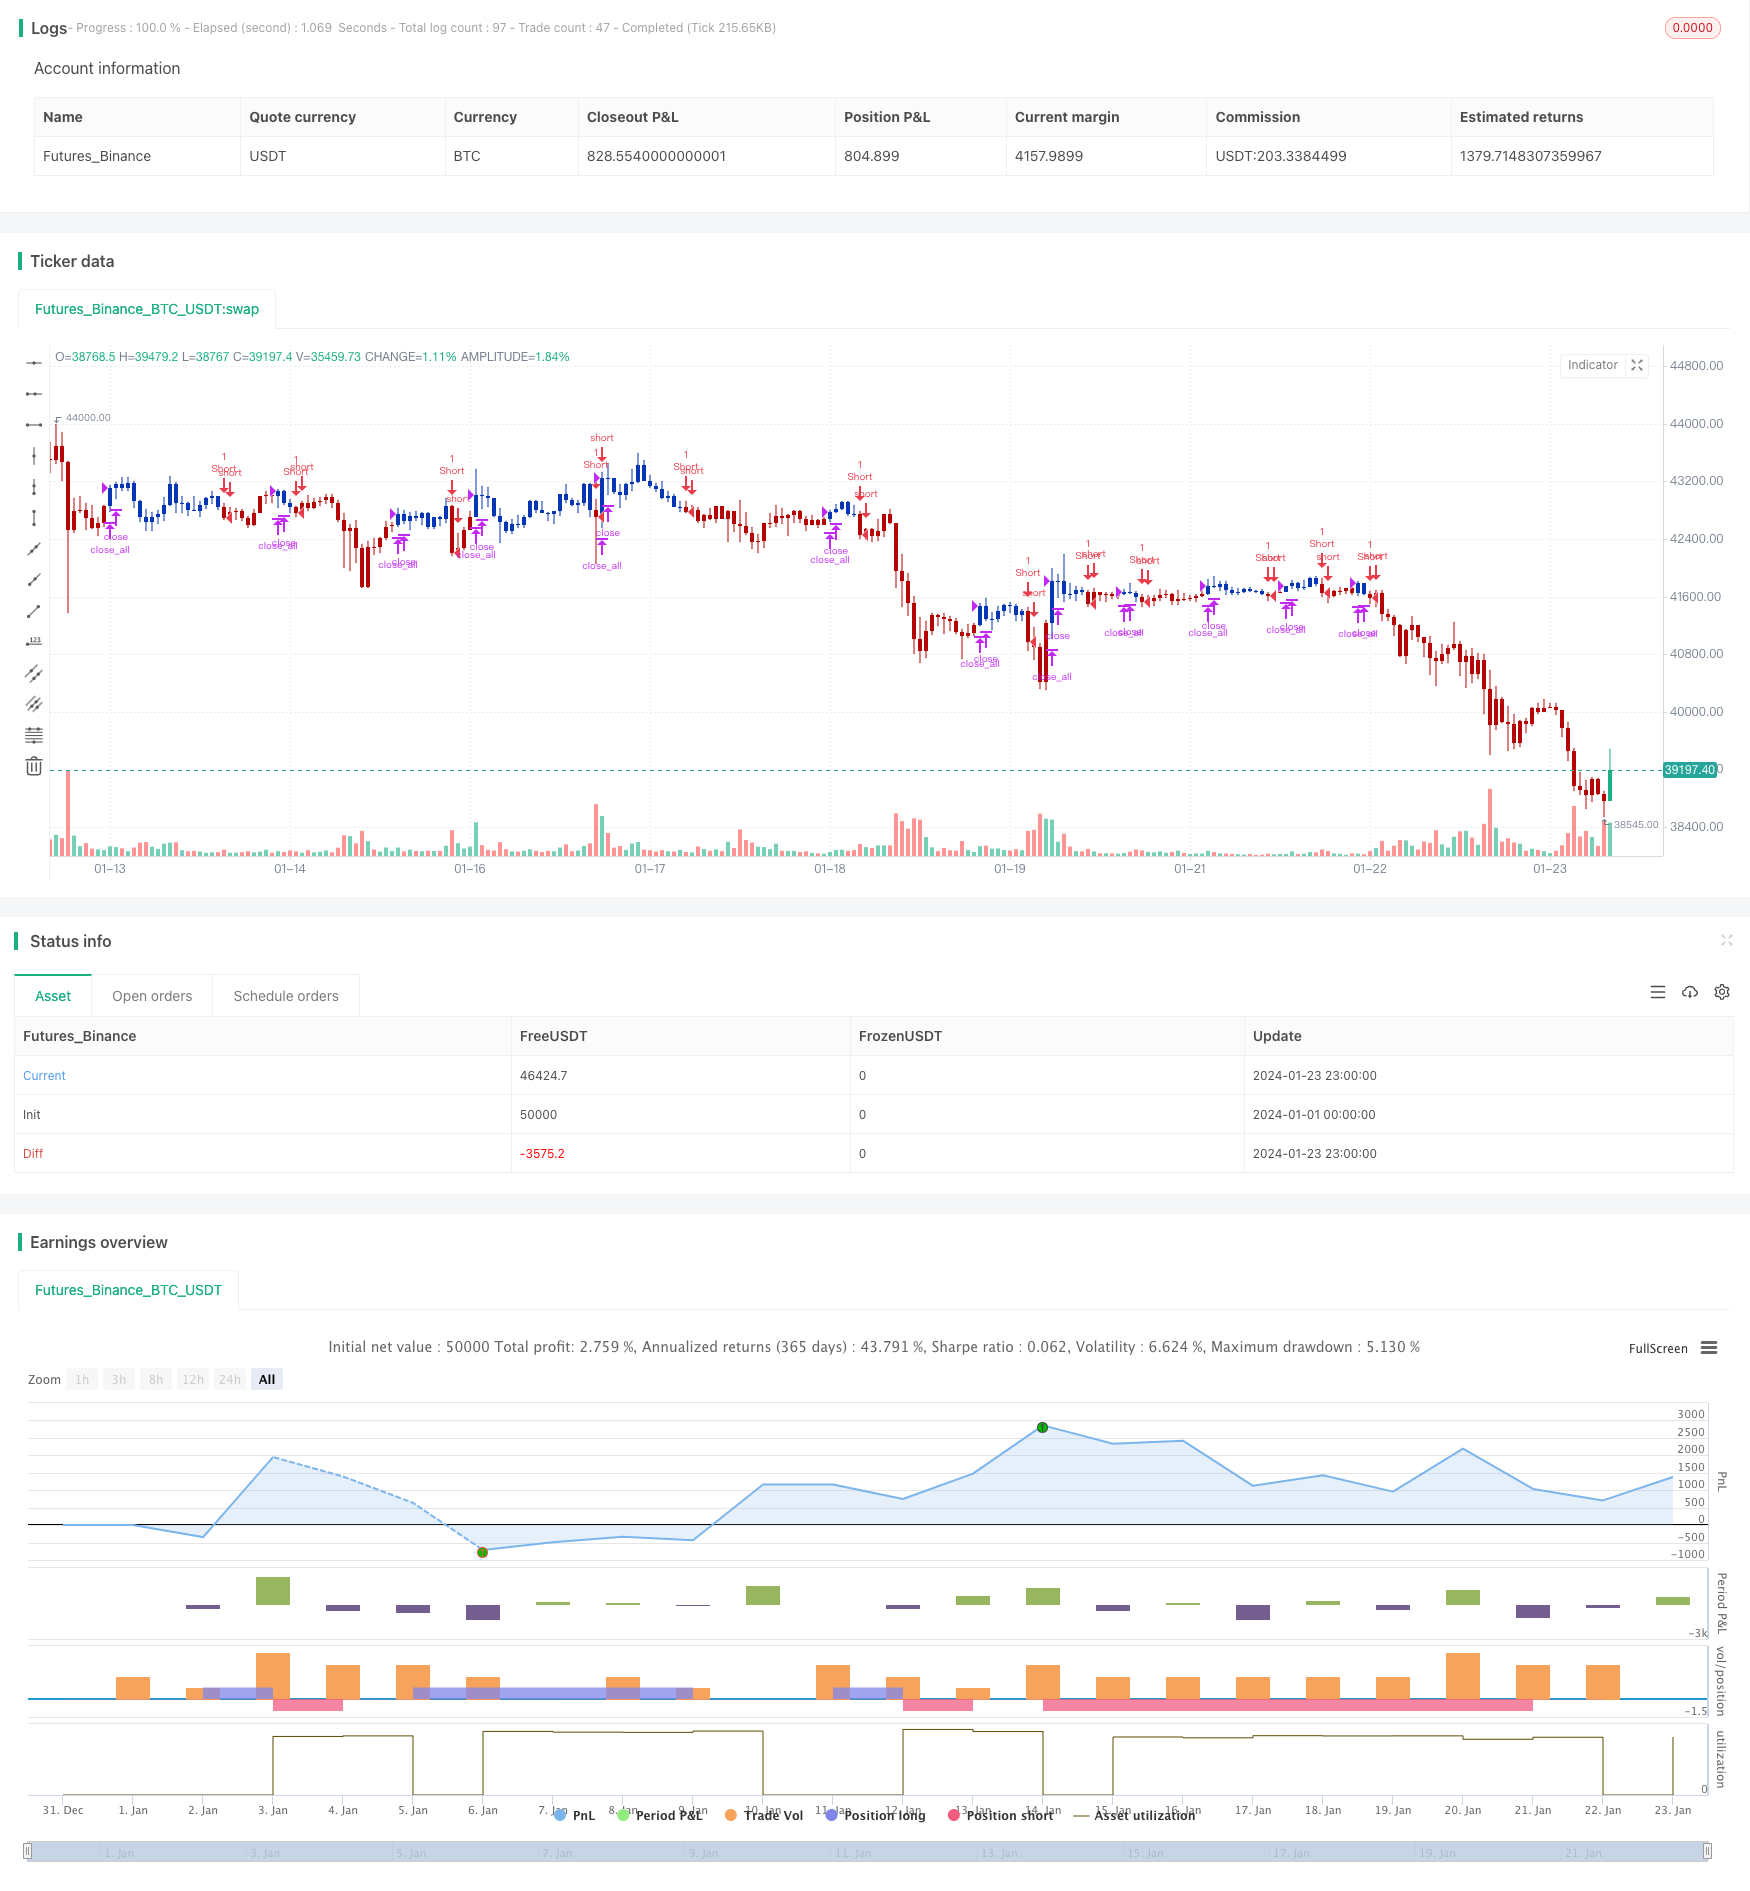
/*backtest
start: 2024-01-01 00:00:00
end: 2024-01-24 00:00:00
period: 1h
basePeriod: 15m
exchanges: [{"eid":"Futures_Binance","currency":"BTC_USDT"}]
*/

//@version=4
////////////////////////////////////////////////////////////
//  Copyright by HPotter v1.0 21/09/2020
// This is combo strategies for get a cumulative signal.
//
// First strategy
// This System was created from the Book "How I Tripled My Money In The
// Futures Market" by Ulf Jensen, Page 183. This is reverse type of strategies.
// The strategy buys at market, if close price is higher than the previous close
// during 2 days and the meaning of 9-days Stochastic Slow Oscillator is lower than 50.
// The strategy sells at market, if close price is lower than the previous close price
// during 2 days and the meaning of 9-days Stochastic Fast Oscillator is higher than 50.
//
// Second strategy
//  Stock market moves in a highly chaotic way, but at a larger scale, the movements
// follow a certain pattern that can be applied to shorter or longer periods of time
// and we can use Fractal Chaos Bands Indicator to identify those patterns. Basically,
// the Fractal Chaos Bands Indicator helps us to identify whether the stock market is
// trending or not. When a market is trending, the bands will have a slope and if market
// is not trending the bands will flatten out. As the slope of the bands decreases, it
// signifies that the market is choppy, insecure and variable. As the graph becomes more
// and more abrupt, be it going up or down, the significance is that the market becomes
// trendy, or stable. Fractal Chaos Bands Indicator is used similarly to other bands-indicator
// (Bollinger bands for instance), offering trading opportunities when price moves above or
// under the fractal lines.
//
// The FCB indicator looks back in time depending on the number of time periods trader selected
// to plot the indicator. The upper fractal line is made by plotting stock price highs and the
// lower fractal line is made by plotting stock price lows. Essentially, the Fractal Chaos Bands
// show an overall panorama of the price movement, as they filter out the insignificant fluctuations
// of the stock price.
//
// WARNING:
// - For purpose educate only
// - This script to change bars colors.
////////////////////////////////////////////////////////////
Reversal123(Length, KSmoothing, DLength, Level) =>
    vFast = sma(stoch(close, high, low, Length), KSmoothing)
    vSlow = sma(vFast, DLength)
    pos = 0.0
    pos := iff(close[2] < close[1] and close > close[1] and vFast < vSlow and vFast > Level, 1,
	         iff(close[2] > close[1] and close < close[1] and vFast > vSlow and vFast < Level, -1, nz(pos[1], 0)))
	pos

fractalUp(pattern) =>
    p = high[pattern+1]
    okl = 1
    okr = 1
    res = 0.0
	for i = pattern to 1
		okl := iff(high[i] < high[i+1] and okl == 1 , 1, 0)
	for i = pattern+2 to pattern*2+1
		okr := iff(high[i] < high[i-1] and okr == 1, 1, 0)
	res := iff(okl == 1 and okr == 1, p, res[1])
    res

fractalDn(pattern) =>
    p = low[pattern+1]
    okl = 1
    okr = 1
    res =0.0
	for i = pattern to 1
		okl := iff(low[i] > low[i+1] and okl == 1 , 1, 0)
	for i = pattern+2 to pattern*2+1
		okr := iff(low[i] > low[i-1] and okr == 1, 1, 0)
	res := iff(okl == 1 and okr == 1, p, res[1])
    res

FCB(Pattern) =>
    pos = 0.0
    xUpper = fractalUp(Pattern)
    xLower = fractalDn(Pattern)
    pos := iff(close > xUpper, 1,
             iff(close < xLower, -1, nz(pos[1], 0)))
    pos

strategy(title="Combo Backtest 123 Reversal & Fractal Chaos Bands", shorttitle="Combo", overlay = true)
Length = input(15, minval=1)
KSmoothing = input(1, minval=1)
DLength = input(3, minval=1)
Level = input(50, minval=1)
//-------------------------
Pattern = input(1, minval=1)
reverse = input(false, title="Trade reverse")
posReversal123 = Reversal123(Length, KSmoothing, DLength, Level)
posFCB = FCB(Pattern)
pos = iff(posReversal123 == 1 and posFCB == 1 , 1,
	   iff(posReversal123 == -1 and posFCB == -1, -1, 0))
possig = iff(reverse and pos == 1, -1,
          iff(reverse and pos == -1 , 1, pos))
if (possig == 1)
    strategy.entry("Long", strategy.long)
if (possig == -1)
    strategy.entry("Short", strategy.short)
if (possig == 0)
    strategy.close_all()
barcolor(possig == -1 ? #b50404: possig == 1 ? #079605 : #0536b3 )