이 글은 5EMA 지표에 기반한 단선 돌파 반전 거래 전략을 소개한다. 이 전략은 주로 5EMA 지표를 사용하여 가격 추세를 판단하고 가격이 EMA를 돌파했을 때 반전 거래를 한다.
전략 개요
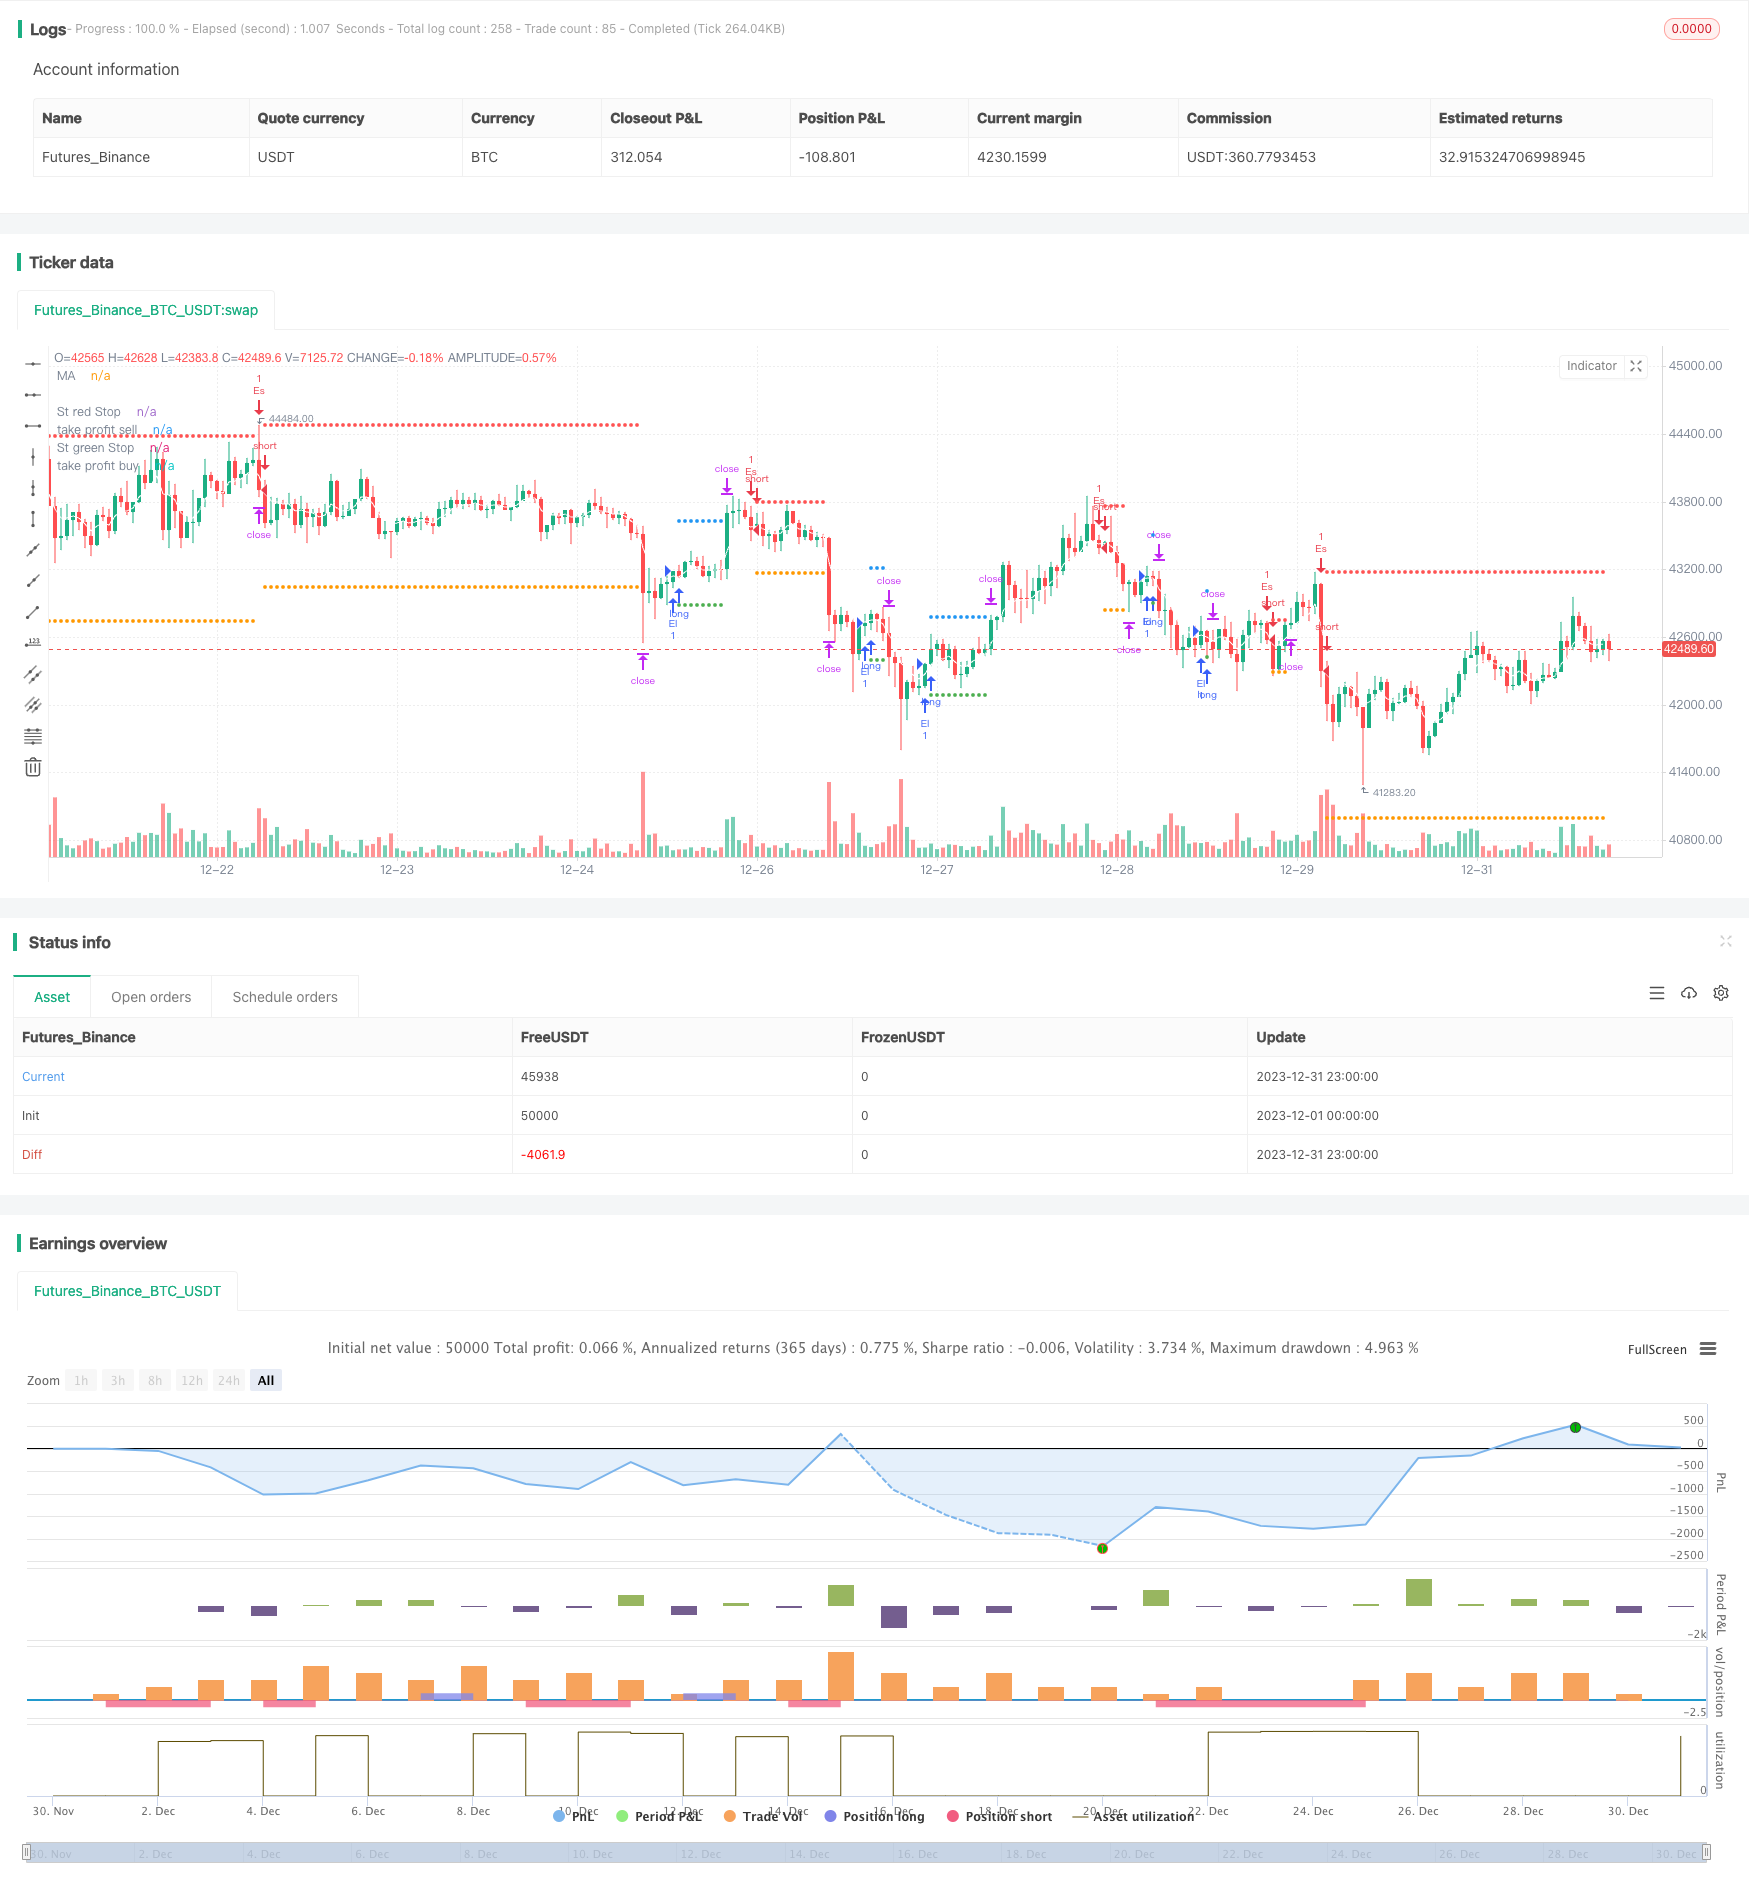
이 전략은 짧은 선의 양적 전략으로, 주로 고주파 거래에 사용된다. 전략은 동시에 상장과 상장 신호를 판단하며, 양방향 거래가 가능하다. 가격이 5EMA 지표를 돌파할 때 거래 신호를 생성하고, 돌파의 방향에 따라 상장 또는 상장 입장을 한다.
전략의 장점은 짧은 라인 가격 반전 기회를 포착하고 빠르게 진입하는 데 있습니다. 위험은 주로 가짜 돌파구로 인한 손실에서 비롯됩니다. 최적화 매개 변수를 통해 손실 위험을 줄일 수 있습니다.
전략 원칙
5주기 EMA 지표를 사용하여 가격 단기 경향을 판단
가격의 EMA 지표 돌파를 판단하는 방법
가격이 상향에서 하향으로 EMA를 돌파하면 판매 신호가 발생합니다.
가격이 아래에서 위로 EMA를 돌파할 때, 구매 신호가 생성됩니다.
단편 손실을 제한하는 스톱 및 스톱 포인트를 설정합니다.
EMA 지표가 단기 경향을 효과적으로 판단할 수 있기 때문에 가격이 명백하게 반전될 때 거래 기회를 신속하게 잡을 수 있다. 5EMA의 파라미터는 유연하고 시장에 신속하게 반응하여 고주파 거래에 적합하다.
전략적 이점
- 빠른 반응으로 고주파를 이용해 단선 거래 기회를 잡을 수 있습니다.
- 양방향 거래, 동시에 더 많은 공백이 가능합니다.
- 단독 손실이 제한되는 합리적인 상쇄장치
- 간단한 매개 변수 설정, 정책 최적화를 쉽게 수행
전략적 위험과 해결책
- 가짜 침입 위험으로 인해 불필요한 손실이 발생했습니다.
- EMA 주기 변수를 최적화하여 지표의 안정성을 보장합니다.
- 거래 빈도가 너무 높을 때, 거래가 급격히 증가할 수 있습니다.
- 하루 최대 거래 수 제한
전략 최적화 방향
- 최적의 주기 조합을 찾기 위해 EMA 지표 변수를 최적화합니다.
- 필터를 늘리고 가짜 돌파를 줄여라
- 하루 최대 거래 수 제한
- 다른 지표들과 함께 추세를 판단하는 방법
요약하다
이 전략은 전반적으로 매우 실용적인 단선 돌파 전략이다. EMA 지표를 사용하여 가격 반전을 판단하는 것은 매우 간단하고 효과적이며, 거래량을 측정하는 중요한 도구이다. 매개 변수 최적화 및 풍력 제어 설정을 통해 전략의 승률을 크게 높일 수 있으며, 권장된다.
/*backtest
start: 2023-12-01 00:00:00
end: 2023-12-31 23:59:59
period: 1h
basePeriod: 15m
exchanges: [{"eid":"Futures_Binance","currency":"BTC_USDT"}]
*/

// This Pine Script™ code is subject to the terms of the Mozilla Public License 2.0 at https://mozilla.org/MPL/2.0/
// © samscripter

//@version=5
strategy("5 ema strategy",overlay = true,process_orders_on_close = true)

// Choose trade direction

t_dir = input.string("Both", title="Trade Direction",options=["Long", "Short", "Both"],group = 'Trade Direction Set')

long_side  = t_dir == "Long" or t_dir == "Both"
short_side = t_dir == "Short" or t_dir == "Both"

// number of trade
mx_num =input.int(4,title = 'number Of trade',group = 'Maximum Number Of Trade')
var hi =0.0
var lo =0.0

var group_ma1="Ema Set"

//Ema 1
on_ma=input.bool(true,"Enable EMa 1 Plot On/Off"  ,group =group_ma1)
ma_len= input.int(5, minval=1, title="Ema Length",group =group_ma1)
ma_src = input.source(close, title="Ema Source"   ,group = group_ma1)
ma_out = ta.ema(ma_src, ma_len)

// buy and sell ema condition
plot(on_ma?ma_out:na, color=color.white, title="MA")


if close>ma_out and open>ma_out and low>ma_out and high>ma_out
    lo:=low

if close<ma_out and open<ma_out and low<ma_out and high<ma_out
    hi:=high

// condition when price is crossunder lo take sell and when price crossoing hi take buy
var buyp_sl =float(na)
var sellp_sl =float(na)

//count number trade since day stra
var count_buysell=0

if  close>hi[1]
    if strategy.position_size==0 and count_buysell<mx_num and long_side
        strategy.entry('El',strategy.long,comment = 'Long')
        count_buysell:=count_buysell+1
        buyp_sl:=math.min(low,low[1])
    hi:=na
if  close<lo[1]
    if strategy.position_size==0 and count_buysell<mx_num and short_side
        strategy.entry('Es',strategy.short,comment = 'short')
        count_buysell:=count_buysell+1
        sellp_sl:=math.max(high,high[1])
    lo:=na

//take profit multiply

tpnew = input.float(title="take profit", step=0.1, defval=1.5, group='Tp/SL')


//stop loss previous candle high and previous candle low
buy_sl = ta.valuewhen(strategy.position_size != 0 and strategy.position_size[1] == 0,buyp_sl , 0)
sell_sl= ta.valuewhen(strategy.position_size != 0 and strategy.position_size[1] == 0,sellp_sl, 0)

//take profit
takeProfit_buy = strategy.position_avg_price - ((buy_sl - strategy.position_avg_price) *tpnew)
takeProfit_sell = strategy.position_avg_price - ((sell_sl - strategy.position_avg_price) *tpnew)


//  Submit exit orders
if strategy.position_size > 0
    strategy.exit(id='XL', stop=buy_sl,limit=takeProfit_buy,comment_loss = 'Long Sl',comment_profit = 'Long Tp')

if strategy.position_size < 0
    strategy.exit(id='XS', stop=sell_sl,limit=takeProfit_sell,comment_loss = 'Short Sl',comment_profit = 'Short Tp')

//plot data
plot(series=strategy.position_size < 0 ?sell_sl : na, style=plot.style_circles, color=color.red, linewidth=2, title="St red Stop")
plot(series=strategy.position_size > 0 ?buy_sl  : na, style=plot.style_circles, color=color.green, linewidth=2, title="St green Stop")


// plot take profit
plot(series=strategy.position_size < 0 ? takeProfit_sell : na, style=plot.style_circles, color=color.orange, linewidth=2, title="take profit sell")
plot(series=strategy.position_size > 0 ? takeProfit_buy: na, style=plot.style_circles, color=color.blue, linewidth=2, title="take profit buy")

if ta.change(time('D'))
    count_buysell:=0