개요
이동 평균 이중 궤도 거래 전략은 쌍 이동 평균 교차 신호를 추적하는 트렌드 거래 전략이다. 이 전략은 지수 이동 평균 ((EMA) 와 중화 이동 평균 ((WMA) 를 동시에 거래 신호 지표로 사용합니다. 단기 EMA 상에서 장기 WMA를 통과하면 전략이 더 많이 하고, 단기 EMA 아래에서 장기 WMA를 통과하면 전략이 공백을 만든다.
전략 원칙
이 전략의 거래 신호 소스는 EMA 주기의 10의 단기 EMA와 WMA 주기의 20의 장기 WMA의 골드 포크 사다리이다. 단기 EMA 상에서 장기 WMA를 통과하면, 상향으로 전환하여 더 많은 것을 할 수 있으며, 단기 EMA 상에서 장기 WMA를 통과하면 상향으로 전환하여 공백을 할 수 있습니다.
전략은 먼저 거래 방향을 판단한 후, 입문 가격 아래 또는 위 1 ATR 주기의 거리를 세우는 스톱로스를 설정하고, 동시에 두 개의 스톱 포지션을 설정합니다. 첫 번째 스톱 포스는 입문 가격 위 또는 아래 1 ATR의 거리에 위치하고, 두 번째 스톱 포스는 입문 가격 위 또는 아래 2 ATR의 거리에 위치합니다. 첫 번째 스톱 포스가 촉발되면 나머지 포스는 두 번째 스톱 및 이동 스톱 방식으로 평정됩니다.
이동 스톱 로직은, 최고 가격 또는 최저 가격이 첫 번째 스톱 포지션을 만지면 활성화되기 시작하며, K 라인에 따라 실시간으로 갱신하여, 스톱 로지를 수익 최대 값과 입문 가격 사이에 이동하여 손실을 방지하고 수익을 잠금합니다.
장점
이 전략은 이동 평균의 이중 평준화 해소 기능을 활용하여, 거래상에서의 무작위적인 변동을 효과적으로 제거하고, 중장선의 트렌드 신호를 식별하여, 포착되는 것을 피한다. 동시에 두 개의 세트 스톱을 설정하는 것은 전략의 수익 범위를 증가시키고, 수익을 최대화한다. 이동 중지 메커니즘은 또한 전략이 수익을 절감할 수 있도록 한다.
위험
이동 평균 자체는 지연성이 강하며, 놓친 신호의 위험을 초래할 수 있습니다. 쌍 이동 평균 교차는 일부 시장에서 많은 가짜 신호를 생성하여 손실을 초래할 수 있습니다. 중지 손실 설정은 전략의 중요한 부분이며, 중지 손실이 너무 작으면 손실이 발생할 수 있으며, 중지 손실이 너무 크면 위험을 효과적으로 제어 할 수 없습니다.
또한, 시장이 급격하게 변동할 때, 이동 상쇄는 좋은 보호 역할을 하지 않을 수 있습니다.
최적화 방향
다양한 변수들의 EMA와 WMA를 테스트하여 최적의 변수 조합을 찾을 수 있다. 짧은 선의 EMA가 너무 짧거나 긴 선의 WMA가 너무 길다는 것은 전략의 성능에 영향을 줄 수 있다.
다양한 품종 특성과 거래 스타일에 따라 ATR 배수 또는 고정 점수 중지 손실을 선택할 수 있다.
부분 포지션 이동 손실과 전체 포지션 이동 손실의 효과를 테스트 할 수 있습니다.
다른 지표를 도입하여 필터링 신호를 판단할 수 있으며, EMA와 WMA를 보조하여 신호 품질을 향상시킬 수 있다.
요약하다
이동 평균 쌍방향 거래 전략은 전체적으로 안정적이며 추세 상황에서 더 잘 작동합니다. 매개 변수 최적화, 스톱 로즈 최적화 및 신호 품질을 향상시킴으로써 전략의 실장 성능을 더욱 향상시킬 수 있습니다. 이것은 깊이 연구하고 실장에 투자할 가치가있는 잠재적인 전략 아이디어입니다.
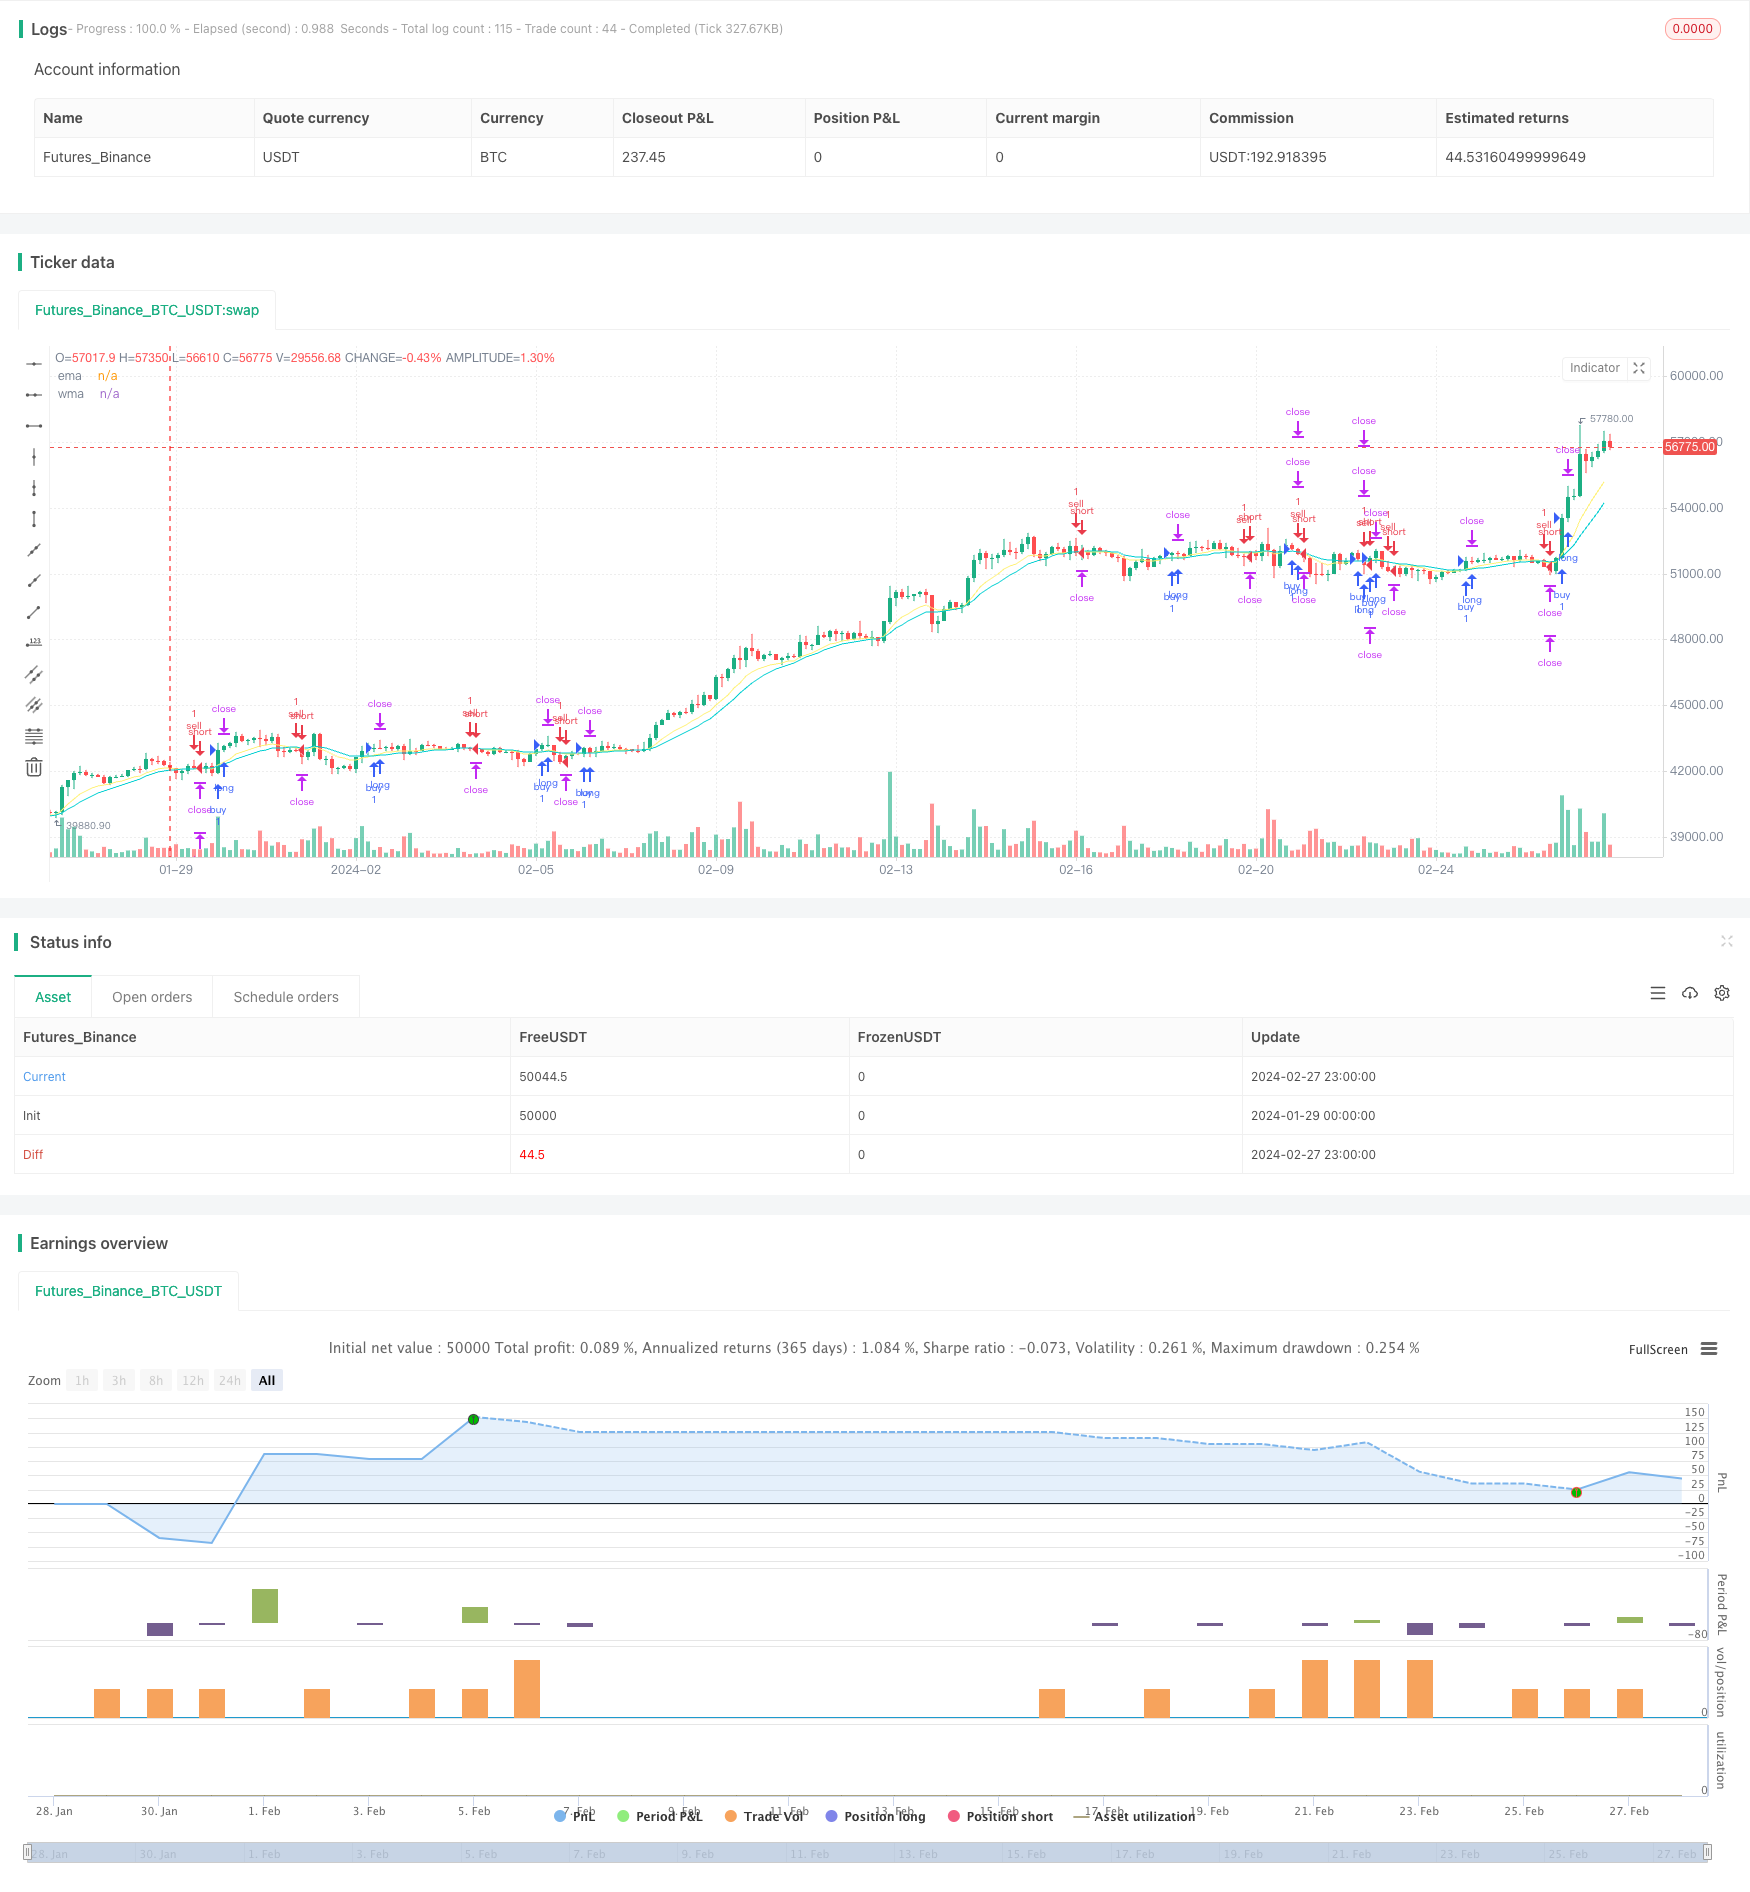
/*backtest
start: 2024-01-29 00:00:00
end: 2024-02-28 00:00:00
period: 3h
basePeriod: 15m
exchanges: [{"eid":"Futures_Binance","currency":"BTC_USDT"}]
*/

// This source code is subject to the terms of the Mozilla Public License 2.0 at https://mozilla.org/MPL/2.0/
// © gpadihar

//@version=4
strategy("SL1 Pips after TP1 (MA)", commission_type=strategy.commission.cash_per_order, overlay=true)

// Strategy
Buy  = input(true)
Sell = input(true)

// Date Range
start_year    = input(title='Start year'   ,defval=2020)
start_month   = input(title='Start month'  ,defval=1)
start_day     = input(title='Start day'    ,defval=1)
start_hour    = input(title='Start hour'   ,defval=0)
start_minute  = input(title='Start minute' ,defval=0)
end_time      = input(title='set end time?',defval=false)
end_year      = input(title='end year'     ,defval=3019)
end_month     = input(title='end month'    ,defval=12)
end_day       = input(title='end day'      ,defval=31)
end_hour      = input(title='end hour'     ,defval=23)
end_minute    = input(title='end minute'   ,defval=59)

// MA
ema_period = input(title='EMA period',defval=10)
wma_period = input(title='WMA period',defval=20)
ema        = ema(close,ema_period)
wma        = wma(close,wma_period)

// Entry Condition
buy =
 crossover(ema,wma) and
 nz(strategy.position_size) == 0 and Buy and
 time > timestamp(start_year, start_month, start_day, start_hour, start_minute) and
 (end_time?(time < timestamp(end_year, end_month, end_day, end_hour, end_minute)):true)

sell =
 crossunder(ema,wma) and
 nz(strategy.position_size) == 0 and Sell and
 time > timestamp(start_year, start_month, start_day, start_hour, start_minute) and
 (end_time?(time < timestamp(end_year, end_month, end_day, end_hour, end_minute)):true)

// Pips
pip = input(20)*10*syminfo.mintick

// Trading parameters //
var bool  LS  = na
var bool  SS  = na
var float EP  = na
var float TVL = na
var float TVS = na
var float TSL = na
var float TSS = na
var float TP1 = na
var float TP2 = na
var float SL1 = na
var float SL2 = na

if buy or sell and strategy.position_size == 0
    EP  := close
    SL1 := EP - pip     * (sell?-1:1)
    SL2 := EP - pip     * (sell?-1:1)
    TP1 := EP + pip     * (sell?-1:1)
    TP2 := EP + pip * 2 * (sell?-1:1)

// current trade direction
LS := buy  or strategy.position_size > 0
SS := sell or strategy.position_size < 0

// adjust trade parameters and trailing stop calculations
TVL := max(TP1,open) - pip[1]
TVS := min(TP1,open) + pip[1]
TSL := open[1] > TSL[1] ? max(TVL,TSL[1]):TVL
TSS := open[1] < TSS[1] ? min(TVS,TSS[1]):TVS

if LS and high > TP1
    if open <= TP1
        SL2:=min(EP,TSL)

if SS and low < TP1
    if open >= TP1
        SL2:=max(EP,TSS)

// Closing conditions
close_long  = LS and open < SL2
close_short = SS and open > SL2

// Buy
strategy.entry("buy"  , strategy.long, when=buy and not SS)
strategy.exit ("exit1", from_entry="buy", stop=SL1, limit=TP1, qty_percent=50)
strategy.exit ("exit2", from_entry="buy", stop=SL2, limit=TP2)

// Sell
strategy.entry("sell" , strategy.short, when=sell and not LS)
strategy.exit ("exit3", from_entry="sell", stop=SL1, limit=TP1, qty_percent=50)
strategy.exit ("exit4", from_entry="sell", stop=SL2, limit=TP2)

// Plots
a=plot(strategy.position_size >  0 ? SL1 : na, color=#dc143c, style=plot.style_linebr)
b=plot(strategy.position_size <  0 ? SL1 : na, color=#dc143c, style=plot.style_linebr)
c=plot(strategy.position_size >  0 ? TP1 : na, color=#00ced1, style=plot.style_linebr)
d=plot(strategy.position_size <  0 ? TP1 : na, color=#00ced1, style=plot.style_linebr)
e=plot(strategy.position_size >  0 ? TP2 : na, color=#00ced1, style=plot.style_linebr)
f=plot(strategy.position_size <  0 ? TP2 : na, color=#00ced1, style=plot.style_linebr)
g=plot(strategy.position_size >= 0 ? na  : EP, color=#ffffff, style=plot.style_linebr)
h=plot(strategy.position_size <= 0 ? na  : EP, color=#ffffff, style=plot.style_linebr)

plot(ema,title="ema",color=#fff176)
plot(wma,title="wma",color=#00ced1)