개요
이 전략은 브린 밴드 지표와 상대적으로 약한 지수 RSI 지표를 조합하여 거래 신호를 생성합니다. K 선의 세 개의 종결 가격이 동시에 경로를 돌파하거나 경로를 돌파하는지 모니터링하고, 기어 지표와 RSI 지표와 결합하여 거래 신호를 확인합니다.
전략 원칙
이 전략은 다음과 같은 원칙에 기초하고 있습니다.
- 20 길이의 브린 밴드를 사용 하 여, 가격 근결이 상반 또는 하반을 돌파 할 때 거래 신호를 발송하는 것을 고려하십시오.
- 3개의 K선 종결값을 동시에 돌파하도록 요구하고, 가짜 돌파를 피합니다.
- 기어 지표와 결합하여, 강력한 초매할 때 VIP>1.25, 강력한 초매할 때 VIM>1.25, 필터 신호
- RSI와 결합하여 과매매를 판단합니다. RSI가 70을 넘으면 공백을 고려하고, RSI가 30을 넘으면 추가로 고려합니다.
- 위의 조건이 충족되면 더 많은 또는 빈 신호를 생성합니다.
우위 분석
이 전략은 다음과 같은 장점을 가지고 있습니다.
- 트리플 BB bands 필터 가짜 돌파, 돌파의 신뢰성을 보장
- 기어 지표는 시장의 강점을 판단하여 불리한 거래를 피합니다.
- RSI 지표가 오버 바이 오버 소드 영역을 판단하고, 부린 띠 지표와 결합하여 진입
- 다양한 지표 조합, 시장 상황을 종합적으로 판단, 신호 신뢰도가 높다
위험 분석
이 전략에는 몇 가지 위험도 있습니다.
- 브린 벨트 지표는 변수에 민감하여 길이와 StdDev 배수를 최적화해야 합니다.
- 기어 지표는 주기적 변수에도 민감하며 시장에 따라 조정해야 합니다.
- RSI 지표는 변동이 쉽고 추세를 놓칠 수도 있습니다.
- 만약 3가지 지표에 대해 의견이 엇갈린다면, 출전할 수 없고, 일부 기회를 놓칠 수 있습니다.
위험 관리에는 다음과 같은 것들이 포함됩니다.
- 최적화 변수, tested 가장 높은 승률의 변수
- 거래량 필터링과 같은 다른 지표와 함께
- 지표 판단 논리를 적절히 풀어 놓는 것, 기회를 놓치지 않는 것
최적화 방향
이 전략은 다음과 같은 부분에서 최적화될 수 있습니다.
- 브린 밴드 지표의 길이와 StdDev 배수를 최적화하여 최적의 변수를 찾습니다.
- 기어 지표의 주기를 최적화하여 다른 시장에 더 적합하게 만듭니다.
- 거래량, MACD 등과 같은 다른 지표 판단을 추가하여 다양한 신호를 풍부하게합니다.
- 지표 판단 논리를 조정하여 지표의 불일치로 인해 입학이 불가능하도록 방지합니다.
- 단일 거래의 최대 손실을 제어하기 위해 손실을 막는 전략을 추가합니다.
요약하다
이 전략은 여러 지표를 종합적으로 사용하여 판단하고, 신호 신뢰성을 보장하면서도 문제가 있습니다. 파라미터 최적화, 신호 소스 풍요화, 판단 논리를 조정하고, 손실을 막는 등의 수단으로 전략의 안정성과 수익성을 더욱 강화할 수 있습니다.
전략 소스 코드
/*backtest
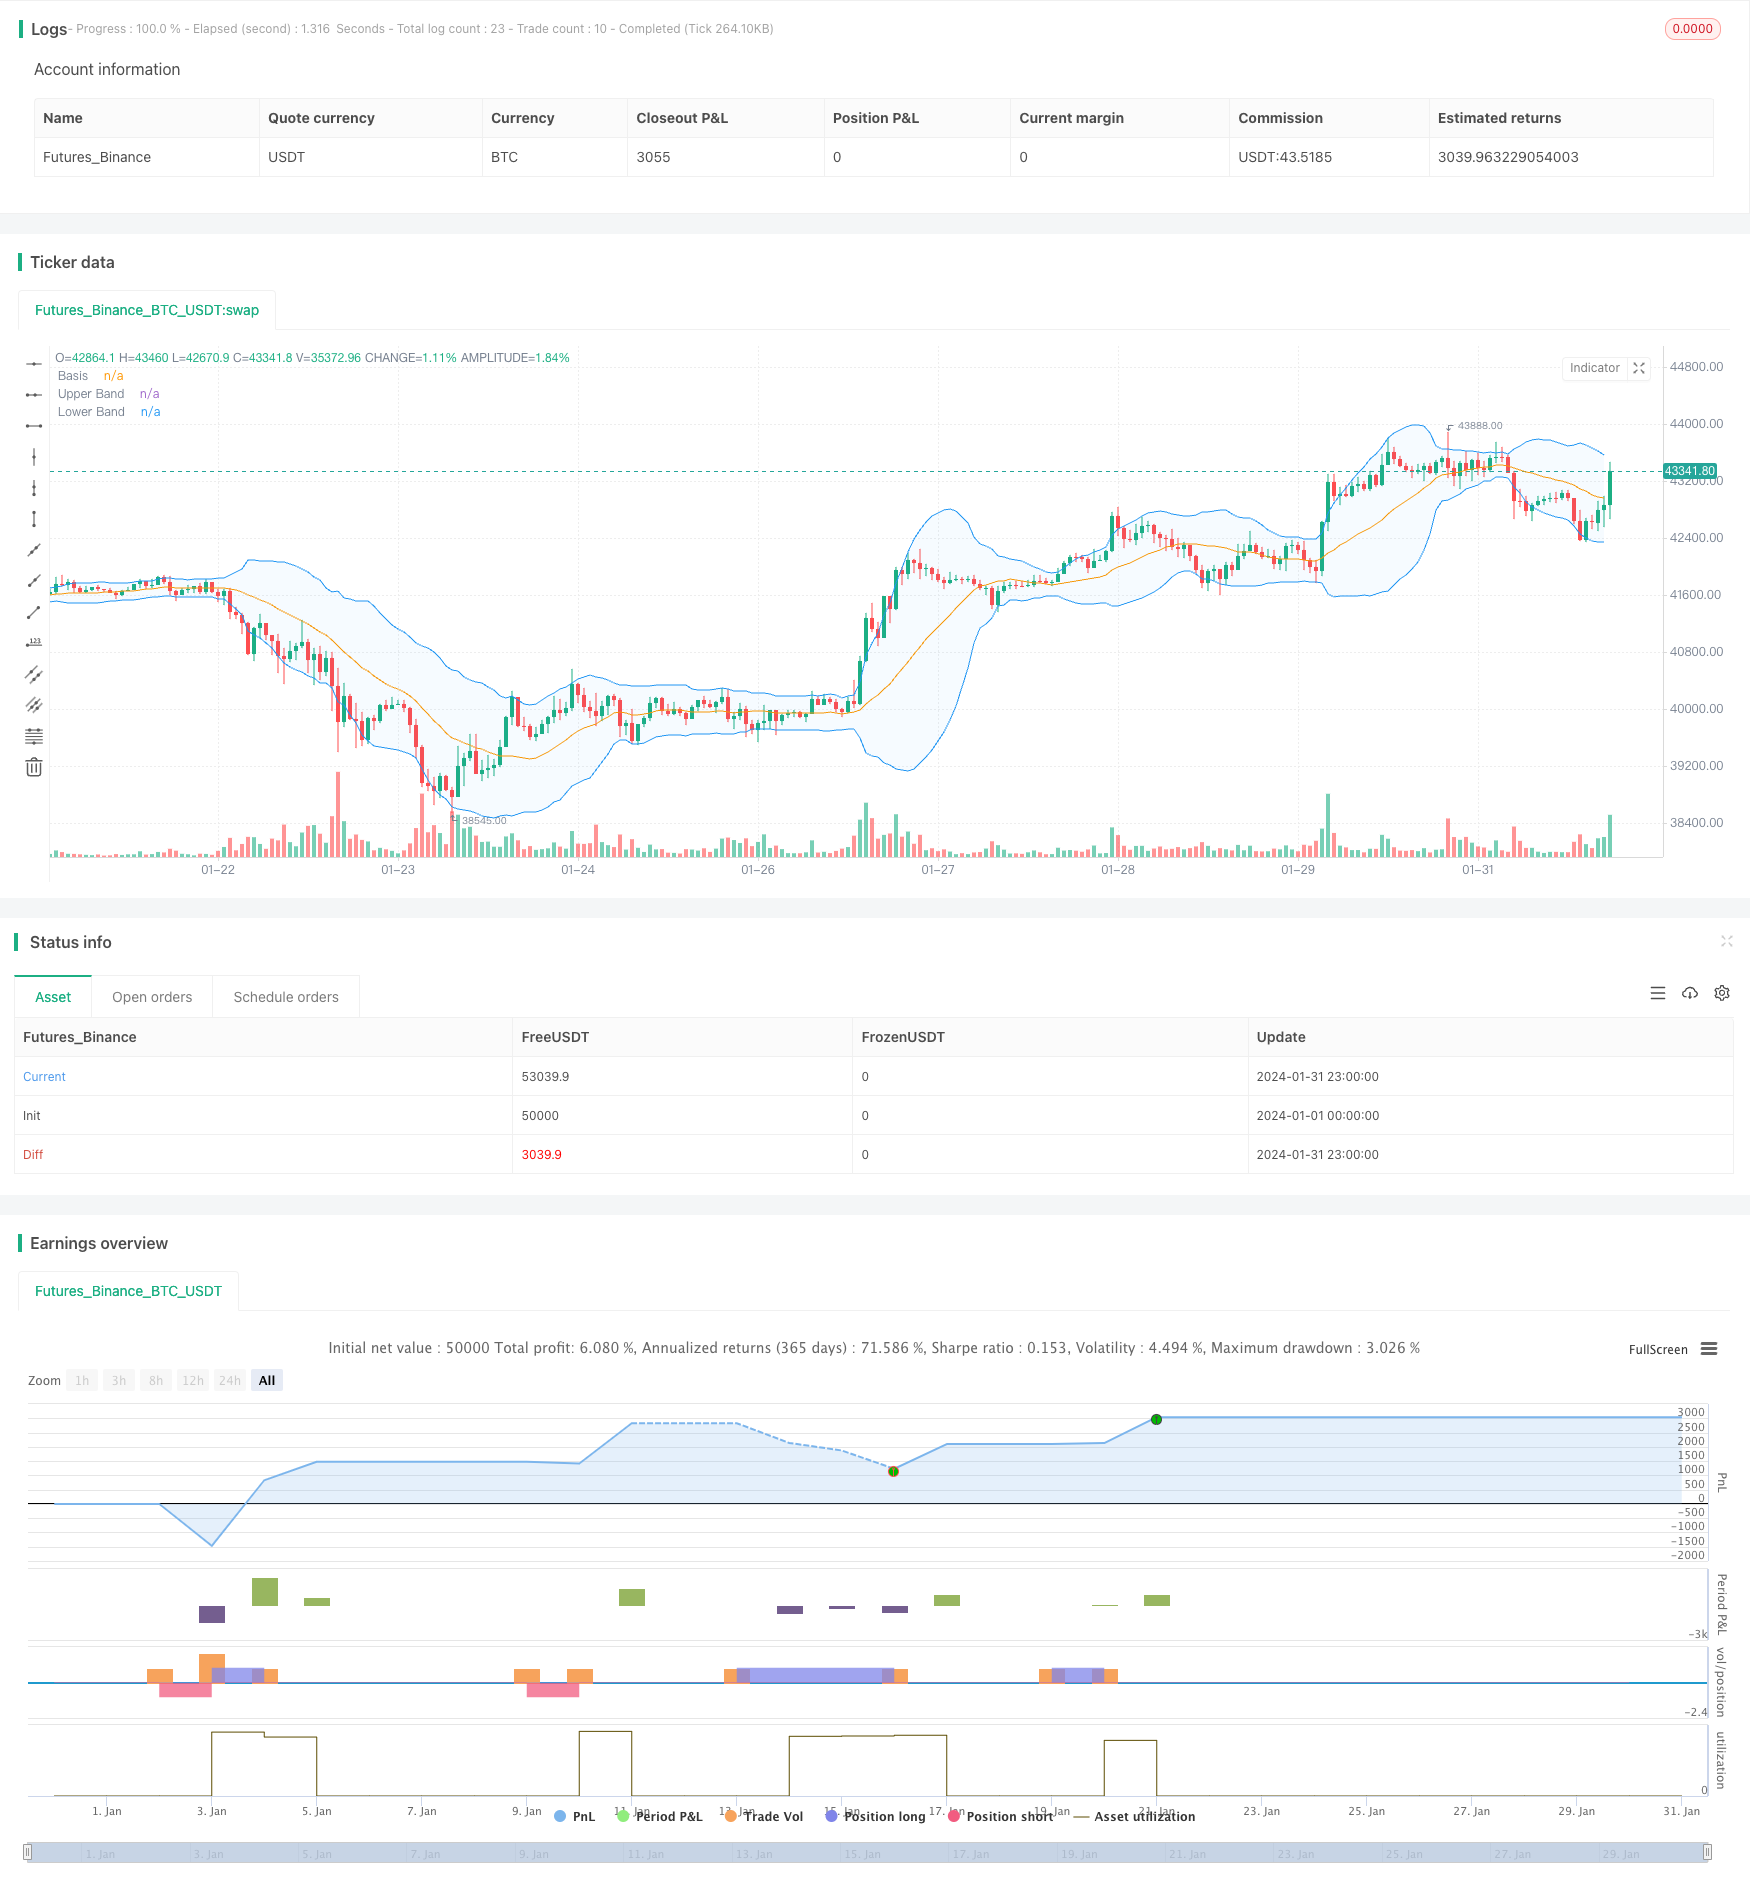
start: 2024-01-01 00:00:00
end: 2024-01-31 23:59:59
period: 1h
basePeriod: 15m
exchanges: [{"eid":"Futures_Binance","currency":"BTC_USDT"}]
*/
// This Pine Script™ code is subject to the terms of the Mozilla Public License 2.0 at https://mozilla.org/MPL/2.0/
// © Noway0utstorm
//@version=5
strategy(title='RSI + BB over 3 bar+--- vortex0.71.3 ', shorttitle='NoWaytruongphuthinh', format=format.price, precision=4,overlay = true)
length = input(20, title="Length")
mult = input(2.0, title="Multiplier")
source = close
basis = ta.sma(source, length)
dev = mult * ta.stdev(source, length)
upperBand = basis + dev
lowerBand = basis - dev
isClosedBar = ta.change(time("15"))
var bool closeAboveUpperBand = false
var bool closeBelowLowerBand = false
// Vortex Indicator Settings
period_ = input.int(14, title='Period', minval=2)
VMP = math.sum(math.abs(high - low[1]), period_)
VMM = math.sum(math.abs(low - high[1]), period_)
STR = math.sum(ta.atr(1), period_)
VIP = VMP / STR
VIM = VMM / STR
//
lengthrsi = input(14, title="RSI Length")
overboughtLevel = input(70, title="Overbought Level")
oversoldLevel = input(30, title="Oversold Level")
sourcersi = close
rsiValue = ta.rsi(sourcersi, lengthrsi)
shouldShort = rsiValue > overboughtLevel
shouldLong = rsiValue < oversoldLevel
if bool(isClosedBar[1]) and bool(isClosedBar[2]) and bool(isClosedBar[3])
if close[1] > upperBand[1] and close[2] > upperBand[2] and close[3] > upperBand[3] and VIP > 1.25 and VIM < 0.7 and rsiValue > overboughtLevel
strategy.entry("Short", strategy.short)
closeAboveUpperBand := false // Reset the condition when entering a new Short position
if close[1] < lowerBand[1] and close[2] < lowerBand[2] and close[3] < lowerBand[3] and VIP < 0.7 and VIM > 1.25 and rsiValue < oversoldLevel
strategy.entry("Long", strategy.long)
closeBelowLowerBand := false // Reset the condition when entering a new Long position
if strategy.position_size > 0 // Check if there is an open Long position
closeAboveUpperBand := close > upperBand // Update the condition based on close price
if closeAboveUpperBand
strategy.close("Long",disable_alert=true) // Close the Long position if close price is above upper band
if strategy.position_size < 0 // Check if there is an open Short position
closeBelowLowerBand := close < lowerBand // Update the condition based on close price
if closeBelowLowerBand
strategy.close("Short",disable_alert=true) // Close the Short position if close price is below lower band
// Plots
plot(basis, color=color.orange, title="Basis")
p1 = plot(upperBand, color=color.blue, title="Upper Band")
p2 = plot(lowerBand, color=color.blue, title="Lower Band")
fill(p1, p2, title = "Background", color=color.rgb(33, 150, 243, 95))