개요
이 글은 주로 Ravikant_sharma가 개발한 다중 지수 이동 평균 (EMA) 과 상대적으로 강한 지수 (RSI) 를 기반으로 한 정량 거래 전략을 분석합니다. 이 전략은 EMA의 다른 주기와 RSI의 수치를 통해 판단하여 가격 추세를 식별하고 진입 및 출퇴근 시간을 결정합니다.
전략 원칙
지표 계산
전략은 9일선, 21일선, 51일선, 100일선, 200일선 등 5개의 다른 주기적인 EMA를 사용한다. 코드에서는 처음 4개의 EMA만 그려져 있다. RSI 파라미트는 14로 설정되어 있다.
입학 조건
다음의 조건 중 하나만 충족하면 전략적으로 더 많은 돈을 벌 수 있습니다.
- 9일 EMA에 21일 EMA를 입는다
- 9일 EMA에 51일 EMA를 입는다
- 51일 EMA 아래 100일 EMA
RSI가 65보다 높으면 상승세를 나타냅니다.
출전 조건
다음의 조건 중 하나만 충족하면 전략 평지출퇴:
- 9일 EMA 아래 51일 EMA를 넘어서 추세가 뒤집어졌음을 나타냅니다.
- 입시 가격의 125%를 초과한 종식 가격, 수익 목표에 도달
- RSI 값이 40보다 낮으면 반전 신호가 나타납니다.
- 입시 가격보다 98% 낮게 매각
우위 분석
이것은 전형적인 트렌드 추적 전략으로 다음과 같은 장점이 있습니다.
- EMA를 사용하여 트렌드 방향을 판단하여 가격 트렌드를 효과적으로 추적할 수 있습니다.
- 다른 주기의 EMA와 결합하여 더 신뢰할 수 있는 트렌드 신호를 식별할 수 있습니다.
- RSI 필터는 흔들림 상황에서 잘못된 신호를 방지합니다.
- 스톱포드 스톱손실 위치를 설정하여 수익을 고정하고 위험을 제어합니다.
위험과 해결방안 분석
이 전략에는 몇 가지 위험도 있습니다.
- 불안정한 상황에서는 여러 번의 불확실성 신호가 발생할 수 있으며, 이는 너무 자주 거래되는 결과를 초래합니다. EMA 주기 파라미터를 적절하게 조정하거나 RSI 필터 조건을 추가 할 수 있습니다.
- 상황이 급격히 역전될 때, EMA 교차 신호는 지연될 수 있으며, 제 시간에 중지할 수 없다. 다른 지표와 결합하여 더 많은 일을 하고 하락 신호의 강도를 판단할 수 있다.
- 수익 목표와 중지 손실 범위가 부적절하게 설정되어 조기 중단 또는 미시 중단이 발생할 수 있습니다. 다양한 품종 특성과 시장 환경에 따라 최적화해야 합니다.
전략 최적화 방향
이 전략은 다음과 같은 방향으로 최적화될 수 있습니다.
- 거래 품종에 대한 변수 최적화를 추가하고, 다른 품종에 대한 최적의 변수 조합을 설정합니다.
- KDJ, MACD 등과 같은 다른 지표 판단을 추가하여 다인자 모델을 형성합니다.
- 기계 학습 풍력 제어 방법을 추가하여 모형을 사용하여 신호 품질을 판단하여 잘못된 판단의 가능성을 줄입니다.
- 감정적 분석과 함께 극단적인 감정에 의해 잘못된 거래가 발생하지 않도록하십시오.
- 다른 스톱 스톱 손실 전략을 테스트하여 최적의 변수를 찾아보십시오.
요약하다
이 전략은 전체적으로 신뢰할 수 있고, 실행하기 쉬운 트렌드 추적 전략이다. 그것은 EMA를 다주기 교차하여 트렌드 방향을 결정하고, RSI 필터링 가짜 신호와 결합하여, 재측량 효과의 좋은 기반에 파라미터 최적화 및 모델 최적화를 수행하고, 안정적인 수익을 얻을 수 있다. 그러나 거래자는 사용 할 때, 여전히 경계해야한다.
전략 소스 코드
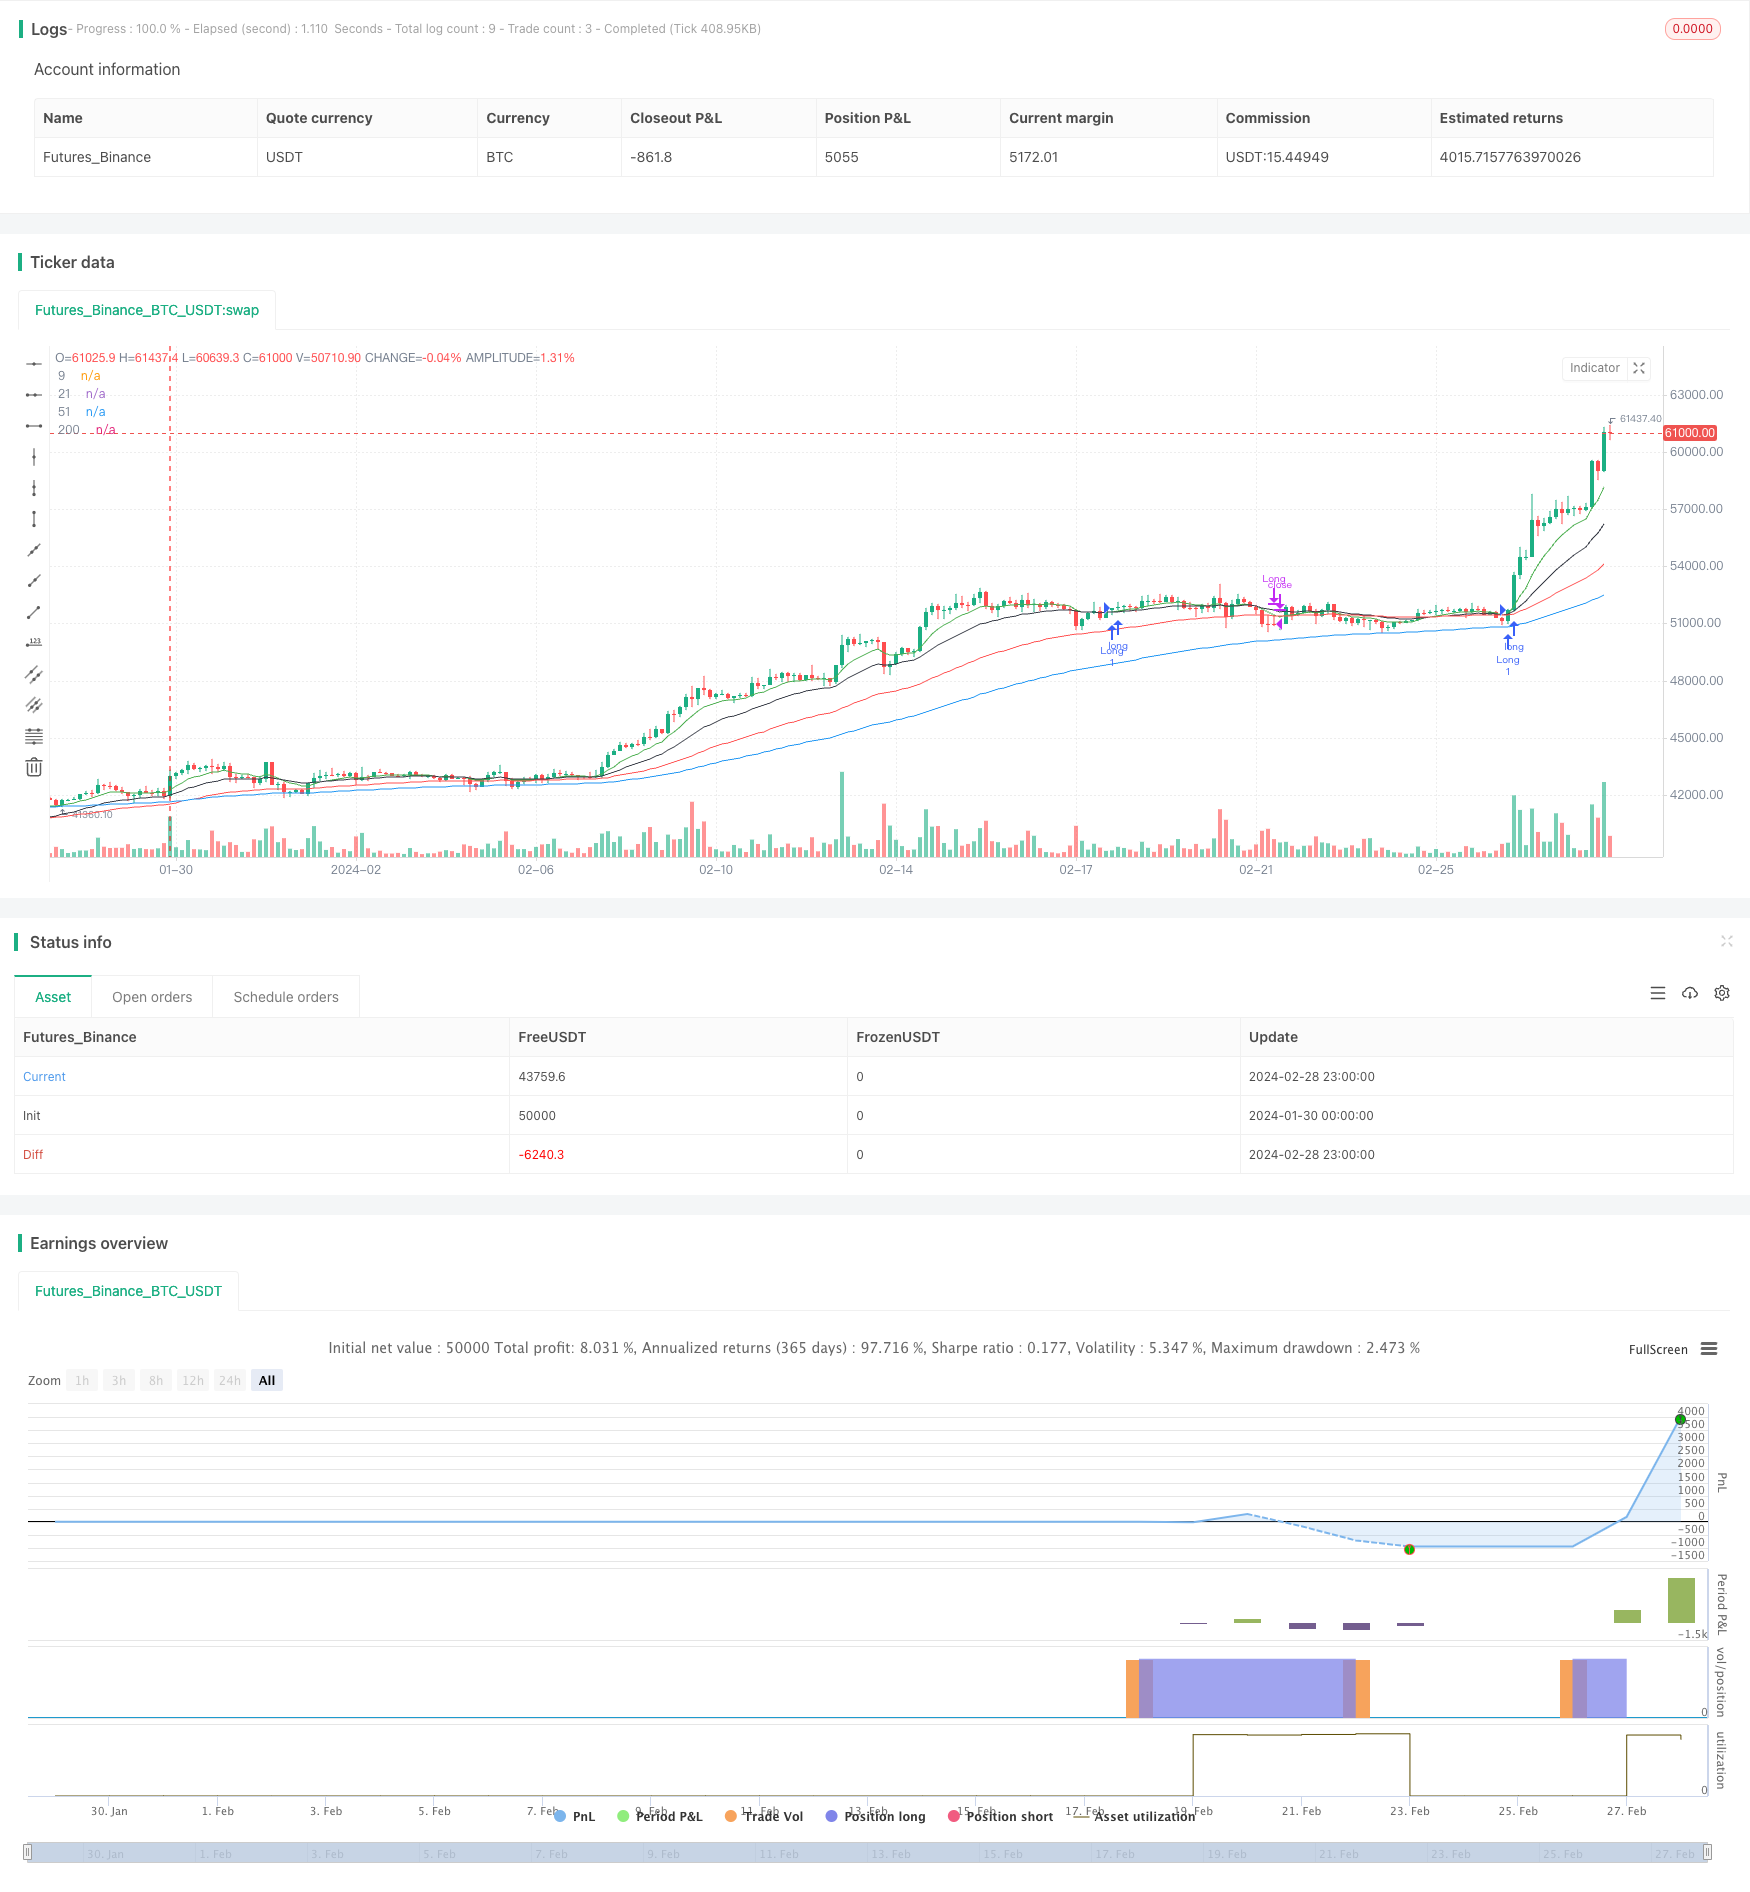
/*backtest
start: 2024-01-30 00:00:00
end: 2024-02-29 00:00:00
period: 3h
basePeriod: 15m
exchanges: [{"eid":"Futures_Binance","currency":"BTC_USDT"}]
*/

// This source code is subject to the terms of the Mozilla Public License 2.0 at https://mozilla.org/MPL/2.0/
// © Ravikant_sharma

//@version=5

strategy('new', overlay=true)

start = timestamp(1990, 1, 1, 0, 0)
end = timestamp(2043, 12, 12, 23, 59)
ema0 = ta.ema(close, 9)
ema1 = ta.ema(close, 21)
ema2 = ta.ema(close, 51)
ema3 = ta.ema(close, 100)
ema4 = ta.ema(close, 200)

rsi2=ta.rsi(ta.sma(close,14),14)
plot(ema0, '9', color.new(color.green, 0))
plot(ema1, '21', color.new(color.black, 0))
plot(ema2, '51', color.new(color.red, 0))
plot(ema3, '200', color.new(color.blue, 0))

//plot(ema4, '100', color.new(color.gray, 0))


//LongEntry = (  ta.crossover(ema0,ema3)  or  ta.crossover(ema0,ema2) or  ta.crossunder(ema2,ema3) ) // ta.crossover(ema0,ema1) //
LongEntry=false
if ta.crossover(ema0,ema1)
    if rsi2>65
        LongEntry:=true
if ta.crossover(ema1,ema2)
    if rsi2>65
        LongEntry:=true

LongExit =  ta.crossunder(ema0,ema2) or close >(strategy.position_avg_price*1.25) or rsi2 <40 or close < (strategy.position_avg_price*0.98)


if time >= start and time <= end
    if(LongEntry and rsi2>60)
        strategy.entry('Long', strategy.long, 1)
    if(LongExit)
        strategy.close('Long')