Strategi MACD + SMA 200
Penulis:ChaoZhang, Tarikh: 2022-05-07 17:13:32Tag:MACD
Berikut adalah gabungan MACD klasik (penunjuk penyesuaian konvergensi purata bergerak) dengan SMA purata bergerak perlahan klasik dengan tempoh 200 bersama-sama sebagai strategi.
Strategi ini berjalan lama jika histogram MACD dan momentum MACD sama-sama di atas sifar dan purata bergerak MACD pantas di atas purata bergerak MACD perlahan. Sebagai penapis panjang tambahan, harga baru-baru ini harus berada di atas SMA 200. Jika logik terbalik benar, strategi itu pendek. Untuk kes terburuk terdapat kerugian ekuiti intraday maksimum penapis 50%.
Simpan $999 lagi dengan strategi percuma saya.
Strategi ini berfungsi dalam backtest pada carta harian Bitcoin, serta pada carta harian S&P 500 dan Dow Jones Industrial Average. Prestasi semasa pada 30 November 2015 pada harian SPX500 CFD adalah peratus menguntungkan: 68% sejak tahun 1970 dengan faktor keuntungan 6.4. prestasi semasa pada 30 November 2015 pada indeks DOWI harian adalah peratus menguntungkan: 51% sejak tahun 1915 dengan faktor keuntungan 10.8.
Semua perdagangan melibatkan risiko yang tinggi; prestasi masa lalu tidak semestinya menunjukkan hasil masa depan. Hasil prestasi hipotetik atau simulasi mempunyai batasan semula jadi tertentu. Tidak seperti rekod prestasi sebenar, hasil simulasi tidak mewakili perdagangan sebenar. Juga, kerana dagangan tidak benar-benar dilaksanakan, hasilnya mungkin kurang atau terlalu dikompensasi untuk kesan, jika ada, faktor pasaran tertentu, seperti kekurangan kecairan. Program perdagangan simulasi pada umumnya juga tertakluk kepada fakta bahawa mereka direka dengan manfaat pandangan belakang. Tidak ada perwakilan yang dibuat bahawa mana-mana akaun akan atau mungkin mencapai keuntungan atau kerugian yang serupa dengan yang ditunjukkan.
Ujian belakang
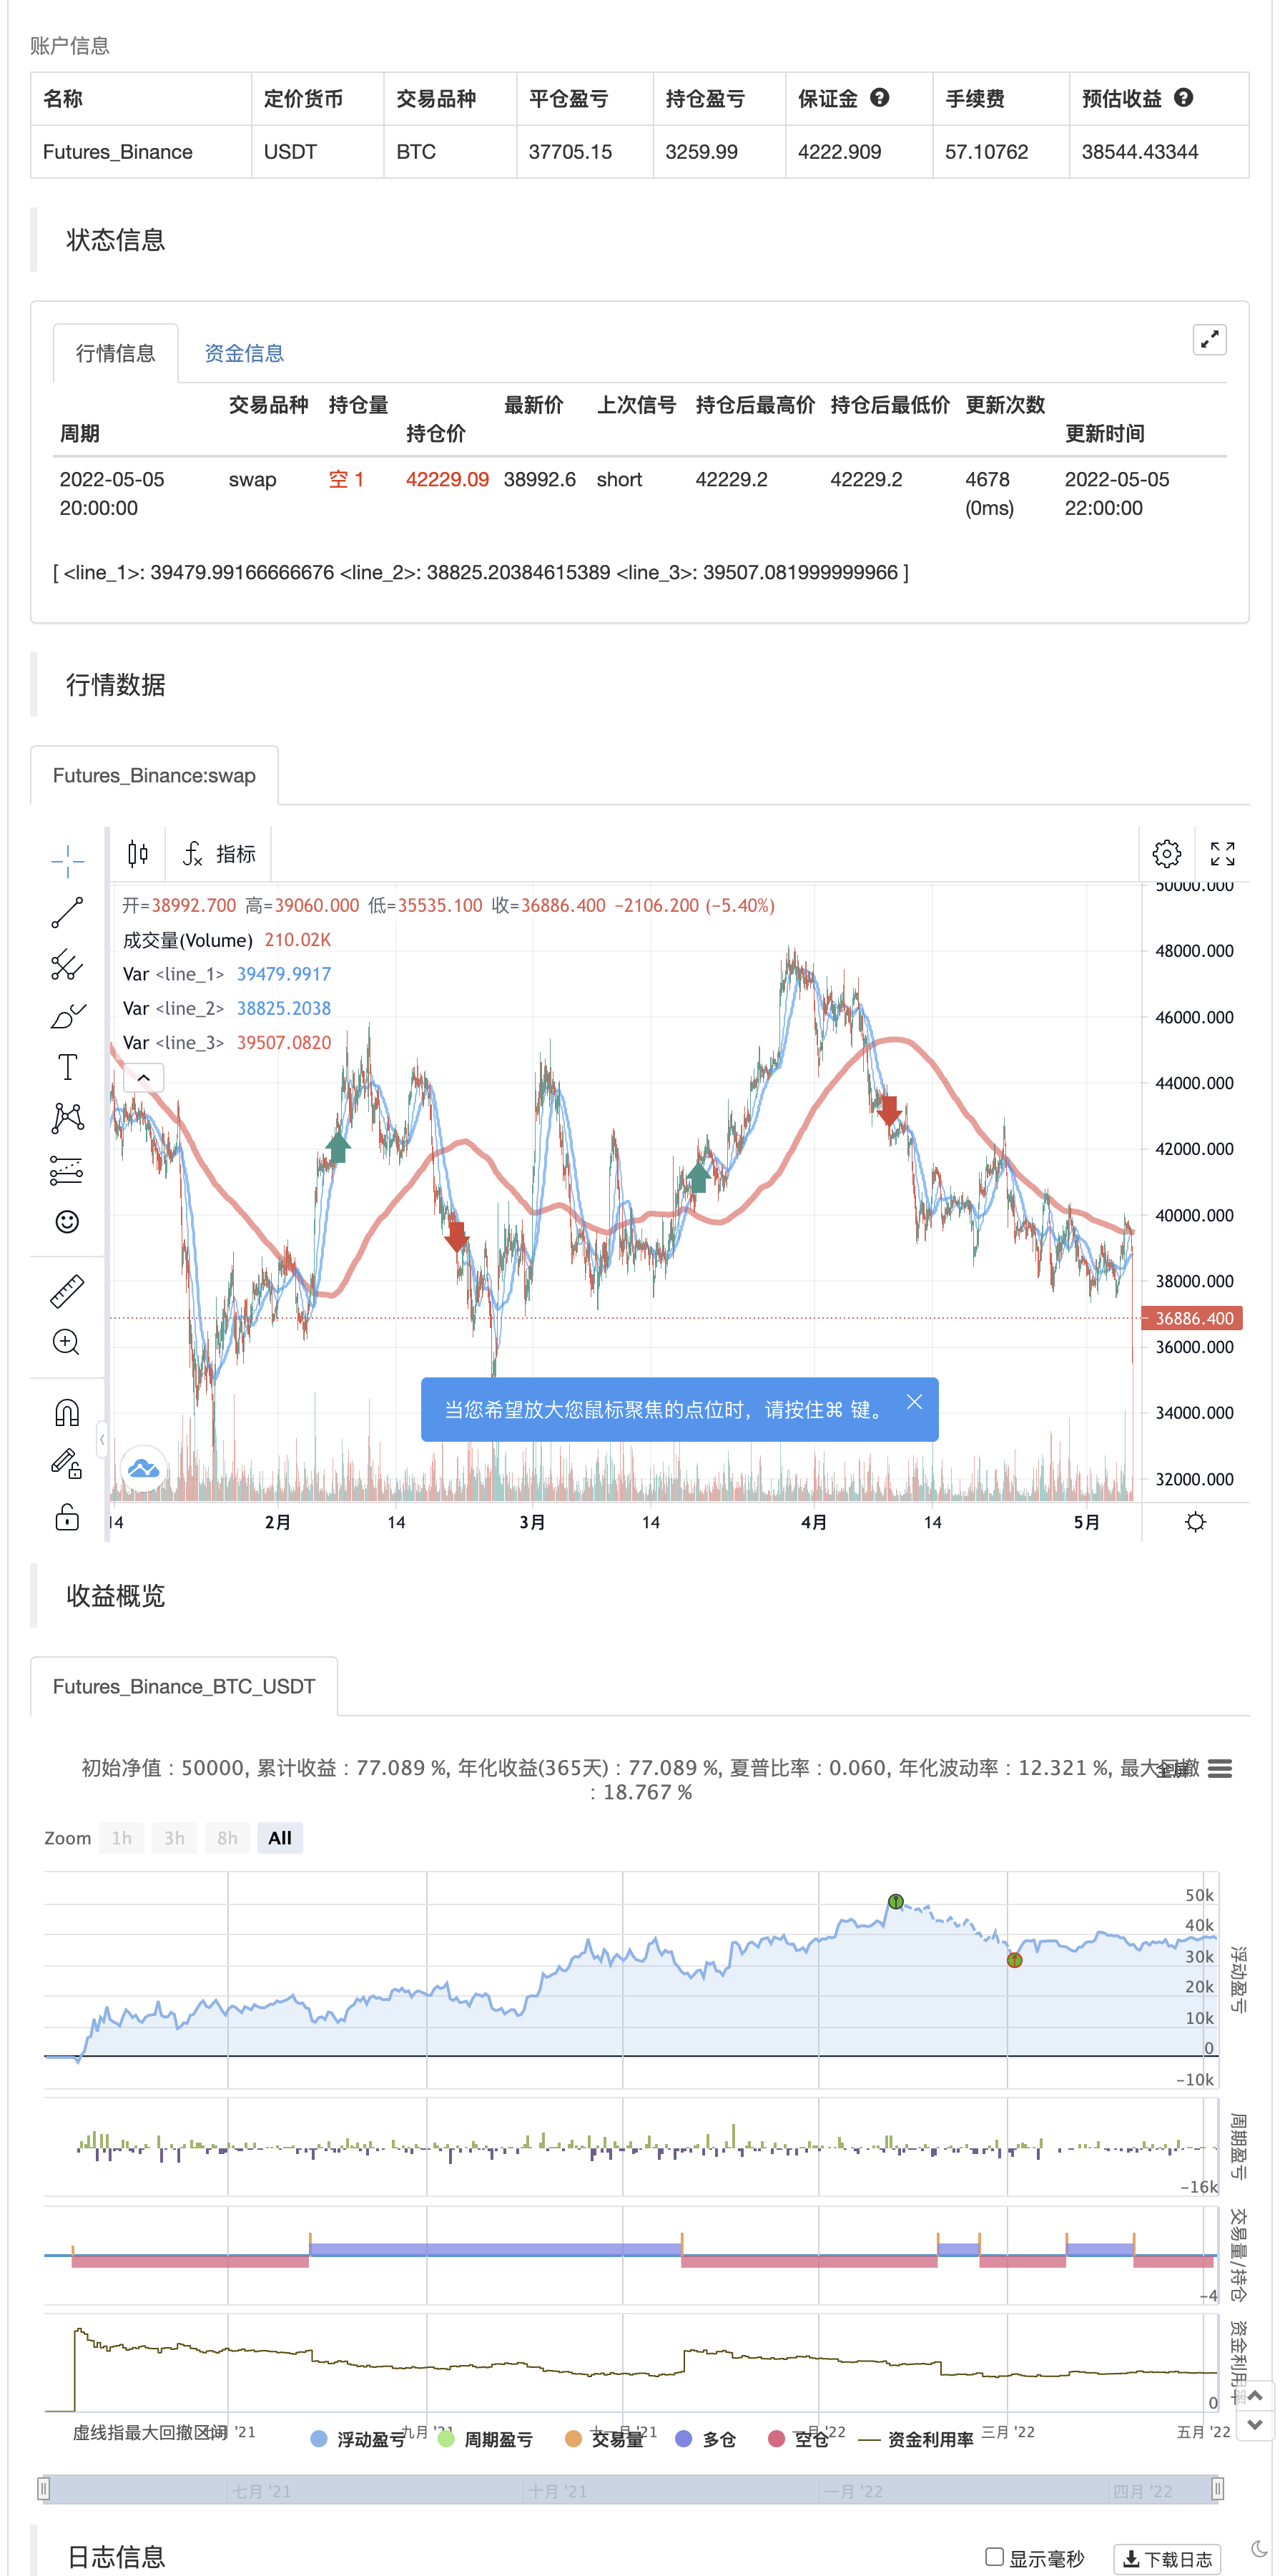
/*backtest
start: 2021-05-06 00:00:00
end: 2022-05-05 23:59:00
period: 2h
basePeriod: 15m
exchanges: [{"eid":"Futures_Binance","currency":"BTC_USDT"}]
*/

//@version=2
strategy("MACD + SMA 200 Strategy (by ChartArt)", shorttitle="CA_-_MACD_SMA_strategy", overlay=true)

// ChartArt's MACD + SMA 200 Strategy
//
// Version 1.0
// Idea by ChartArt on November 30, 2015.
//
// Here is a combination of the MACD with the
// slow moving average SMA 200 as a strategy.
//
// This strategy goes long if the MACD histogram
// and the MACD momentum are both above zero and
// the fast MACD moving average is above the
// slow MACD moving average. As additional long filter
// the recent price has to be above the SMA 200.
// If the inverse logic is true, the strategy
// goes short. For the worst case there is a
// max intraday equity loss of 50% filter.


// Input
source = input(close)
fastLength = input(12, minval=1, title="MACD fast moving average")
slowLength=input(26,minval=1, title="MACD slow moving average")
signalLength=input(9,minval=1, title="MACD signal line moving average")
veryslowLength=input(200,minval=1, title="Very slow moving average")
switch1=input(true, title="Enable Bar Color?")
switch2=input(true, title="Enable Moving Averages?")
switch3=input(true, title="Enable Background Color?")

// Calculation
fastMA = ta.sma(source, fastLength)
slowMA = ta.sma(source, slowLength)
veryslowMA = ta.sma(source, veryslowLength)
macd = fastMA - slowMA
signal = ta.sma(macd, signalLength)
hist = macd - signal

// Colors
MAtrendcolor = change(veryslowMA) > 0 ? color.green : color.red
trendcolor = fastMA > slowMA and change(veryslowMA) > 0 and close > slowMA ? color.green : fastMA < slowMA and change(veryslowMA) < 0 and close < slowMA ? color.red : color.blue
bartrendcolor = close > fastMA and close > slowMA and close > veryslowMA and change(slowMA) > 0 ? color.green : close < fastMA and close < slowMA and close < veryslowMA and change(slowMA) < 0 ? color.red : color.blue
backgroundcolor = slowMA > veryslowMA and crossover(hist, 0) and macd > 0 and fastMA > slowMA and close[slowLength] > veryslowMA ? color.green : slowMA < veryslowMA and crossunder(hist, 0) and macd < 0 and fastMA < slowMA and close[slowLength] < veryslowMA ? color.red : na
//bgcolor(switch3?backgroundcolor:na,transp=80)
//barcolor(switch1?bartrendcolor:na)

// Output
F=plot(switch2?fastMA:na,color=trendcolor)
S=plot(switch2?slowMA:na,color=trendcolor,linewidth=2)
V=plot(switch2?veryslowMA:na,color=MAtrendcolor,linewidth=4)
//fill(F,V,color=gray)

// Strategy
buyprice = low
sellprice = high
cancelLong = slowMA < veryslowMA
cancelShort = slowMA > veryslowMA


if crossover(hist, 0) and macd > 0 and fastMA > slowMA and close[slowLength] > veryslowMA
    strategy.entry("MACDLE", strategy.long, stop=buyprice, comment="Bullish")

else if crossunder(hist, 0) and macd < 0 and fastMA < slowMA and close[slowLength] < veryslowMA
    strategy.entry("MACDSE", strategy.short, stop=sellprice, comment="Bearish")

//maxIdLossPcnt = input(50, "Max Intraday Loss(%)", type=float)
//strategy.risk.max_intraday_loss(maxIdLossPcnt, strategy.percent_of_equity)

//plot(strategy.equity, title="equity", color=red, linewidth=2, style=areabr)
- MACD RSI Ichimoku Trend Momentum Berikutan Strategi Panjang
- Strategi Dagangan Berdasarkan Persaingan Emas dan Kematian MACD Berturut-turut
- Strategi silang EMA yang dipertingkatkan dengan RSI/MACD/ATR
- Strategi Dagangan Jangka Panjang Bersama MACD dan RSI
- Strategi gabungan pelbagai penunjuk (CCI, DMI, MACD, ADX)
- Trend Multi-Indikator Mengikut Strategi
- CCI, DMI, dan Strategi Pendek Panjang Hibrid MACD
- Teori Gelombang Elliott 4-9 Impulse Wave Automatic Detection Strategi Dagangan
- MACD Golden Cross dan Death Cross Strategi
- MACD-V dan Fibonacci Multi-Timeframe Dynamic Take Profit Strategi
- MACD BB Strategy Penembusan
- Rancangan kadar turun naik mudah untuk bahasa Pine
- 3EMA + Boullinger + PIVOT
- baguette oleh multigrain
- MillMachine
- Indikator Pembalikan K I
- Lilin yang Menelan
- MA Maharaja Insiliconot
- Titik Pembalikan Demark
- Swing Highs/Lows & corak lilin
- TMA Overlay
- Sistem CM Sling Shot
- Bollinger + RSI, Strategi Ganda v1.1
- Strategi Bollinger Bands
- Pengesan Trend yang dioptimumkan
- Pulangan Bulanan dalam Strategi PineScript
- ADX dan DI untuk v4
- MacD Custom Indicator-Multiple Time Frame+Semua Pilihan Tersedia!
- Penunjuk: WaveTrend Oscillator
- Indikator Momentum Squeeze
- AlphaTrend