Ujian belakang- Penunjuk
Penulis:ChaoZhang, Tarikh: 2022-05-17 13:59:05Tag:EMA
Untuk sesiapa yang berminat, Berikut adalah contoh bagaimana untuk meletakkan hasil backtesting ke dalam penunjuk. Ini mengira nilai yang sama seperti yang anda dapati di Skrin Ringkasan pencuci balik Strategi yang terbina dalam. Ini akan menggunakan saiz hasil yang sama dengan pencuci balik standard iaitu carta 5 minit mengambil kira-kira 1 bulan data, carta 1 minit mengambil 1 minggu data, dan lain-lain... Saya cuba untuk menjaga ini sebagai mandiri mungkin jadi saya meletakkan kebanyakan kod untuk hasil di bahagian bawah penunjuk. Hasil berhenti pada isyarat perdagangan terakhir yang telah selesai iaitu Beli mempunyai jual ke atasnya. Ini adalah indikator yang sama yang saya terbitkan sebelum ini dengan PCT Trailing StopLoss jadi anda akan melihat kod itu di sini juga. Seperti yang dinyatakan dalam posting saya sebelumnya, penunjuk hanya EMA silang yang mudah untuk memberikan sesuatu yang berguna dan saya tidak mengesyorkan menggunakan penunjuk ini di atas sendiri, tetapi jika anda ingin menukarnya, saya juga mengesahkan jika anda ingin menyalin semula kod dalam strategi anda sendiri.
Nota Tambahan:
- Hasilnya adalah dalam margin kesilapan yang boleh diterima kerana fakta bahawa Indikator perlu mengira berdasarkan ketika Isyarat Beli dan Jual berlaku berbanding apabila perdagangan sebenar berlaku seperti dalam Backtester Strategi
- Saya cuba mencari cara untuk menetapkan bilangan Isyarat Beli untuk digunakan iaitu menunjukkan kepada saya hasil dari 100 perdagangan yang lalu tetapi tidak dapat menyusun logiknya. Saya terbuka untuk cadangan. Juga perlu diingat bahawa saya bukan seorang pengekod secara profesional jadi jika anda mempunyai sebarang idea di hadapan itu, sila jelaskan kepada saya seolah-olah saya seorang kanak-kanak berusia 5 tahun dan berikan contoh kod jika mungkin :)
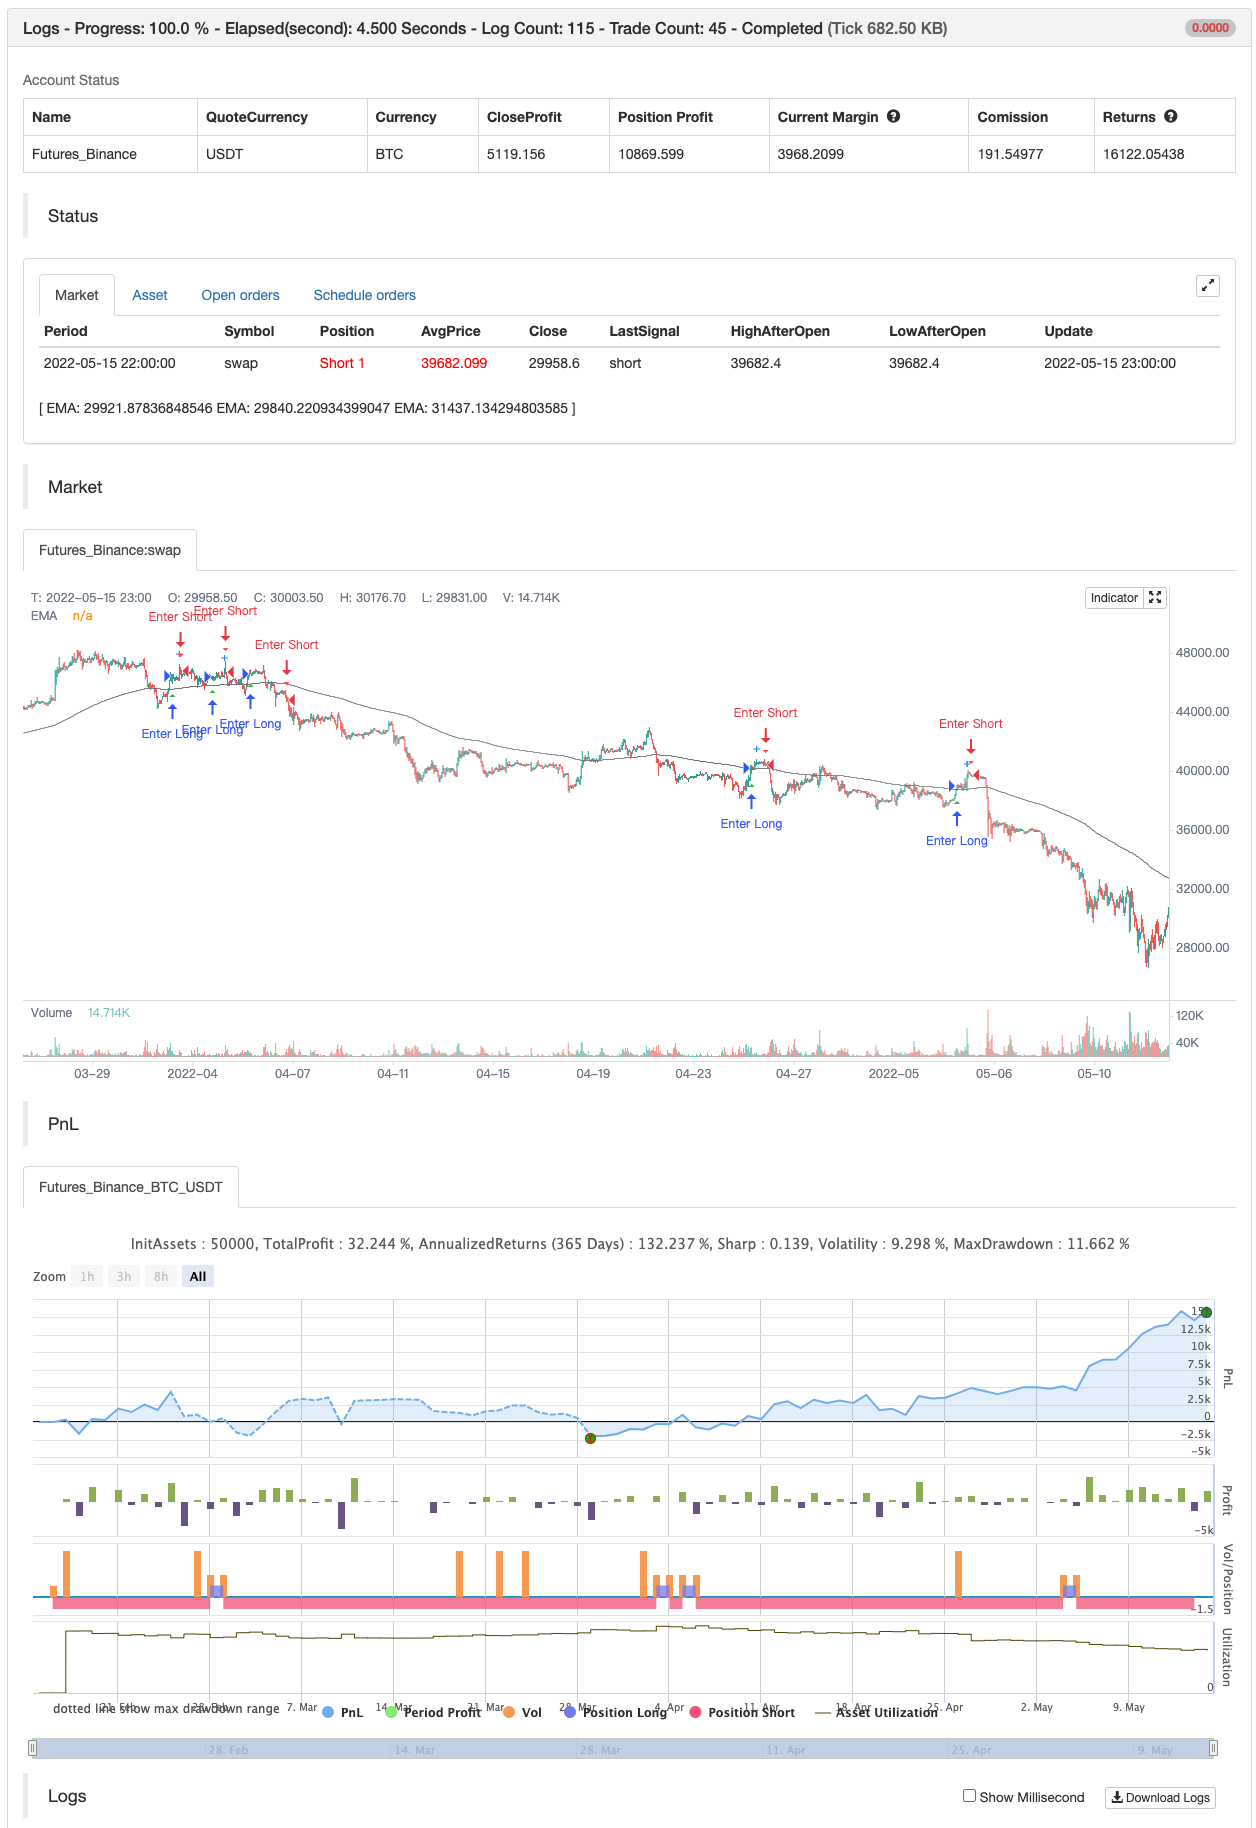
- Saya memasukkan hasil Strategi dalam tangkapan skrin supaya anda boleh melihat di mana hasil berbaris. Nota Tambahan Tambahan: Ini bukan nasihat kewangan, gunakan dengan risiko anda sendiri.
Ujian belakang
/*backtest
start: 2022-02-16 00:00:00
end: 2022-05-16 00:00:00
period: 1h
basePeriod: 15m
exchanges: [{"eid":"Futures_Binance","currency":"BTC_USDT"}]
*/

// This source code is subject to the terms of the Mozilla Public License 2.0 at https://mozilla.org/MPL/2.0/
// © Thumpyr
//@version=5

/////////////////////////////////////////////////////////////////////////////////////////////
// Comment out Strategy Line and remove // from Indicator line to turn into Indicator  //////
// Do same for alertConidction at bottom                                               //////
/////////////////////////////////////////////////////////////////////////////////////////////
//strategy("Backtesting-Strategy", shorttitle="Backtesting- Strategy", overlay=true, margin_long=100, margin_short=100, default_qty_type=strategy.percent_of_equity,default_qty_value=90, commission_type=strategy.commission.percent, commission_value=.075)
indicator(title="Backtesting- Indicator", shorttitle="Backtesting - Indicator", overlay=true)//


openBalance  =input.float(3000, minval=0, title="Opening Balance:", group="Back Test")
pctAllocated =input.float(.9, minval=0, title="Allocated % (90% = .9):", group="Back Test")
commission   =input.float(.075, minval=0, title="Commission%", group="Back Test")


sellLow=input.float(.035, minval=0, title="Stop Loss Loss: 1% = .01", group="Sell Settings")
trailStopArm=input.float(.0065, minval=0, title="Trailing Stop Arm: 1%=.01", group="Sell Settings")
trailStopPct=input.float(.003, minval=0, title="Trailing Stop Trigger: 1%=.01 ", group="Sell Settings")

/////////////////////////////////////////////////
//               Indicators                    //
/////////////////////////////////////////////////
ema1Len = input.int(14, minval=1, title=" ema 1 Length", group="Trend Line Settings")
ema1Src = input(close, title="ema 1 Source", group="Trend Line Settings")
ema1 = ta.ema(ema1Src, ema1Len)
plot(ema1, title="EMA", color=color.blue)

ema2Len = input.int(22, minval=1, title=" ema 2 Length", group="Trend Line Settings")
ema2Src = input(close, title="ema 2 Source", group="Trend Line Settings")
ema2 = ta.ema(ema2Src, ema2Len)
plot(ema2, title="EMA", color=color.orange)

ema3Len = input.int(200, minval=1, title=" ema 3 Length", group="Trend Line Settings")
ema3Src = input(close, title="ema 2 Source", group="Trend Line Settings")
ema3 = ta.ema(ema3Src, ema3Len)
plot(ema3, title="EMA", color=color.gray)


/////////////////////////////
////   Buy Conditions    ////
/////////////////////////////

alertBuy = ta.crossover(ema1,ema2) and close>ema3

////////////////////////////////////////////////////////////////////
////   Filter redundant Buy Signals if Sell has not happened    ////
////////////////////////////////////////////////////////////////////
var lastsignal = 0
showAlertBuy   = 0
if(alertBuy and lastsignal != 1)
    showAlertBuy           := 1
    lastsignal             := 1
buyAlert= showAlertBuy     > 0

var buyActive = 0
if  buyAlert
    buyActive :=1

//////////////////////////////////////////////////////////////////
////          Track Conditions at buy Signal                  ////
//////////////////////////////////////////////////////////////////

alertBuyValue = ta.valuewhen(buyAlert, close,0)
alertSellValueLow = alertBuyValue - (alertBuyValue*sellLow)

////////////////////////////////////////////////////////////
/////            Trailing Stop                         /////
////////////////////////////////////////////////////////////
var TSLActive       = 0         //Check to see if TSL has been activated
var TSLTriggerValue = 0.0 //Initial and climbing value of TSL
var TSLStop         = 0.0       //Sell Trigger
var TSLRunning      = 0       //Continuously check each bar to raise TSL or not

//  Check if a Buy has been triggered and set initial value for TSL //
if buyAlert
    TSLTriggerValue := alertBuyValue+(alertBuyValue*trailStopArm)
    TSLActive  := 0
    TSLRunning := 1
    TSLStop := TSLTriggerValue - (TSLTriggerValue*trailStopPct)


//  Check that Buy has triggered and if Close has reached initial TSL//
//  Keeps from setting Sell Signal before TSL has been armed w/TSLActive//
beginTrail=TSLRunning==1 and TSLActive==0 and close>alertBuyValue+(alertBuyValue*trailStopArm) and ta.crossover(close,TSLTriggerValue)
if beginTrail
    TSLTriggerValue :=close
    TSLActive :=1
    TSLStop :=TSLTriggerValue - (TSLTriggerValue*trailStopPct)

//  Continuously check if TSL needs to increase and set new value //
runTrail= TSLActive==1 and (ta.crossover(close,TSLTriggerValue) or close>=TSLTriggerValue)
if runTrail
    TSLTriggerValue :=close
    TSLStop :=TSLTriggerValue - (TSLTriggerValue*trailStopPct)

//  Verify that TSL is active and trigger when close cross below TSL Stop//
TSL=TSLActive==1 and (ta.crossunder(close,TSLStop) or (close[1]>TSLStop and close<TSLStop))

// Plot point of inital arming of TSL//
TSLTrigger=TSLActive==1 and TSLActive[1]==0
plotshape(TSLTrigger, title='TSL Armed', location=location.abovebar, color=color.new(color.blue, 0), size=size.small, style=shape.cross, text='TSL Armed')


////////////////////////////////////////////////////////////
/////             Sell Conditions                    ///////
////////////////////////////////////////////////////////////
Sell1 = TSL
Sell2 = ta.crossunder(close,alertSellValueLow)

alertSell = Sell1 or Sell2
////////////////////////////////////////////////////////////

////////////////////////////////////////////////////////////
////        Remove Redundant Signals                    ////
////////////////////////////////////////////////////////////
showAlertSell = 0
if(alertSell and lastsignal != -1)
    showAlertSell           := 1
    lastsignal              := -1
sellAlert= showAlertSell    > 0

if sellAlert
    TSLActive  :=0
    TSLRunning :=0
    buyActive  :=0
/////////////////////////////////////////
//  Plot Buy and Sell Shapes on Chart  //
/////////////////////////////////////////
plotshape(buyAlert,  title='Buy' , location=location.belowbar , color=color.new(color.green, 0), size=size.small , style=shape.triangleup   , text='Buy')
plotshape(sellAlert, title='Sell', location=location.abovebar , color=color.new(color.red, 0)  , size=size.small , style=shape.triangledown , text='Sell')

/////////////////////////////////////////////////////////////////////////////////////////////
//                        Remove // on alertCondition to enable Alerts                     //
/////////////////////////////////////////////////////////////////////////////////////////////
//Alerts
alertcondition(title='Buy Alert', condition=buyAlert, message='Buy Conditions are Met')
alertcondition(title='Sell Alert', condition=sellAlert, message='Sell Conditions are Met')
/////////////////////////////////////////////////////////////////////////////////////////////


////////////////////////////////////////////////////////////
////  Comment out this section if setup as Indicator    ////
////////////////////////////////////////////////////////////
//longCondition = buyAlert
//if (longCondition)
//    strategy.entry("Buy", strategy.long)
//    alert(message='Buy', freq=alert.freq_once_per_bar_close)

//shortCondition = sellAlert
//if (shortCondition)
//    strategy.close_all(sellAlert,"Sell")
//    alert(message='Sell', freq=alert.freq_once_per_bar_close)
/////////////////////////////////////////////////////////////


if buyAlert
    strategy.entry("Enter Long", strategy.long)
else if sellAlert
    strategy.entry("Enter Short", strategy.short)
- Strategi Dagangan Berdasarkan Persaingan Emas dan Kematian MACD Berturut-turut
- Strategi Perdagangan RSI Bollinger Bands yang Dipertingkatkan
- Strategi Crossover EMA Bertiga
- Strategi Leverage Crossover Purata Bergerak Eksponen
- Strategi purata bergerak berganda GM-8 & ADX
- Strategi silang EMA yang dipertingkatkan dengan RSI/MACD/ATR
- Trend Z-Score Mengikut Strategi
- Pendaftaran panjang pada EMA Bersilang dengan Strategi Pengurusan Risiko
- Strategi Perdagangan VWAP
- Strategi WaveTrend Cross LazyBear
- Strategi Perdagangan AlphaTradingBot
- SSL Hibrid
- Keluar Chandelier
- Risotto
- EMA Cloud Intraday Strategi
- Titik Pivot Supertrend
- Supertrend+4 bergerak
- ZigZag berasaskan momentum
- VuManChu Cipher B + Strategi Perbezaan
- Konsep Dual SuperTrend
- Super Scalper
- Trendycious
- Pembunuh Sma BTC
- Templat amaran ML
- Perkembangan Fibonacci Dengan Jurang
- RSI MTF Ob+Os
- Fukuiz Octa-EMA + Ichimoku
- CCI MTF Ob+Os
- MACD yang lebih bijak
- Strategi OCC R5.1
- Selamat datang di BEARMARKET [30 MIN]