MACD + SMA 200 Estratégia
Autora:ChaoZhang, Data: 2022-05-07 17:13:32Tags:MACD
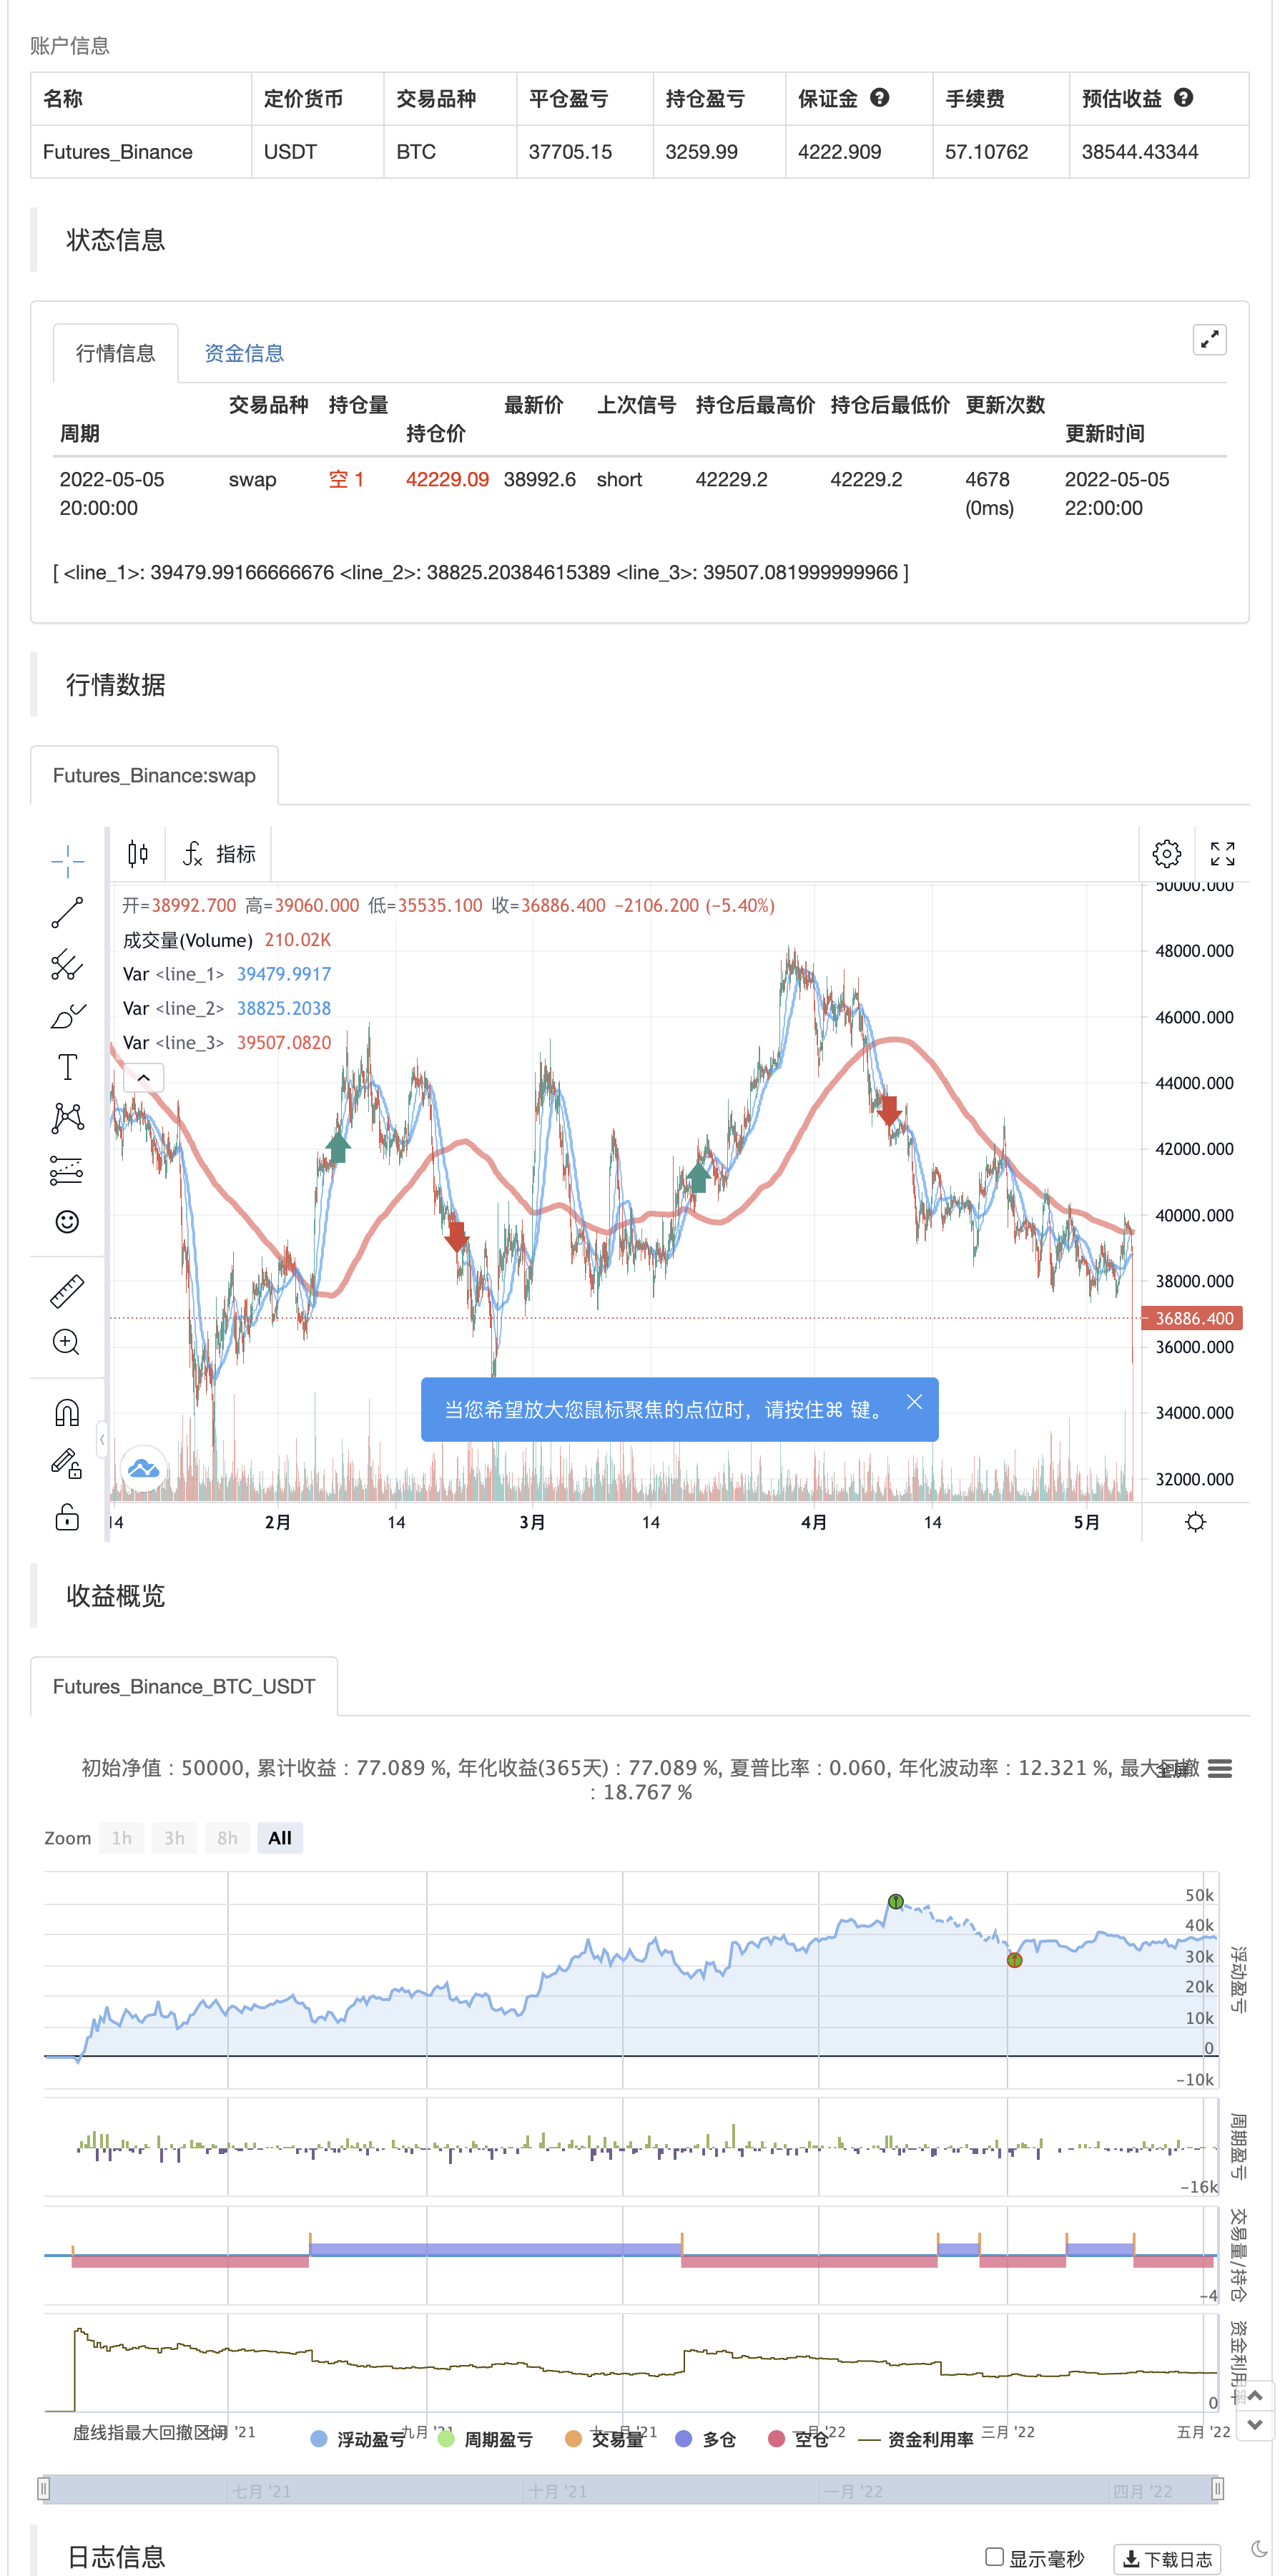
Aqui está uma combinação do MACD clássico (indicador de divergência de convergência da média móvel) com a SMA clássica de média móvel lenta com período 200 juntos como uma estratégia.
Esta estratégia vai longo se o histograma do MACD e o momento do MACD estiverem acima de zero e a média móvel MACD rápida estiver acima da média móvel MACD lenta. Como filtro longo adicional, o preço recente deve estar acima do SMA 200. Se a lógica inversa for verdadeira, a estratégia vai curta. No pior caso, há uma perda máxima de capital intradiário de 50% do filtro.
Economiza mais 999 dólares com a minha estratégia gratuita.
Esta estratégia funciona no backtest no gráfico diário do Bitcoin, bem como nos gráficos diários do S&P 500 e do Dow Jones Industrial Average. O desempenho atual em 30 de novembro de 2015 no SPX500 CFD diário é percentual lucrativo: 68% desde o ano de 1970 com um fator de lucro de 6.4.
Todos os negócios envolvem alto risco; o desempenho passado não é necessariamente indicativo dos resultados futuros. Os resultados de desempenho hipotéticos ou simulados têm certas limitações inerentes. Ao contrário de um registro de desempenho real, os resultados simulados não representam a negociação real. Além disso, como os negócios não foram realmente executados, os resultados podem ter sub- ou supercompensado o impacto, se houver, de certos fatores de mercado, como falta de liquidez. Os programas de negociação simulados em geral também estão sujeitos ao fato de que eles são projetados com o benefício de retrospectiva.
backtest
/*backtest
start: 2021-05-06 00:00:00
end: 2022-05-05 23:59:00
period: 2h
basePeriod: 15m
exchanges: [{"eid":"Futures_Binance","currency":"BTC_USDT"}]
*/

//@version=2
strategy("MACD + SMA 200 Strategy (by ChartArt)", shorttitle="CA_-_MACD_SMA_strategy", overlay=true)

// ChartArt's MACD + SMA 200 Strategy
//
// Version 1.0
// Idea by ChartArt on November 30, 2015.
//
// Here is a combination of the MACD with the
// slow moving average SMA 200 as a strategy.
//
// This strategy goes long if the MACD histogram
// and the MACD momentum are both above zero and
// the fast MACD moving average is above the
// slow MACD moving average. As additional long filter
// the recent price has to be above the SMA 200.
// If the inverse logic is true, the strategy
// goes short. For the worst case there is a
// max intraday equity loss of 50% filter.


// Input
source = input(close)
fastLength = input(12, minval=1, title="MACD fast moving average")
slowLength=input(26,minval=1, title="MACD slow moving average")
signalLength=input(9,minval=1, title="MACD signal line moving average")
veryslowLength=input(200,minval=1, title="Very slow moving average")
switch1=input(true, title="Enable Bar Color?")
switch2=input(true, title="Enable Moving Averages?")
switch3=input(true, title="Enable Background Color?")

// Calculation
fastMA = ta.sma(source, fastLength)
slowMA = ta.sma(source, slowLength)
veryslowMA = ta.sma(source, veryslowLength)
macd = fastMA - slowMA
signal = ta.sma(macd, signalLength)
hist = macd - signal

// Colors
MAtrendcolor = change(veryslowMA) > 0 ? color.green : color.red
trendcolor = fastMA > slowMA and change(veryslowMA) > 0 and close > slowMA ? color.green : fastMA < slowMA and change(veryslowMA) < 0 and close < slowMA ? color.red : color.blue
bartrendcolor = close > fastMA and close > slowMA and close > veryslowMA and change(slowMA) > 0 ? color.green : close < fastMA and close < slowMA and close < veryslowMA and change(slowMA) < 0 ? color.red : color.blue
backgroundcolor = slowMA > veryslowMA and crossover(hist, 0) and macd > 0 and fastMA > slowMA and close[slowLength] > veryslowMA ? color.green : slowMA < veryslowMA and crossunder(hist, 0) and macd < 0 and fastMA < slowMA and close[slowLength] < veryslowMA ? color.red : na
//bgcolor(switch3?backgroundcolor:na,transp=80)
//barcolor(switch1?bartrendcolor:na)

// Output
F=plot(switch2?fastMA:na,color=trendcolor)
S=plot(switch2?slowMA:na,color=trendcolor,linewidth=2)
V=plot(switch2?veryslowMA:na,color=MAtrendcolor,linewidth=4)
//fill(F,V,color=gray)

// Strategy
buyprice = low
sellprice = high
cancelLong = slowMA < veryslowMA
cancelShort = slowMA > veryslowMA


if crossover(hist, 0) and macd > 0 and fastMA > slowMA and close[slowLength] > veryslowMA
    strategy.entry("MACDLE", strategy.long, stop=buyprice, comment="Bullish")

else if crossunder(hist, 0) and macd < 0 and fastMA < slowMA and close[slowLength] < veryslowMA
    strategy.entry("MACDSE", strategy.short, stop=sellprice, comment="Bearish")

//maxIdLossPcnt = input(50, "Max Intraday Loss(%)", type=float)
//strategy.risk.max_intraday_loss(maxIdLossPcnt, strategy.percent_of_equity)

//plot(strategy.equity, title="equity", color=red, linewidth=2, style=areabr)
- MACD RSI Ichimoku Tendência de Impulso Seguindo Estratégia Longa
- Estratégia de negociação baseada em cruzes de ouro e morte MACD consecutivas
- Estratégia reforçada de cruzamento da EMA com o RSI/MACD/ATR
- Estratégia de negociação combinada de longo prazo do MACD e do RSI
- Estratégia de combinação de múltiplos indicadores (CCI, DMI, MACD, ADX)
- Tendência de múltiplos indicadores na sequência da estratégia
- O CCI, o DMI e a estratégia de curto prazo híbrida do MACD
- Teoria da onda de Elliott 4-9 Detecção automática de onda de impulso Estratégia de negociação
- Estratégia MACD Golden Cross e Death Cross
- MACD-V e Fibonacci Multi-Timeframe Dynamic Take Profit Strategy
- Estratégia de ruptura do MACD BB
- Estratégias de fluctuação simples do Python
- 3EMA + Boullinger + PIVOT
- Baguete por multigranos
- Máquina de milhares
- Indicador de inversão de K I
- Velas engolindo
- MA Imperador insicliconot
- Pontos de reversão de Demark
- Padrões de Swing Highs/Lows & Candles
- Superposição TMA
- Sistema CM de lança
- Bollinger + RSI, Estratégia Dupla v1.1
- Estratégia de bandas de Bollinger
- Rastreador de tendências otimizado
- Retorno mensal em estratégias PineScript
- ADX e DI para v4
- MacD Indicador personalizado-Frames de tempo múltiplos+Todas as opções disponíveis!
- Indicador: Oscilador de tendência de onda
- Indicador de momento de compressão
- AlphaTrend