Williams %R - Suavizado
Autora:ChaoZhang, Data: 2022-05-09 12:04:48Tags:WMAEMA
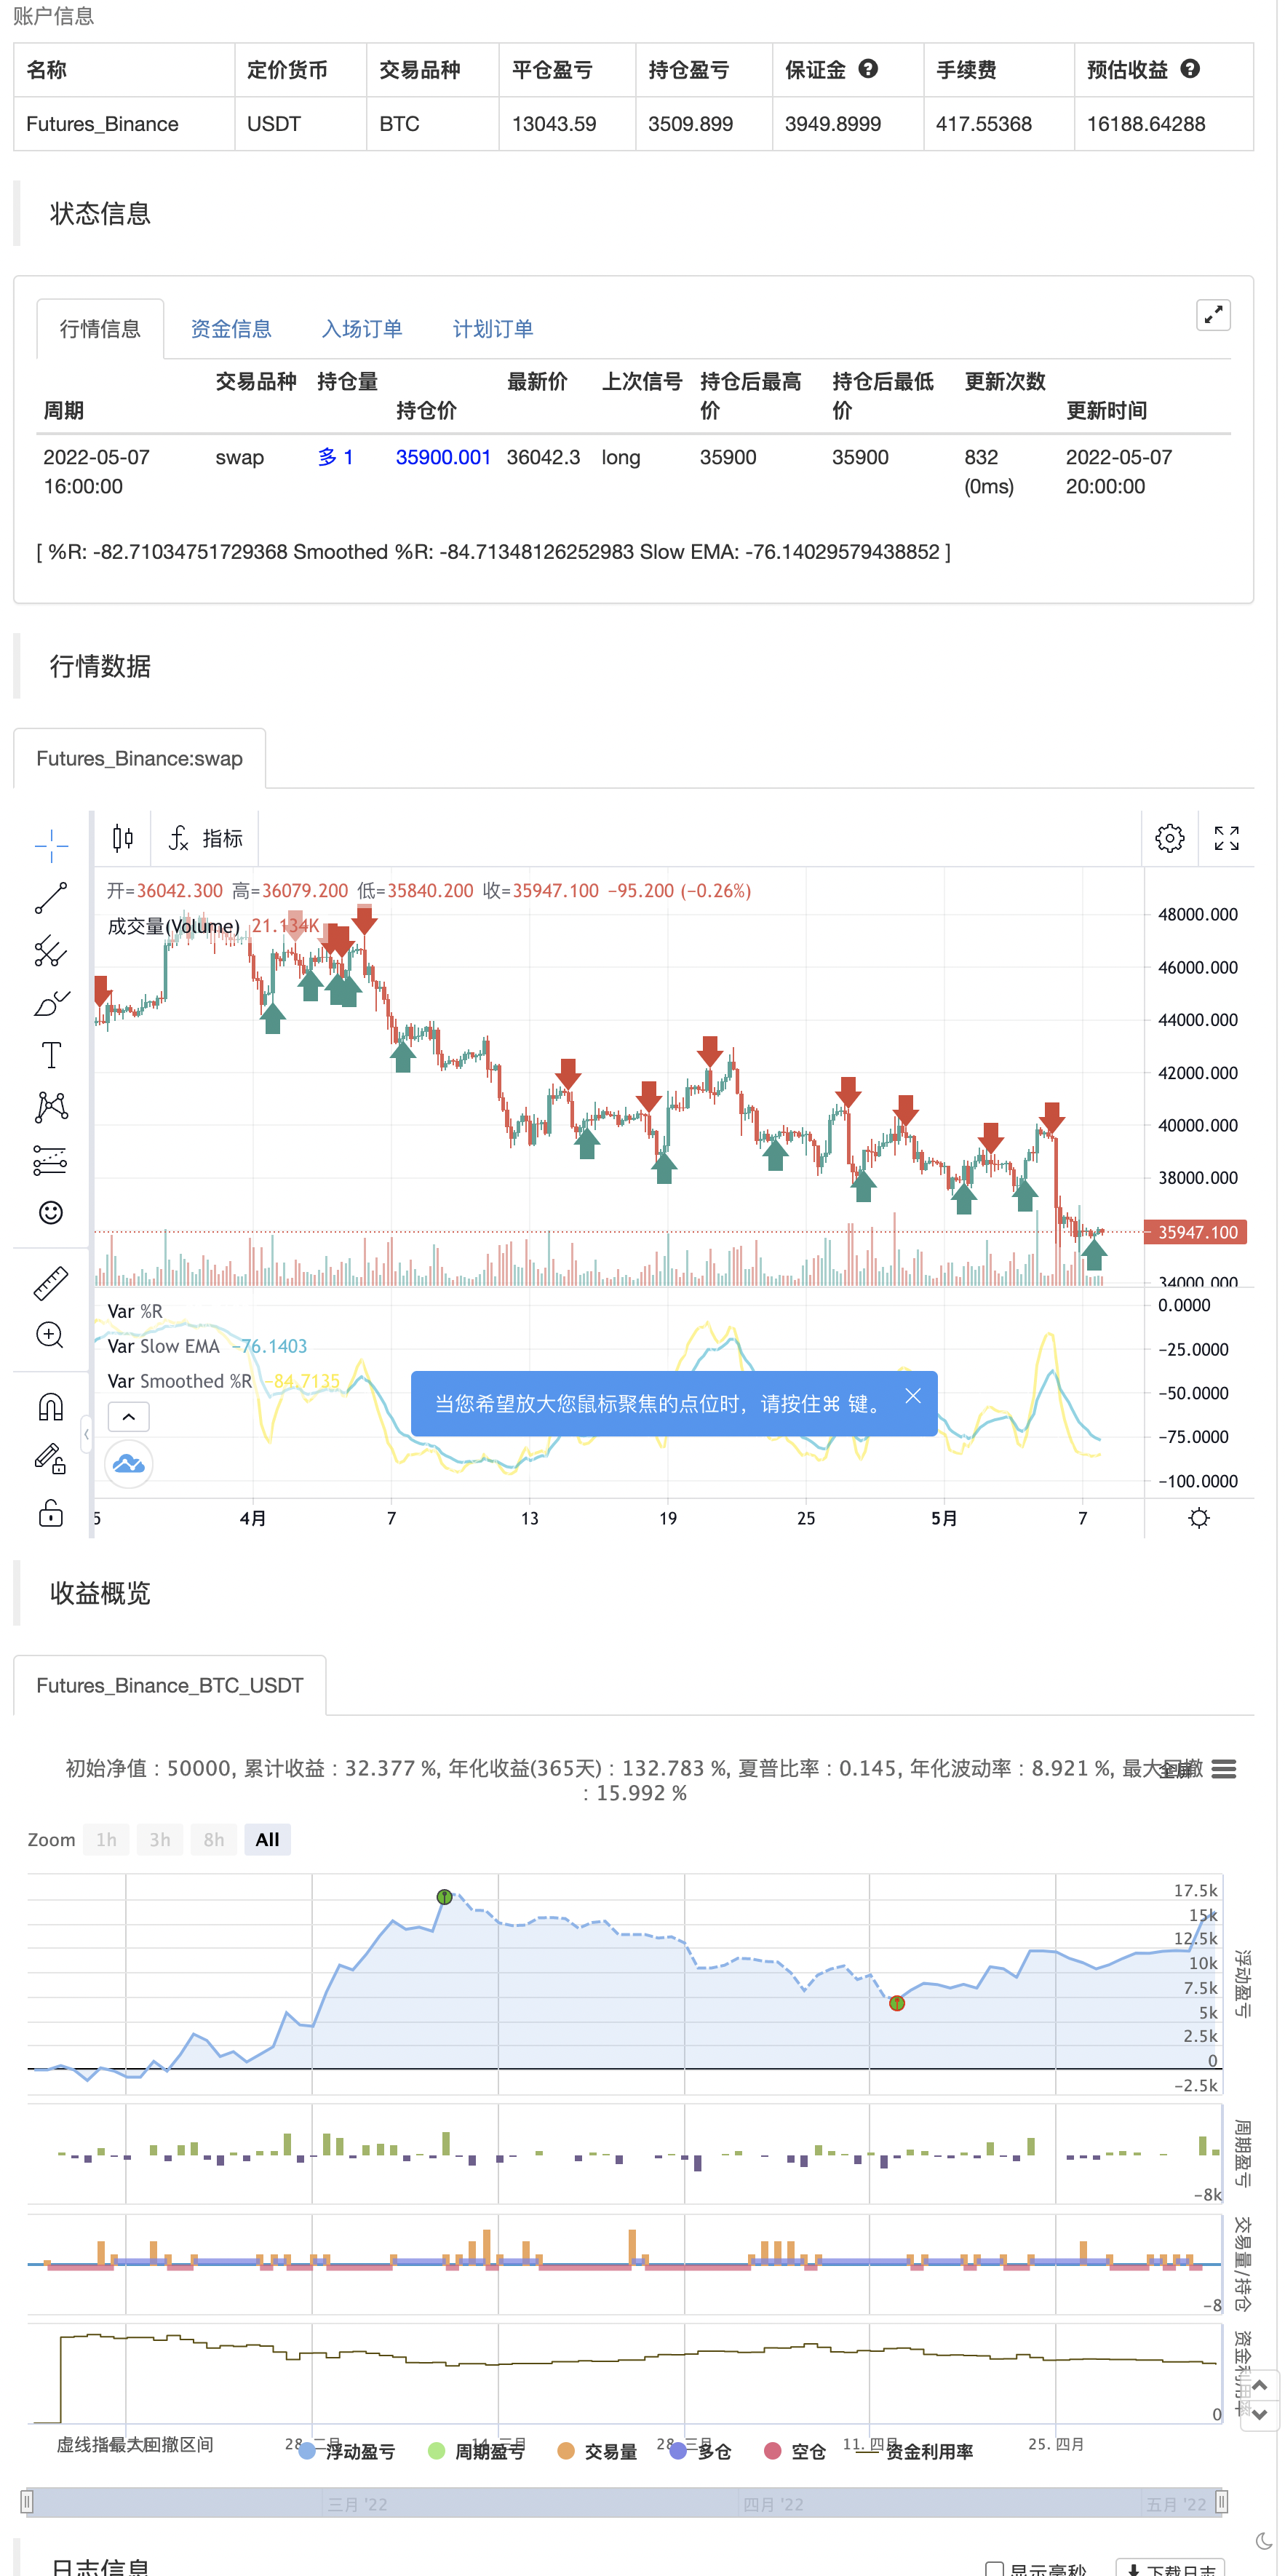
Da descrição do TradingView: O Williams %R (%R) é um oscilador baseado em momento usado na análise técnica, principalmente para identificar condições de sobrecompra e sobrevenda. O %R é baseado em uma comparação entre o fechamento atual e o máximo máximo para um período de retrospectiva definido pelo usuário.
O que é especial? Este indicador adiciona duas linhas EMA adicionais ao indicador original Williams %R. Os comprimentos EMA padrão são 5 e 13. Este indicador inclui:
- Os sinais para cruzes da EMA podem ajudar a indicar mudanças de tendência confirmadas.
- As cores padrão são azul e laranja
Alertas disponíveis para cruzamentos e reversões de alta/baixa.
Aproveite!
backtest
/*backtest
start: 2022-02-08 00:00:00
end: 2022-05-08 00:00:00
period: 4h
basePeriod: 15m
exchanges: [{"eid":"Futures_Binance","currency":"BTC_USDT"}]
*/

// This source code is subject to the terms of the Mozilla Public License 2.0 at https://mozilla.org/MPL/2.0/
// © platsn

//@version=5
indicator(title='Williams %R - Smoothed', shorttitle='The Smooth Willy')

// Williams %R
length = input.int(defval=34, minval=1)
upper = ta.highest(length)
lower = ta.lowest(length)

output = 100 * (close - upper) / (upper - lower)

fast_period = input(defval=5, title='Smoothed %R Length')
slow_period = input(defval=13, title='Slow EMA Length')

fast_ema = ta.wma(output,fast_period)
slow_ema = ta.ema(output,slow_period)

// Plot
//h1 = hline(-20, title='Upper Band')
//h2 = hline(-80, title='Lower Band')
//fill(h1, h2, title='Background', transp=90)

plot(output, title='%R', color=color.new(color.white, 80), linewidth=1)
plot(fast_ema, title='Smoothed %R', color=color.new(color.yellow, 0), linewidth=2)
plot(slow_ema, title='Slow EMA', color=color.new(color.aqua, 0), linewidth=2)

bullX = ta.crossover(fast_ema, slow_ema)
bearX = ta.crossunder(fast_ema, slow_ema)
bullreverse = fast_ema[2] > fast_ema[1] and fast_ema > fast_ema[1] and fast_ema < -30
bearreverse = fast_ema[2] < fast_ema[1] and fast_ema < fast_ema[1] and fast_ema > -70

plotX = input.bool(true, "Show EMA Crossovers")
plotRev = input.bool(true, "Show trend reversals")

//plotshape(plotX and bearX ,"Cross down", color=color.red, style=shape.triangledown, location = location.top, size =size.tiny, offset=-1)
//plotshape(plotX and bullX ,"Cross up", color=color.green, style=shape.triangleup, location = location.bottom, size =size.tiny, offset=-1)
//plotshape(plotRev and bearreverse ,"Bear reversal", color=color.orange, style=shape.triangledown, location = location.top, size =size.tiny, offset=-1)
//plotshape(plotRev and bullreverse ,"Bull reversal", color=color.blue, style=shape.triangleup, location = location.bottom, size =size.tiny, offset=-1)

//alertcondition(bearX,"Bearish Crossover", "Bearish cross on William %R")
//alertcondition(bullX,"Bullish Crossover", "Bullish cross on William %R")
//alertcondition(bearreverse,"Bearish Reversal", "Bearish Reversal on William %R")
//alertcondition(bullreverse,"Billish Reversal", "Bullish Reversal on William %R")

if plotRev and bullreverse
    strategy.entry("Enter Long", strategy.long)
else if plotRev and bearreverse
    strategy.entry("Enter Short", strategy.short)
Relacionados
- Estratégia de criptografia Low Scanner
- Estratégia quantitativa de negociação baseada em médias móveis e bandas de Bollinger
- RedK Relação volume-aceleração da energia direcional
- HALFTREND + HEMA + SMA (estratégia de sinal falso)
- Estratégia Swing Hull/rsi/EMA
- Alerta cruzada média móvel, multi-tempo (MTF)
- A melhor estratégia de engolf + escape
- RedK Dual VADER com barras de energia
- Barras de Momento RedK
- Oscilador Arco-íris
Mais.
- Alertas R3.0 + Condição de Volatilidade Chaiking + TP RSI
- Chande Kroll Parar
- CCI + EMA com estratégia cruzada RSI
- Estratégia de captura de tendências de bandas EMA + leledc + bandas Bollinger
- RSI MTF Ob+Os
- Estratégia MACD Willy
- RSI - Sinais de compra e venda
- Tendência Heikin-Ashi
- HA Viés de mercado
- Oscilador suave de nuvem de Ichimoku
- QQE MOD + SSL híbrido + Waddah Attar Explosão
- Comprar/Vender Strat
- Triple Supertrend com EMA e ADX
- Tom DeMark Sequencial Mapa de Calor
- jma + dwma por multigranos
- MACD mágico
- Pontuação Z com sinais
- Estratégias de fluctuação simples do Python
- 3EMA + Boullinger + PIVOT
- Baguete por multigranos