Estratégia de reversão de tendência baseada em Bandas de Bollinger

Visão geral
A estratégia baseia-se no indicador de Bollinger Bands e na média móvel para determinar se o preço está perto de uma baixa na Bollinger Bands, fazendo uma posição LONG ou SHORT para obter lucro. Quando o preço quebra a Bollinger Bands para cima, olhe para baixo; Quando o preço cai para baixo, olhe para cima.
Princípios
A estratégia baseia-se em dois sinais de entrada:
-
Sinais multi-cabeça: quando o preço de fechamento toca a trajetória inferior e o preço de fechamento está acima da linha média da EMA, a entidade anterior da linha K é negativa e a entidade atual da linha K é positiva.
-
Sinal de vazio: quando o preço de fechamento toca a linha superior e o preço de fechamento está abaixo da linha média da EMA, a entidade anterior da linha K é a linha do sol e a entidade atual da linha K é a linha do sol.
Método de stop loss: Stop loss fixo. O ponto de stop loss é o coeficiente de risco-retorno do preço de entrada em relação à distância do adversário.
Método de paragem: o objetivo é ganhar para o adversário. Isto é, fazer mais paragem para o lado inferior e fazer uma parada para o lado superior.
Vantagens
-
Combinando os benefícios de uma estratégia de tendência e reversão, a estratégia é mais eficiente em situações de tendência.
-
O indicador de correlação de tendências de Bolingbroke é usado para avaliar as áreas de sobrevenda e sobrecompra, e para avaliar as oportunidades de reversão.
-
A fixação de um ponto de parada é razoável e ajuda a controlar o risco.
-
O sistema de bloqueio móvel permite o máximo de lucro.
Riscos
-
A estratégia de ruptura é muito arriscada, e é preciso ter cuidado com as falsas rupturas.
-
O stop loss pode ser acionado com frequência quando a situação é muito turbulenta.
-
O Stop Loss fixo não pode ser ajustado para as flutuações do mercado e pode ser demasiado flexível ou demasiado radical.
-
A configuração dos parâmetros da faixa de Bryn pode ter um efeito negativo.
Otimização de ideias
-
Pode-se considerar a combinação de indicadores RSI para filtrar os sinais de entrada, como RSI acima de 50 para fazer mais, RSI abaixo de 50 para fazer menos, para evitar sinais errados.
-
A adição de uma função para ajustar automaticamente a distância de parada fixa para tornar a parada mais flexível. Por exemplo, a distância de parada pode ser configurada dinamicamente de acordo com o indicador ATR.
-
Optimizar os parâmetros da faixa de Bryn para encontrar a melhor combinação de parâmetros.
-
É possível testar diferentes parâmetros de linha média da EMA para otimizar o efeito de barreira da linha média.
Resumir
A estratégia compreende a tendência e a reversão, usando a faixa de Brin para determinar o ponto de entrada de compra e venda, maximizando os lucros com o stop-loss móvel. O desempenho é melhor em situações de turbulência de tendência.
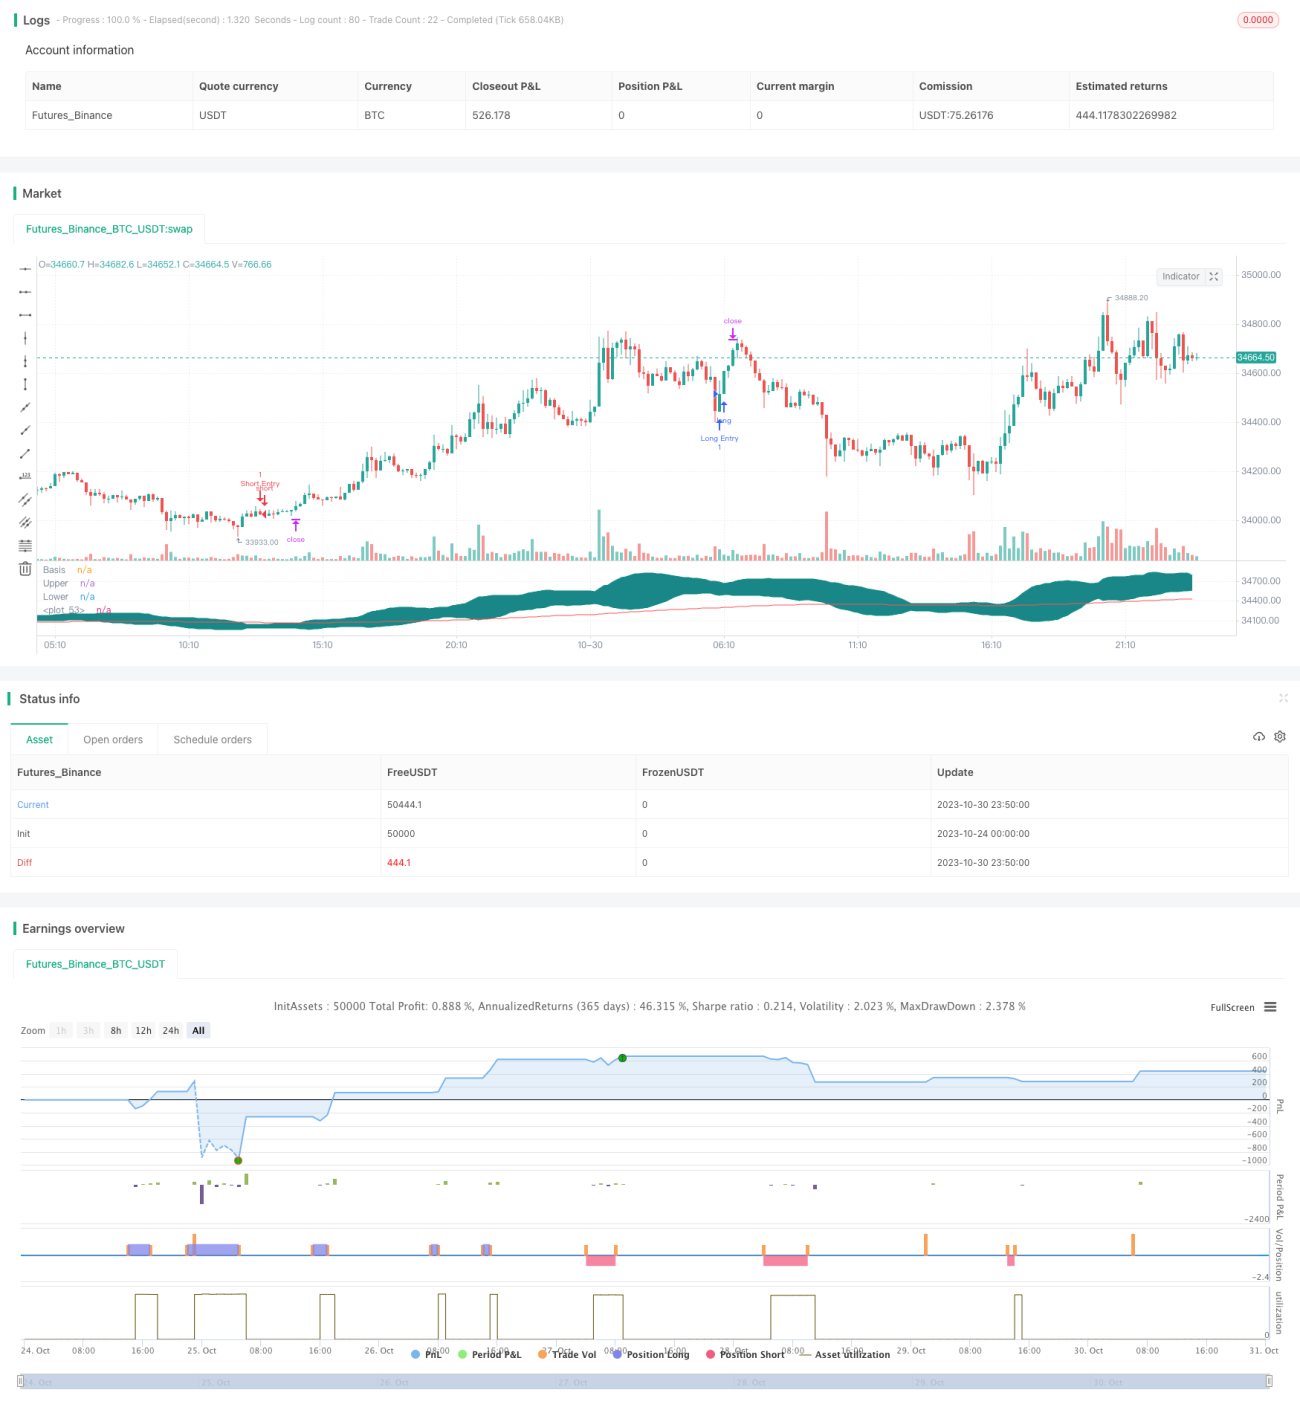
/*backtest
start: 2023-10-24 00:00:00
end: 2023-10-31 00:00:00
period: 10m
basePeriod: 1m
exchanges: [{"eid":"Futures_Binance","currency":"BTC_USDT"}]
*/

//@version=4

// Welcome to yet another script. This script was a lot easier since I was stuck for so long on the Donchian Channels one and learned so much from that one that I could use in this one
// This code should be a lot cleaner compared to the Donchian Channels, but we'll leave that up to the pro's- 1