Estratégia de negociação quantitativa de filtro dinâmico
Visão geral da estratégia
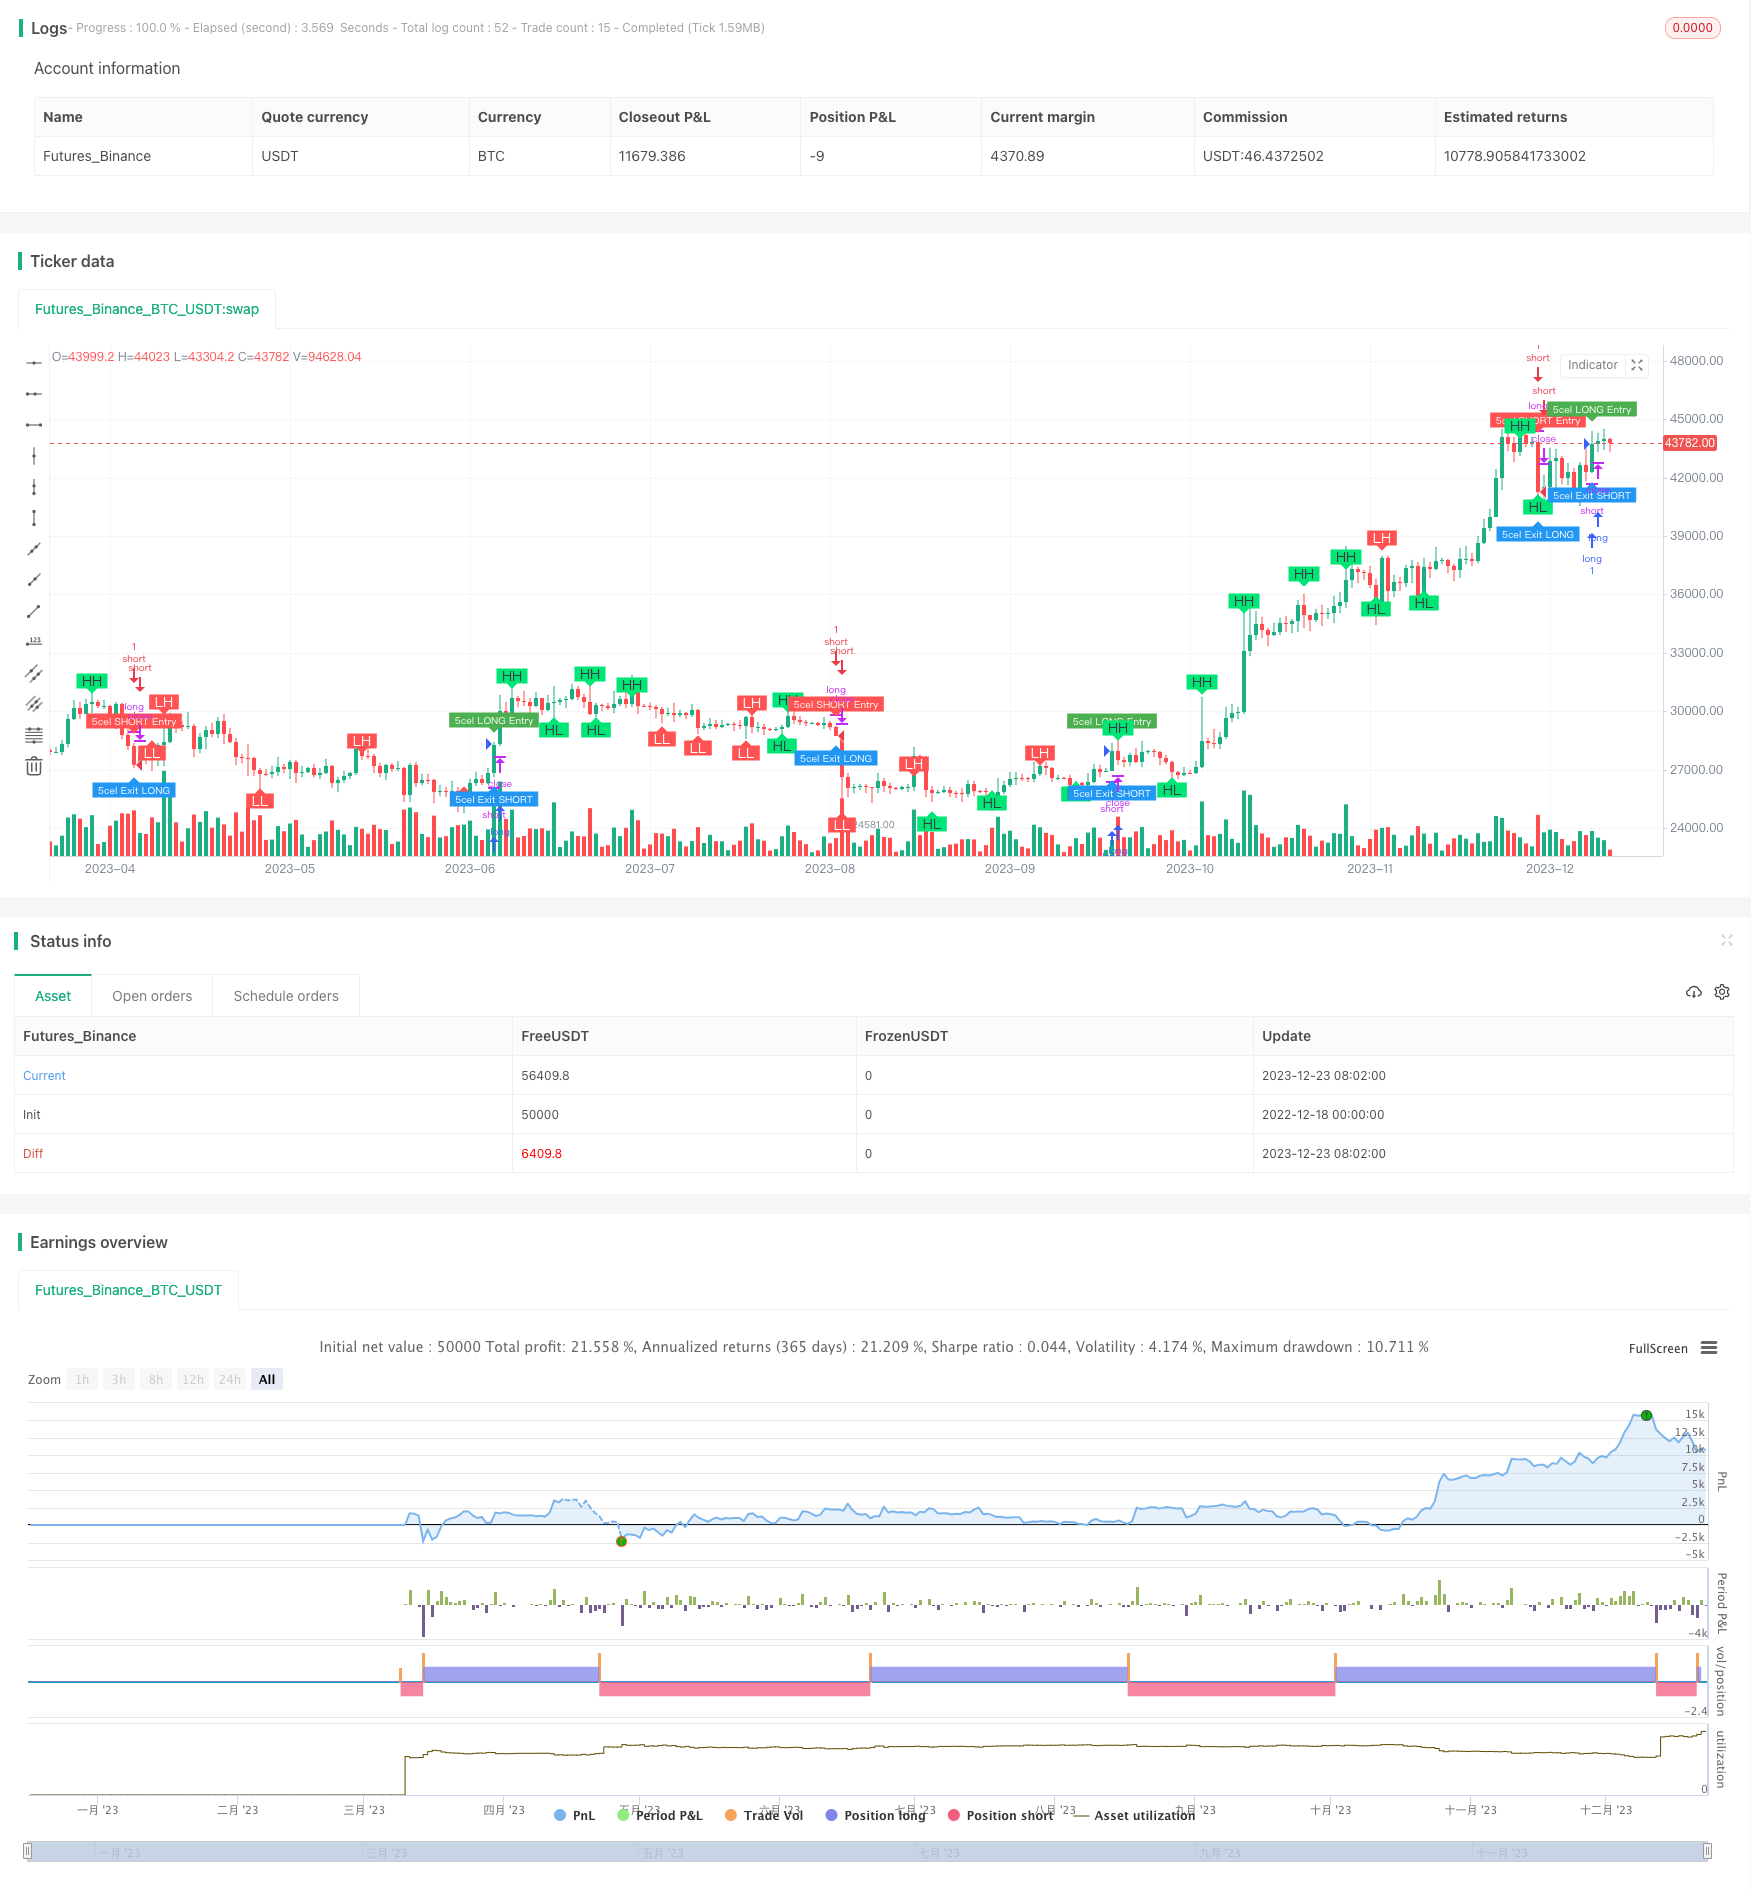
Esta estratégia, denominada Dinamic Filter Quant Trading Strategy, usa principalmente indicadores de filtro de alcance em combinação com vários indicadores técnicos para realizar negociações de acompanhamento de tendências automatizadas na criptomoeda BTCUSDT. A estratégia é adequada para negociações de quantificação de alta frequência, bloqueando lucros e reduzindo a retirada de perdas por meio do ajuste dinâmico do stop loss.
Princípio da estratégia
O indicador central da estratégia é o filtro de alcance, que gera uma linha média com base na variação da gama de preços estatísticos. Quando o preço ultrapassa essa linha média, gera um sinal de negociação. Além disso, a estratégia combina o indicador RSI para determinar o excesso de compra e venda, a linha média para determinar a tendência e o MACD para determinar a dinâmica.
Concretamente, a mediana do filtro de alcance é obtida a partir da média móvel exponencial da variação do preço, e a orientação é baseada na intensidade e velocidade da quebra dessa mediana. Um forte sinal de quebra é gerado quando o preço quebra a mediana por várias linhas K consecutivas.
O indicador RSI é usado para determinar o estado de sobrevenda e sobrevenda para confirmar o sinal do filtro. Quando a linha média sobe, é considerada uma tendência ascendente, e quando a linha média baixa, é considerada uma tendência descendente. O indicador MACD é usado para determinar se a dinâmica do mercado é suficiente para formar uma tendência.
A combinação destes indicadores permite identificar pontos de ruptura de tendência mais confiáveis como um momento para estabelecer uma posição.
Análise de vantagens
A maior vantagem desta estratégia é que a combinação de vários indicadores para tomar decisões, em vez de depender de um único indicador técnico, pode efetivamente reduzir a probabilidade de transações erradas e garantir que os sinais de negociação sejam mais confiáveis. Além disso, os parâmetros de ajuste dinâmico também permitem que a estratégia se adapte às mudanças no mercado.
Outra vantagem é a possibilidade de negociação de alta frequência. O indicador de filtro de gama é sensível a mudanças de preços de pequeno período, o que significa que a estratégia pode abrir posições de paz em um curto período de tempo, sendo, portanto, muito adequada para alta frequência e permitindo lucrar em mercados de criptomoedas com maior volatilidade.
Análise de Riscos
Esta estratégia ainda apresenta alguns riscos. Primeiro, o risco de falha no julgamento da forma técnica, pois o indicador não pode garantir 100% da movimentação do preço. Quando o preço se reverte, pode causar um stop loss.
Outro risco principal é que a linha média do filtro de alcance não pode filtrar completamente os movimentos de preço. Quando ocorre uma flutuação de preço maior do que a linha média, a linha média será invalidada, resultando no risco de produzir sinais errados. Nesse caso, os parâmetros podem ser relaxados adequadamente e a linha média pode ser ampliada.
Por fim, o comércio de alta frequência também envolve um certo risco. Quando a frequência de negociação é muito alta, as taxas de negociação são maiores e podem compensar parte dos lucros. Nesse caso, a frequência de negociação e o tempo de posse podem ser apropriadamente reduzidos.
Otimização de Estratégia
Há ainda espaço para otimizar ainda mais esta estratégia. Por exemplo, pode-se considerar a combinação de mais indicadores, como os indicadores de volatilidade que confirmam tendências, a implementação de condições de filtragem mais rigorosas para garantir que os sinais de negociação sejam mais precisos. Ou estudar as leis de comportamento de preços de diferentes criptomoedas e ações e definir os parâmetros indicadores mais adequados para elas.
A partir da lógica de negociação, também é possível configurar o stop loss dinâmico e a amplitude do stop loss. Ou seja, ampliar o stop loss para bloquear mais lucros quando o volume da posição é maior. Ou acelerar a velocidade do stop loss quando o lucro é maior. Isso pode reduzir a retração até certo ponto.
Finalmente, é possível otimizar os parâmetros do filtro, encontrando um conjunto de parâmetros que permitam que o intervalo da linha central possa filtrar oscilações de forma eficaz e capturar o máximo possível os pontos de reversão de tendência. Isso requer uma grande quantidade de dados de retorno para análise iterativa.
Resumir
Esta estratégia é bem sucedida em combinação com vários indicadores de julgamento, formando uma estratégia de negociação de alta confiabilidade, adequada para aplicações de negociação de alta frequência. Depois de otimização e melhoria contínua, acredita-se que pode obter ganhos estáveis e vale a pena desenvolver ainda mais.
/*backtest
start: 2022-12-18 00:00:00
end: 2023-12-24 00:00:00
period: 1d
basePeriod: 1h
exchanges: [{"eid":"Futures_Binance","currency":"BTC_USDT"}]
*/

//@version=5
strategy(title='5cel Scalp Strategy BTCUSDT Long & Short 30 Min', shorttitle='BTCUSDT Long & Short Scalp 30m', precision=1, overlay=true)

//Swing Call - Based on RSI Overbought & Oversold
//#### Starts Here #####
ema_value = input(5)
sma_value = input(50)
ema1 = ta.ema(close, ema_value)
sma2 = ta.sma(close, sma_value)
rs = ta.rsi(close, 14)

iff_1 = high < sma2 ? color.red : color.yellow
iff_2 = low > sma2 ? color.lime : iff_1
mycolor = rs >= 85 or rs <= 15 ? color.yellow : iff_2

//For Main Strategy
bool swingCallGreen = false
bool swingCallRed = false
bool swingCallYellow = false

if rs >= 85 or rs <= 15
    //color.yellow
    swingCallGreen := false
    swingCallRed := false
    swingCallYellow := true
    swingCallYellow
else
    if low > sma2
        //color.lime
        swingCallGreen := true
        swingCallRed := false
        swingCallYellow := false
        swingCallYellow
        //color.red
    else if high < sma2
        swingCallGreen := false
        swingCallRed := true
        swingCallYellow := false
        swingCallYellow
    else
        //color.yellow
        swingCallGreen := false
        swingCallRed := false
        swingCallYellow := true
        swingCallYellow

hlong = input.int(80, title='Overbought limit of RSI', step=1)
ll = input.int(20, title='Oversold limit of RSI', step=1)

buyexit = ta.crossunder(rs, hlong)
sellexit = ta.crossover(rs, ll)

sellcall = ta.crossover(sma2, ema1) and open > close
buycall = ta.crossunder(sma2, ema1) and high > sma2
//#### Ends Here #####


//Parabolic SAR -  Trend Circles
//#### Starts Here #####
start = input.int(2, minval=0, maxval=10, title='Start - Default = 2 - Multiplied by .01')
increment = input.int(2, minval=0, maxval=10, title='Step Setting (Sensitivity) - Default = 2 - Multiplied by .01')
maximum = input.int(2, minval=1, maxval=10, title='Maximum Step (Sensitivity) - Default = 2 - Multiplied by .10')
sus = input(true, 'Show Up Trending Parabolic Sar')
sds = input(true, 'Show Down Trending Parabolic Sar')
disc = input(false, title='Start and Step settings are *.01 so 2 = .02 etc, Maximum Step is *.10 so 2 = .2')

startCalc = start * .01
incrementCalc = increment * .01
maximumCalc = maximum * .10

sarUp = ta.sar(startCalc, incrementCalc, maximumCalc)
sarDown = ta.sar(startCalc, incrementCalc, maximumCalc)

colUp = close >= sarDown ? color.lime : na
colDown = close <= sarUp ? color.red : na

parabolicSARGreen = ta.sar(startCalc, incrementCalc, maximumCalc)
parabolicSARRed = ta.sar(startCalc, incrementCalc, maximumCalc)
//#### Ends Here #####


//EMA Line
//#### Starts Here #####
ema100 = ta.ema(close, 100)
//#### Ends Here #####


// Ichimoku Cloud
//#### Starts Here #####
sCloud = input(false, 'Show Ichimoku lines')

// Colors
colorGreen = #00ff00
colorRed = #ff0000
colorTenkanViolet = #9400D3
colorKijun = #fdd8a0
colorLime = #006400
colorMaroon = #8b0000

//Periods are set to standard
tenkanPeriods = input.int(9, minval=1, title='Tenkan')
kijunPeriods = input.int(26, minval=1, title='Kijun')
chikouPeriods = input.int(52, minval=1, title='Chikou')
displacement = input.int(26, minval=1, title='Offset')

donchian(len) =>
    math.avg(ta.lowest(len), ta.highest(len))

tenkan = donchian(tenkanPeriods)
kijun = donchian(kijunPeriods)
senkouA = math.avg(tenkan, kijun)
senkouB = donchian(chikouPeriods)
displacedSenkouA = senkouA[displacement]
displacedSenkouB = senkouB[displacement]

bullishSignal = ta.crossover(tenkan, kijun)
bearishSignal = ta.crossunder(tenkan, kijun)

bullishSignalValues = bullishSignal ? tenkan : na
bearishSignalValues = bearishSignal ? tenkan : na


strongBullishSignal = bullishSignalValues > displacedSenkouA and bullishSignalValues > displacedSenkouB
neutralBullishSignal = bullishSignalValues > displacedSenkouA and bullishSignalValues < displacedSenkouB or bullishSignalValues < displacedSenkouA and bullishSignalValues > displacedSenkouB
weakBullishSignal = bullishSignalValues < displacedSenkouA and bullishSignalValues < displacedSenkouB

strongBearishSignal = bearishSignalValues < displacedSenkouA and bearishSignalValues < displacedSenkouB
neutralBearishSignal = bearishSignalValues > displacedSenkouA and bearishSignalValues < displacedSenkouB or bearishSignalValues < displacedSenkouA and bearishSignalValues > displacedSenkouB
weakBearishSignal = bearishSignalValues > displacedSenkouA and bearishSignalValues > displacedSenkouB
//#### Ends Here #####


//Higher High Lower Low Strategy
//#### Starts Here #####
lb = input.int(5, title='Left Bars', minval=1)
rb = input.int(5, title='Right Bars', minval=1)
showsupres = input.bool(true, title='Support/Resistance', inline='srcol')
supcol = input.color(color.lime, title='', inline='srcol')
rescol = input.color(color.red, title='', inline='srcol')
// srlinestyle = input.string(line.style_dotted, title='Line Style/Width', options=[line.style_solid, line.style_dashed, line.style_dotted], inline='style')
srlinewidth = input.int(3, title='', minval=1, maxval=5, inline='style')
changebarcol = input.bool(true, title='Change Bar Color', inline='bcol')
bcolup = input.color(color.blue, title='', inline='bcol')
bcoldn = input.color(color.black, title='', inline='bcol')

ph = ta.pivothigh(lb, rb)
pl = ta.pivotlow(lb, rb)

iff_3 = pl ? -1 : na  // Trend direction
hl = ph ? 1 : iff_3
iff_4 = pl ? pl : na  // similar to zigzag but may have multiple highs/lows
zz = ph ? ph : iff_4
valuewhen_1 = ta.valuewhen(hl, hl, 1)
valuewhen_2 = ta.valuewhen(zz, zz, 1)
zz := pl and hl == -1 and valuewhen_1 == -1 and pl > valuewhen_2 ? na : zz
valuewhen_3 = ta.valuewhen(hl, hl, 1)
valuewhen_4 = ta.valuewhen(zz, zz, 1)
zz := ph and hl == 1 and valuewhen_3 == 1 and ph < valuewhen_4 ? na : zz

valuewhen_5 = ta.valuewhen(hl, hl, 1)
valuewhen_6 = ta.valuewhen(zz, zz, 1)
hl := hl == -1 and valuewhen_5 == 1 and zz > valuewhen_6 ? na : hl
valuewhen_7 = ta.valuewhen(hl, hl, 1)
valuewhen_8 = ta.valuewhen(zz, zz, 1)
hl := hl == 1 and valuewhen_7 == -1 and zz < valuewhen_8 ? na : hl
zz := na(hl) ? na : zz

findprevious() =>  // finds previous three points (b, c, d, e)
    ehl = hl == 1 ? -1 : 1
    loc1 = 0.0
    loc2 = 0.0
    loc3 = 0.0
    loc4 = 0.0
    xx = 0
    for x = 1 to 1000 by 1
        if hl[x] == ehl and not na(zz[x])
            loc1 := zz[x]
            xx := x + 1
            break
    ehl := hl
    for x = xx to 1000 by 1
        if hl[x] == ehl and not na(zz[x])
            loc2 := zz[x]
            xx := x + 1
            break
    ehl := hl == 1 ? -1 : 1
    for x = xx to 1000 by 1
        if hl[x] == ehl and not na(zz[x])
            loc3 := zz[x]
            xx := x + 1
            break
    ehl := hl
    for x = xx to 1000 by 1
        if hl[x] == ehl and not na(zz[x])
            loc4 := zz[x]
            break
    [loc1, loc2, loc3, loc4]

float a = na
float b = na
float c = na
float d = na
float e = na
if not na(hl)
    [loc1, loc2, loc3, loc4] = findprevious()
    a := zz
    b := loc1
    c := loc2
    d := loc3
    e := loc4

_hh = zz and a > b and a > c and c > b and c > d
_ll = zz and a < b and a < c and c < b and c < d
_hl = zz and (a >= c and b > c and b > d and d > c and d > e or a < b and a > c and b < d)
_lh = zz and (a <= c and b < c and b < d and d < c and d < e or a > b and a < c and b > d)

plotshape(_hl, text='HL', title='Higher Low', style=shape.labelup, color=color.new(color.lime, 0), textcolor=color.new(color.black, 0), location=location.belowbar, offset=-rb)
plotshape(_hh, text='HH', title='Higher High', style=shape.labeldown, color=color.new(color.lime, 0), textcolor=color.new(color.black, 0), location=location.abovebar, offset=-rb)
plotshape(_ll, text='LL', title='Lower Low', style=shape.labelup, color=color.new(color.red, 0), textcolor=color.new(color.white, 0), location=location.belowbar, offset=-rb)
plotshape(_lh, text='LH', title='Lower High', style=shape.labeldown, color=color.new(color.red, 0), textcolor=color.new(color.white, 0), location=location.abovebar, offset=-rb)

float res = na
float sup = na
res := _lh ? zz : res[1]
sup := _hl ? zz : sup[1]

int trend = na
iff_5 = close < sup ? -1 : nz(trend[1])
trend := close > res ? 1 : iff_5

res := trend == 1 and _hh or trend == -1 and _lh ? zz : res
sup := trend == 1 and _hl or trend == -1 and _ll ? zz : sup
rechange = res != res[1]
suchange = sup != sup[1]

var line resline = na
var line supline = na
//#### Ends Here #####


//Range Filter 5Min
//#### Starts Here #####

src = input(defval=close, title='Source')
per = input.int(defval=100, minval=1, title='Sampling Period')

// Range Multiplier
mult = input.float(defval=3.0, minval=0.1, title='Range Multiplier')

// Smooth Average Range
smoothrng(x, t, m) =>
    wper = t * 2 - 1
    avrng = ta.ema(math.abs(x - x[1]), t)
    smoothrng = ta.ema(avrng, wper) * m
    smoothrng
smrng = smoothrng(src, per, mult)

// Range Filter
rngfilt(x, r) =>
    rngfilt = x
    rngfilt := x > nz(rngfilt[1]) ? x - r < nz(rngfilt[1]) ? nz(rngfilt[1]) : x - r : x + r > nz(rngfilt[1]) ? nz(rngfilt[1]) : x + r
    rngfilt
filt = rngfilt(src, smrng)

// Filter Direction
upward = 0.0
upward := filt > filt[1] ? nz(upward[1]) + 1 : filt < filt[1] ? 0 : nz(upward[1])
downward = 0.0
downward := filt < filt[1] ? nz(downward[1]) + 1 : filt > filt[1] ? 0 : nz(downward[1])

// Target Bands
hband = filt + smrng
lband = filt - smrng

// Colors
filtcolor = upward > 0 ? color.lime : downward > 0 ? color.red : color.orange
barcolor = src > filt and src > src[1] and upward > 0 ? color.lime : src > filt and src < src[1] and upward > 0 ? color.green : src < filt and src < src[1] and downward > 0 ? color.red : src < filt and src > src[1] and downward > 0 ? color.maroon : color.orange

// Break Outs
longCond = bool(na)
shortCond = bool(na)
longCond := src > filt and src > src[1] and upward > 0 or src > filt and src < src[1] and upward > 0
shortCond := src < filt and src < src[1] and downward > 0 or src < filt and src > src[1] and downward > 0

CondIni = 0
CondIni := longCond ? 1 : shortCond ? -1 : CondIni[1]
longCondition = longCond and CondIni[1] == -1
shortCondition = shortCond and CondIni[1] == 1
//#### Ends Here #####


//#### Starts Here #####
source = close
useCurrentRes = input(true, title='Use Current Chart Resolution?')
resCustom = input.timeframe(title='Use Different Timeframe? Uncheck Box Above', defval='60')
smd = input(true, title='Show MacD & Signal Line? Also Turn Off Dots Below')
sd = input(true, title='Show Dots When MacD Crosses Signal Line?')
sh = input(true, title='Show Histogram?')
macd_colorChange = input(true, title='Change MacD Line Color-Signal Line Cross?')
hist_colorChange = input(true, title='MacD Histogram 4 Colors?')

res1 = useCurrentRes ? timeframe.period : resCustom

fastLength = input.int(12, minval=1)
slowLength = input.int(26, minval=1)
signalLength = input.int(9, minval=1)

fastMA = ta.ema(source, fastLength)
slowMA = ta.ema(source, slowLength)

macd = fastMA - slowMA
signal = ta.sma(macd, signalLength)
hist = macd - signal

outMacD = request.security(syminfo.tickerid, res1, macd)
outSignal = request.security(syminfo.tickerid, res1, signal)
outHist = request.security(syminfo.tickerid, res1, hist)

histA_IsUp = outHist > outHist[1] and outHist > 0
histA_IsDown = outHist < outHist[1] and outHist > 0
histB_IsDown = outHist < outHist[1] and outHist <= 0
histB_IsUp = outHist > outHist[1] and outHist <= 0

//MacD Color Definitions
macd_IsAbove = outMacD >= outSignal
macd_IsBelow = outMacD < outSignal

plot_color = hist_colorChange ? histA_IsUp ? color.aqua : histA_IsDown ? color.blue : histB_IsDown ? color.red : histB_IsUp ? color.maroon : color.yellow : color.gray
macd_color = macd_colorChange ? macd_IsAbove ? color.lime : color.red : color.red
signal_color = macd_colorChange ? macd_IsAbove ? color.yellow : color.yellow : color.lime

circleYPosition = outSignal
//#### Ends Here #####


//////////////////
// Main Strategy
/////////////////
//#### Starts Here #####
var bottomText = 'Something is not ok'

bool rangeBuy = false
if longCondition
    rangeBuy := true
else
    rangeBuy := false

bool rangeSell = false
if shortCondition
    rangeSell := true
else
    rangeSell := false

bool ema100Bullish = false
bool ema100Bearish = false
bool ichimokuBearish = false
bool ichimokuBullish = false
string statusChance = 'Who knows what will happen'
string futureIchimokuTrend = 'Anything can happen'

if close > ema100
    ema100Bullish := true
    ema100Bearish := false
else
    ema100Bullish := false
    ema100Bearish := true

if displacedSenkouA > displacedSenkouB
    ichimokuBearish := false
    futureIchimokuTrend := 'Green - chance to go up'
    ichimokuBullish := true
else
    ichimokuBearish := true
    futureIchimokuTrend := 'Red - chance to go down'
    ichimokuBullish := false
    ichimokuBullish

if ema100Bullish and parabolicSARGreen
    if ichimokuBullish
        statusChance := '100%'
    else
        statusChance := '95%'
else
    if ema100Bullish and parabolicSARRed
        statusChance := '75%'
    else if ema100Bearish and parabolicSARGreen
        statusChance := '65%'
    else
        statusChance := '55%'

bool longTradePosition = false
bool shortTradePosition = false
string longTradeText = 'Now cannot say anything'

if (swingCallGreen or swingCallYellow) and ichimokuBullish and longCondition and ema100Bullish and parabolicSARGreen
    longTradePosition := true
    longTradeText := 'Bullish'

bottomText := longTradeText + ' Chance: ' + statusChance + '\n Future Trend: ' + futureIchimokuTrend
// Bottom Text

var tLog = table.new(position=position.bottom_right, rows=1, columns=2, bgcolor=color.blue, border_width=1)
table.cell(tLog, row=0, column=0, text=bottomText, text_color=color.white)
table.cell_set_text(tLog, row=0, column=0, text=bottomText)
//#### Ends Here #####

bool entryLongPosition = false
bool exitLongPosition = false

bool entryShortPosition = false
bool exitShortPosition = false

bool longPositionCount = false
bool shortPositionCount = false


if (strategy.position_size > 0)
    longPositionCount := true

if (strategy.position_size < 0)
    shortPositionCount := true

// Entry LONG
if (longCondition) and (not longPositionCount)
    entryLongPosition := true

// Exit LONG
if (shortCondition) and (longPositionCount)
    exitLongPosition := true

// Entry SHORT
if (shortCondition) and (not shortPositionCount)
    entryShortPosition := true

// Exit SHORT
if (longCondition) and (shortPositionCount)
    exitShortPosition := true

// LONG Entry & Exit
plotshape(entryLongPosition, style=shape.labeldown, location=location.abovebar, color=color.new(color.green, 0), size=size.tiny, title='buy label', text='5cel\nLONG Entry', textcolor=color.new(color.white, 0))
plotshape(exitLongPosition, style=shape.labelup, location=location.belowbar, color=color.new(color.blue, 0), size=size.tiny, title='sell label', text='5cel\nExit LONG', textcolor=color.new(color.white, 0))

//SHORT Entry & Exit
plotshape(entryShortPosition, style=shape.labeldown, location=location.abovebar, color=color.new(color.red, 0), size=size.tiny, title='buy label', text='5cel\nSHORT Entry', textcolor=color.new(color.white, 0))
plotshape(exitShortPosition, style=shape.labelup, location=location.belowbar, color=color.new(color.blue, 0), size=size.tiny, title='sell label', text='5cel\nExit SHORT', textcolor=color.new(color.white, 0))

//Get the Current Value
heikinashi_close = request.security(ticker.heikinashi(syminfo.tickerid), timeframe.period, close)

if entryLongPosition
    longLabel = label.new(bar_index, high, text=str.tostring(heikinashi_close, '0.00'), color=color.orange, style=label.style_label_down, yloc=yloc.abovebar)

if entryShortPosition
    shortLabel = label.new(bar_index, high, text=str.tostring(heikinashi_close, '0.00'), color=color.orange, style=label.style_label_down, yloc=yloc.abovebar)

/// SHORT Exit
strategy.close("short", when=exitShortPosition, comment="close_short_position")

/// LONG Exit
strategy.close("long", when=exitLongPosition, comment = "close_long_position")

/// LONG Enter
strategy.entry("long", strategy.long, when=entryLongPosition, comment="open_long_position")

/// SHORT Enter
strategy.entry("short", strategy.short, when = entryShortPosition, comment="open_short_position")