Estratégia de acompanhamento de tendência de média móvel adaptativa dinâmica de Kaufman

Visão geral
A estratégia é baseada em um design de Kaufman Adapted Moving Average (KAMA), que permite ajustar dinamicamente as posições de negociação e acompanhar automaticamente as tendências do mercado. As principais funções da estratégia incluem:
- Calculação dinâmica do tempo de negociação (em pontos), adaptação à volatilidade do mercado
- Geração de sinais de compra e venda de acordo com a direção KAMA
- Depois de um sinal, defina um intervalo de parada e ajuste conforme o preço se move
- Opcional para aguardar o sinal de confirmação de fechamento da linha K, filtrar o falso sinal
Através do uso desses recursos, a estratégia tenta obter benefícios adicionais da tendência, enquanto controla os riscos.
Princípio da estratégia
A estratégia baseia-se no trabalho de Kaufman na adaptação do indicador de média móvel. A KAMA ajusta dinamicamente o peso e a suavidade da média, calculando o rácio de movimento e oscilação dos preços, de modo a responder mais rapidamente às mudanças de preço.
Quando o KAMA atravessa a linha de parada para baixo, a tendência é reversível, gerando um sinal de compra; quando o KAMA atravessa a linha de parada para baixo, a tendência é reversível, gerando um sinal de venda. Após entrar em posição, a estratégia calcula uma distância de parada dinâmica de acordo com o ATR e estabelece uma linha de parada. Quando o KAMA se move na direção vantajosa, a linha de parada também se ajusta, movendo a linha de parada para uma posição mais vantajosa para bloquear mais lucros.
Dessa forma, a estratégia pode seguir a tendência e mover a linha de parada gradualmente até que a linha de parada seja acionada ou o sinal de reversão seja acionado e a posição seja liquidada.
Vantagens estratégicas
Em comparação com a estratégia de média móvel tradicional, a estratégia tem as seguintes vantagens:
- O índice KAMA é mais sensível e capta mais rapidamente as tendências de preços.
- O cálculo dinâmico do intervalo de parada, que se ajusta à tendência, pode bloquear lucros mais altos;
- Há uma confirmação de fechamento de linha K opcional, que pode filtrar os sinais falsos, reduzindo a necessidade de abrir posições.
Em geral, a estratégia é rápida, controlada e é uma estratégia típica de acompanhamento de tendências.
Risco estratégico
A estratégia também apresenta alguns riscos:
- Risco de reversão de tendência. O índice KAMA é flexível para responder a flutuações de preços, mas pode não responder a uma reversão de tendência súbita em tempo hábil.
- Stop Loss muito radical. A distância de stop loss dinâmica pode ser muito radical se for definida de forma excessiva, deixando os lucros atrasados para serem bloqueados.
- Risco de falso sinal. A ativação da confirmação de fechamento de linha K pode reduzir o falso sinal, mas não pode eliminá-lo completamente.
Estes riscos podem ser controlados por meio de métodos como a otimização da distância de parada, a configuração da porcentagem máxima de parada. Também pode ser combinado com outros indicadores como confirmação, evitando transações erradas.
Direção de otimização da estratégia
A estratégia pode ser otimizada para:
- Optimizar os parâmetros KAMA: ajustar o comprimento da linha média e otimizar a suavidade;
- Otimização de perda dinâmica: testar a melhor distância de perda e a melhor distância de passo de acordo com as características de diferentes variedades;
- Aumentar os indicadores de filtragem: em combinação com outros indicadores de tendência, confirmação de sinais de negociação e aumento da confiabilidade do sinal.
Por exemplo, pode-se testar a adição de MACD como um indicador de confirmação auxiliar, ao mesmo tempo em que o KAMA Goldfork, também requer que o MACDDif também seja positivo e ampliado. Isso pode filtrar alguns sinais falsos e evitar aberturas de posição repetidas desnecessariamente.
Resumir
Esta estratégia funciona bem como um todo, usando um stop loss dinâmico para acompanhar a tendência e maximizar o lucro da tendência. A adaptabilidade do indicador KAMA também permite que a estratégia acompanhe as mudanças rápidas do mercado. Com alguma otimização, a estratégia pode se tornar um programa de acompanhamento de tendências eficiente, adequado para operações de linha média e longa.
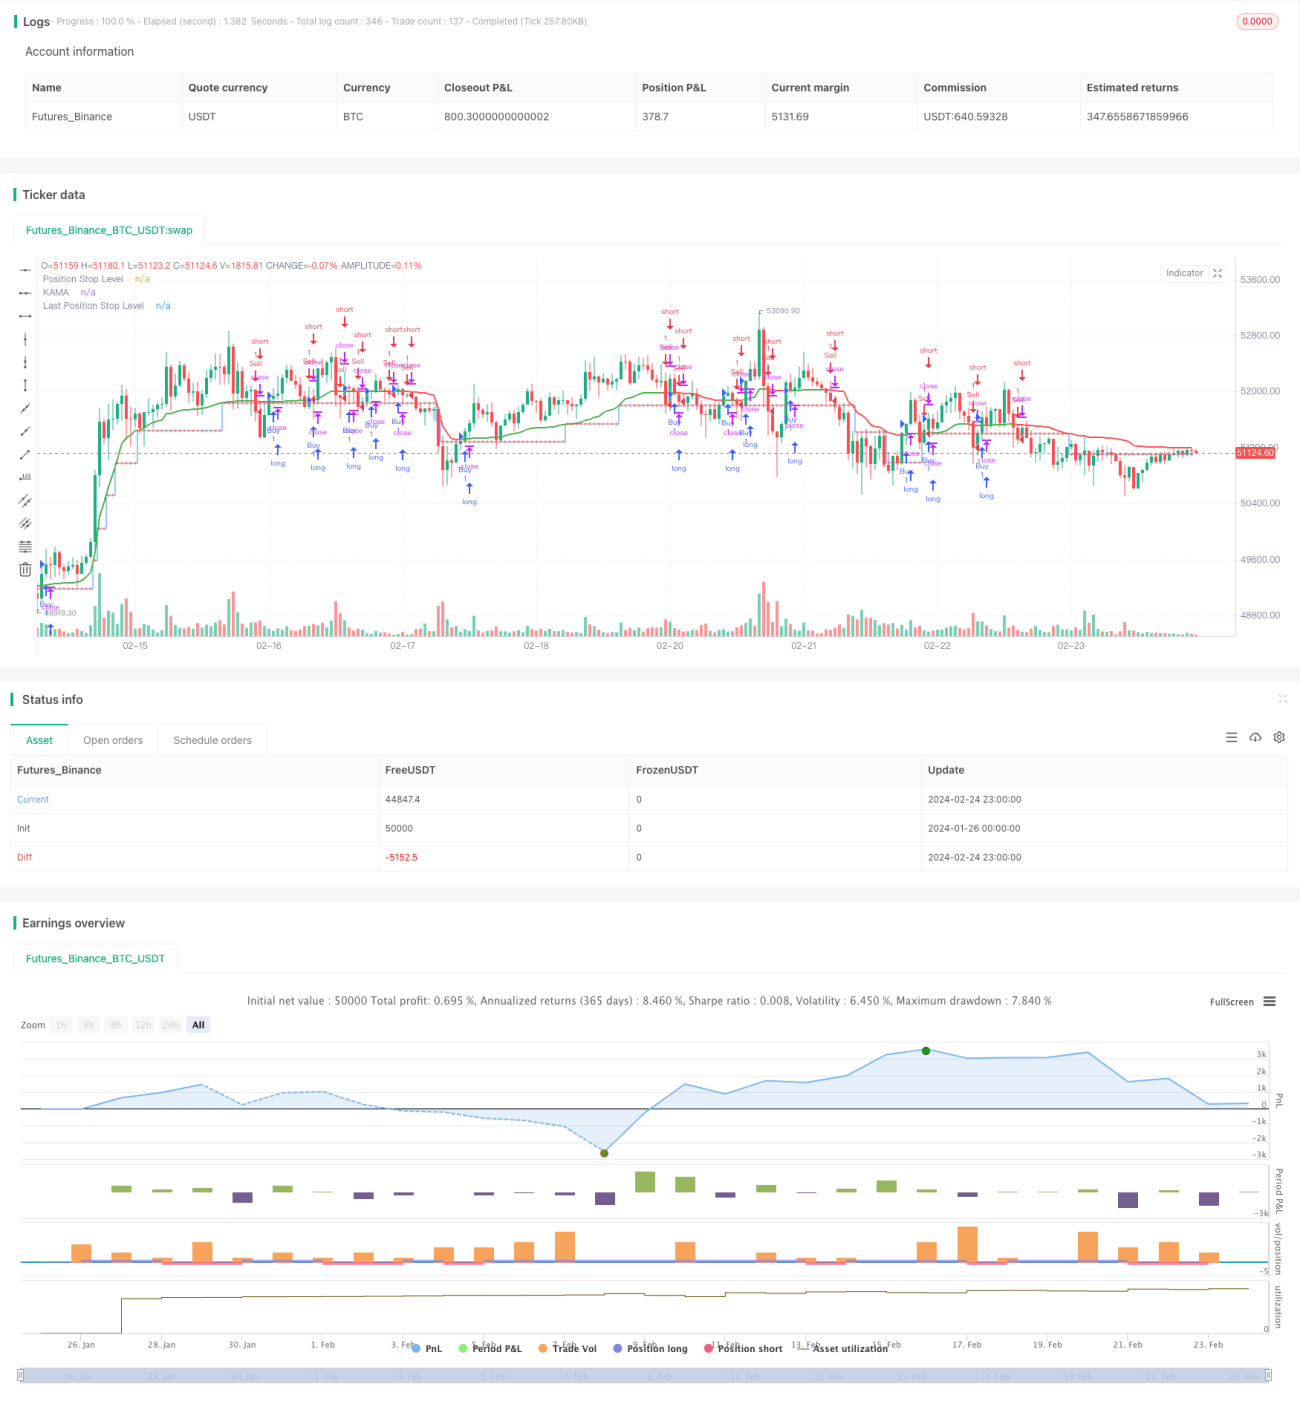
/*backtest
start: 2024-01-26 00:00:00
end: 2024-02-25 00:00:00
period: 1h
basePeriod: 15m
exchanges: [{"eid":"Futures_Binance","currency":"BTC_USDT"}]
*/

//@version=5
strategy("THMA - Bharath Vc Improved", overlay=true, process_orders_on_close=true)

// Function to calculate pips with higher precision- 1