Индекс относительной силы - Дивергенции - Либертус
Автор:Чао Чжан, Дата: 24 мая 2022 года 15:24:22Тэги:РСИ
Привет всем,
Чтобы облегчить всем торговый опыт я сделал этот сценарий, который цвета RSI перекупленные и перепроданные условия и в качестве бонуса отображает бычьи или медвежие расхождения в последние 50 свечей (по умолчанию, вы можете изменить его). Если у вас есть предложения или вы уже сделали некоторые улучшения, пожалуйста, сообщите в комментариях.
Счастливой торговли и удачи!
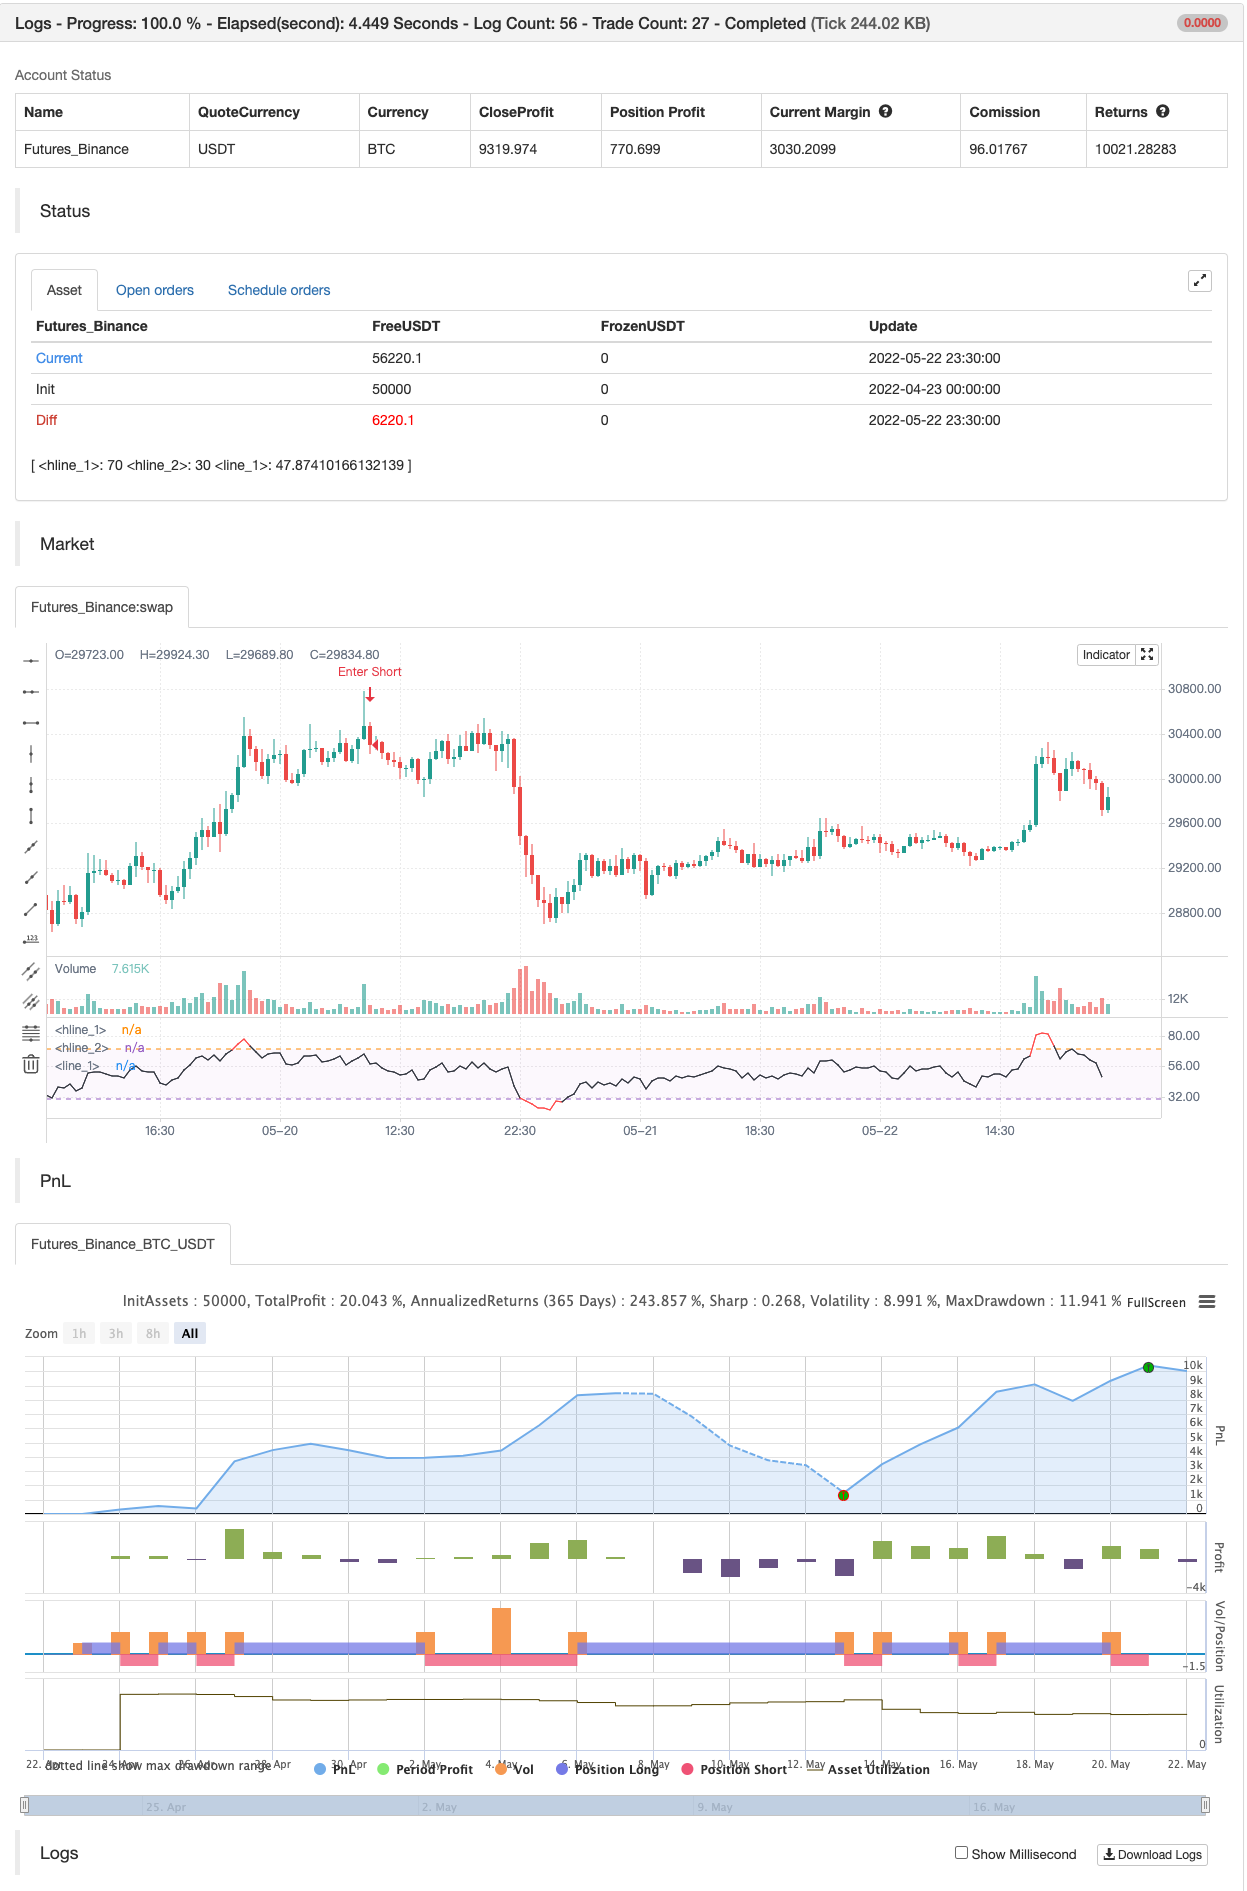
обратная проверка
//@version=4
// Copyright by Libertus - 2021
// RSI Divergences v3.2
// Free for private use
study(title="Relative Strength Index - Divergences - Libertus", shorttitle="RSI Div - Lib")
len = input(14, minval=1, title="RSI Length")
ob = input(defval=70, title="Overbought", type=input.integer, minval=0, maxval=100)
os = input(defval=30, title="Oversold", type=input.integer, minval=0, maxval=100)

// RSI code
rsi = rsi(close, len)
band1 = hline(ob)
band0 = hline(os)
plot(rsi, color=(rsi > ob or rsi < os ? color.new(color.red, 0) : color.new(color.black, 0)))
fill(band1, band0, color=color.new(color.purple, 97))

// DIVS code
piv = input(false,"Hide pivots?")
shrt = input(false,"Shorter labels?")
hidel = input(false, "Hide labels and color background")
xbars = input(defval=90, title="Div lookback period (bars)?", type=input.integer, minval=1)
hb = abs(highestbars(rsi, xbars)) // Finds bar with highest value in last X bars
lb = abs(lowestbars(rsi, xbars)) // Finds bar with lowest value in last X bars

// Defining variable values, mandatory in Pine 3
max = float(na)
max_rsi = float(na)
min = float(na)
min_rsi = float(na)
pivoth = bool(na)
pivotl = bool(na)
divbear = bool(na)
divbull = bool(na)

// If bar with lowest / highest is current bar, use it's value
max := hb == 0 ? close : na(max[1]) ? close : max[1]
max_rsi := hb == 0 ? rsi : na(max_rsi[1]) ? rsi : max_rsi[1]
min := lb == 0 ? close : na(min[1]) ? close : min[1]
min_rsi := lb == 0 ? rsi : na(min_rsi[1]) ? rsi : min_rsi[1]

// Compare high of current bar being examined with previous bar's high
// If curr bar high is higher than the max bar high in the lookback window range
if close > max // we have a new high
    max := close // change variable "max" to use current bar's high value
if rsi > max_rsi // we have a new high
    max_rsi := rsi // change variable "max_rsi" to use current bar's RSI value
if close < min // we have a new low
    min := close // change variable "min" to use current bar's low value
if rsi < min_rsi // we have a new low
    min_rsi := rsi // change variable "min_rsi" to use current bar's RSI value

// Finds pivot point with at least 2 right candles with lower value
pivoth := (max_rsi == max_rsi[2]) and (max_rsi[2] != max_rsi[3]) ? true : na
pivotl := (min_rsi == min_rsi[2]) and (min_rsi[2] != min_rsi[3]) ? true : na

// Detects divergences between price and indicator with 1 candle delay so it filters out repeating divergences
if (max[1] > max[2]) and (rsi[1] < max_rsi) and (rsi <= rsi[1])
    divbear := true
if (min[1] < min[2]) and (rsi[1] > min_rsi) and (rsi >= rsi[1])
    divbull := true

// Alerts
alertcondition(divbear, title='Bear div', message='Bear div')
alertcondition(divbull, title='Bull div', message='Bull div')
alertcondition(pivoth, title='Pivot high', message='Pivot high')
alertcondition(pivotl, title='Pivot low', message='Pivot low')

if divbull
    strategy.entry("Enter Long", strategy.long)
else if divbear
    strategy.entry("Enter Short", strategy.short)

// // Plots divergences and pivots with offest
// l = divbear ?
//       label.new (bar_index-1, rsi[1]+1, "BEAR", color=color.red, textcolor=color.white, style=label.style_labeldown, yloc=yloc.price, size=size.small) :
//       divbull ?
//           label.new (bar_index-1, rsi[1]-1, "BULL", color=color.green, textcolor=color.white, style=label.style_labelup, yloc=yloc.price, size=size.small) :
//           pivoth ?
//               label.new (bar_index-2, max_rsi+1, "PIVOT", color=color.blue, textcolor=color.white, style=label.style_labeldown, yloc=yloc.price, size=size.small) :
//               pivotl ?
//                   label.new (bar_index-2, min_rsi-1, "PIVOT", color=color.blue, textcolor=color.white, style=label.style_labelup, yloc=yloc.price, size=size.small) :
//                   na

// // Shorter labels
// if shrt
//     label.set_text (l, na)
// // Hides pivots or labels
// if (piv and (pivoth or pivotl)) or hidel
//     label.delete (l)
// // Colors indicator background
// bgcolor (hidel ? (divbear ? color.new(color.red, 50) : divbull ? color.new(color.green, 50) : na) : na, offset=-1)
// bgcolor (hidel ? (piv ? na : (pivoth or pivotl ? color.new(color.blue, 50) : na)) : na, offset=-2)

// Debug tools
// plot(max, color=blue, linewidth=2)
// plot(max_rsi, color=red, linewidth=2)
// plot(hb, color=orange, linewidth=2)
// plot(lb, color=purple, linewidth=1)
// plot(min_rsi, color=lime, linewidth=1)
// plot(min, color=black, linewidth=1)
Связанные
- MACD RSI Ichimoku Моментальный тренд после долгой стратегии
- Стратегия изменения направления РСИ
- Улучшенная стратегия торговли полосами Боллинджера
- Стратегия по переходу и импульсу
- Комплексная стратегия торговли скользящей средней и ИРС
- Стратегия по возвращению во вторник (фильтр выходных)
- Улучшенная стратегия перекрестного использования EMA с RSI/MACD/ATR
- Комбинированная долгосрочная стратегия торговли MACD и RSI
- Стратегия RSI2 Внутренний реверсивный выигрыш
- Многопоказательная тенденция в соответствии со стратегией
- Стратегия торговли AlphaTradingBot
Больше
- Стратегия Swing Hull/rsi/EMA
- Инструмент торговли Swing Scalping R1-4
- Лучшая стратегия поглощения + вырыва
- Bollinger Awesome Alert R1 (Боллинджер Удивительный предупреждение R1)
- Многобиржевые плагины
- Треугольная сверлительная ставка (прибыль от дефицита цен на малые валюты)
- bybit обратно-контрактная динамическая сетка ((специфическая сетка))
- Уведомления по системе TradingView на MT4 MT5 + динамические переменные
- Матричная серия
- Супер скальпер - 5 минут 15 минут
- Линейная регрессия ++
- RedK Dual VADER с энергетическими прутками
- Консолидационные зоны - живые
- Количественная качественная оценка
- Переключающаяся средняя перекрестная тревога, многочасовая тревога (MTF)
- СТРАТЕГИЯ перегрузки MACD
- Супертендирующие скользящие средние
- Торговля ABC
- 15 мин BTCUSDTPERP BOT
- Энтропия Шеннона V2