Стратегия разворота тренда на основе полос Боллинджера

Обзор
Эта стратегия основана на показателях и движущихся средних по Бринскому поясу, чтобы определить, является ли цена близкой к поясу Бринского пояса, чтобы сделать длинную или короткую позицию, чтобы получить прибыль. Когда цена прорывает пояса Бринского пояса, она смотрит вниз; когда цена падает вниз, она смотрит вверх.
Принципы
Эта стратегия основана на двух ключевых сигналах:
-
Многоголовый сигнал: когда цена закрытия касается нижней линии, и цена закрытия выше средней линии EMA, предыдущий объект K-линии является отрицательным, а текущий объект K-линии - положительным.
-
Пустой сигнал: когда цена закрытия касается верхней линии, и цена закрытия ниже средней линии EMA, предыдущий объект K-линии является солнечной линией, а текущий объект K-линии - отрицательной линией, пустота.
Стойкость: фиксированная стоп-стоп. Стоп-стоп - это коэффициент риска-возврата, который в несколько раз превышает отступ от стартовой цены до дистанции от противника.
Метод остановки: цель - выйти на ворота противника. Это означает, что вы делаете много остановок вниз, а пустые остановки вверх.
Преимущества
-
В сочетании с преимуществами трендовых и реверсивных стратегий, они лучше всего работают в условиях колебаний тренда.
-
Используйте индикатор Брин-Бенда, чтобы определить зоны перепродажи, чтобы точно определить вероятность обратного пути.
-
Фиксированные точки стоп-лосса устанавливаются разумно и помогают контролировать риск.
-
Мобильные блокировки позволяют максимизировать прибыль.
Риск
-
Поскольку в стратегиях прорыва есть риск арбитража, следует быть осторожным с поддельными прорывами.
-
В случае чрезмерного колебания ситуации, стоп-лоши могут часто вызываться.
-
Фиксированные стоп-лозы не могут корректироваться в зависимости от рыночных колебаний и могут быть слишком мягкими или слишком радикальными.
-
Если параметры Брин-пояса не будут установлены вовремя, то результат может оказаться весьма неудачным.
Оптимизация
-
Можно рассмотреть возможность фильтрации входящих сигналов с помощью комбинации RSI-индикаторов, например, RSI выше 50 - переделывание, RSI ниже 50 - переделывание, чтобы избежать ошибочного сигнала.
-
Добавлена функция автоматической корректировки фиксированной остановки, что делает остановку более гибкой. Например, динамическая настройка остановки в соответствии с показателями ATR.
-
Оптимизируйте параметры пояса Бурин, чтобы найти оптимальную комбинацию параметров.
-
Можно тестировать различные параметры средней линии EMA, оптимизируя эффект ограждения средней линии.
Подвести итог
Стратегия комплексно учитывает тенденцию и обратный ход, использует буринскую полосу для определения перекупа и перепродажи, чтобы максимизировать прибыль путем перемещения стопов. Лучше всего работать в условиях колебаний тенденции. Однако следует обратить внимание на то, чтобы предотвратить попадание, а также на то, чтобы корректировать параметры оптимизации эффективности стратегии.
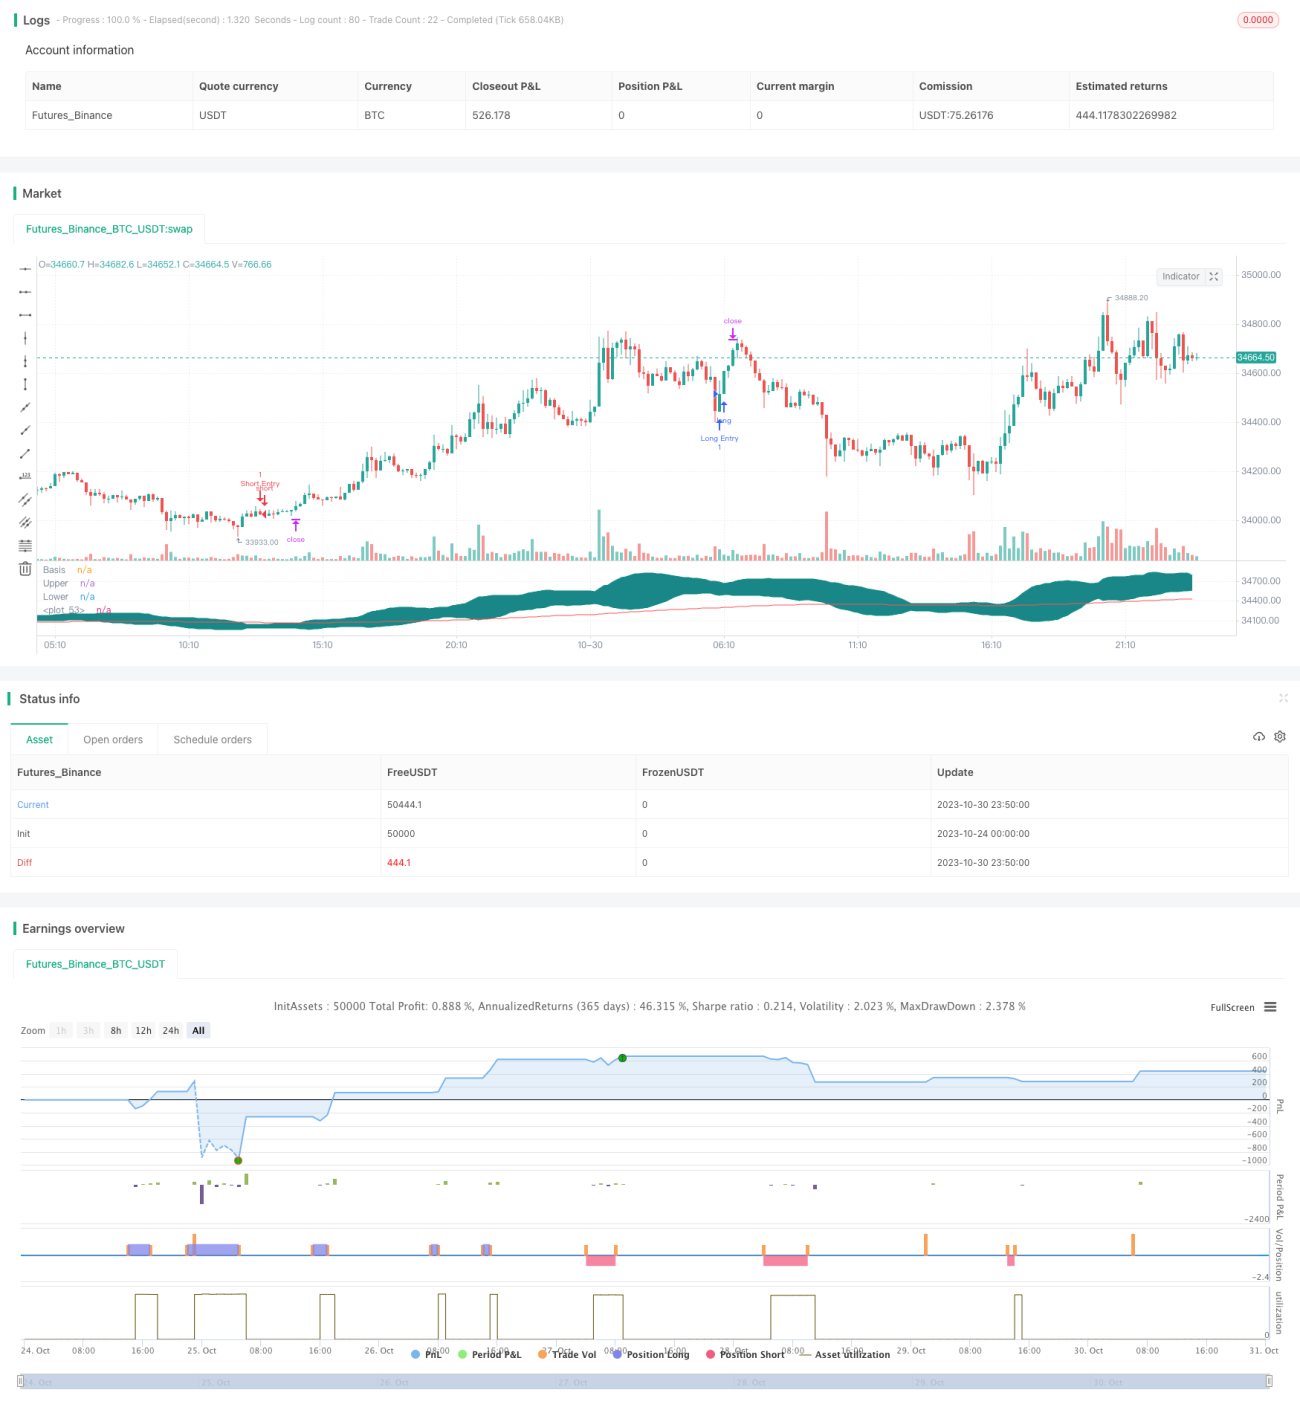
/*backtest
start: 2023-10-24 00:00:00
end: 2023-10-31 00:00:00
period: 10m
basePeriod: 1m
exchanges: [{"eid":"Futures_Binance","currency":"BTC_USDT"}]
*/

//@version=4

// Welcome to yet another script. This script was a lot easier since I was stuck for so long on the Donchian Channels one and learned so much from that one that I could use in this one
// This code should be a lot cleaner compared to the Donchian Channels, but we'll leave that up to the pro's- 1