Динамическая фильтрация количественной торговой стратегии
Обзор стратегии
Эта стратегия, названная “Динамическая стратегия количественного трейдинга с фильтром”, основное использование диапазона фильтра в сочетании с несколькими техническими показателями, для автоматизированной торговли с отслеживанием тенденций на криптовалюте BTCUSDT. Стратегия применима для высокочастотного количественного трейдинга, для блокировки прибыли и снижения отказов путем динамического регулирования стоп-лосса.
Стратегический принцип
Основным показателем стратегии является диапазонный фильтр, который создает среднюю линию, основанную на диапазоне изменений в статистической цене. Кроме того, стратегия использует RSI для определения перепродажи, среднюю линию для определения тенденции, MACD для определения динамики и другие показатели для комбинированной фильтрации, чтобы создать более надежный торговый сигнал.
В частности, средняя линия диапазона фильтра диапазона получается в зависимости от показателя скользящего среднего значения диапазона изменения цены, а направление определяется в зависимости от силы и скорости прорыва этой средней линии. Сильный сигнал прорыва создается, когда цена прорывает среднюю линию на несколько последовательных K-линий.
RSI используется для определения состояния перепродажи и перекупки, чтобы подтвердить сигнал фильтра. Если средняя линия идет вверх, она определяется как тенденция вверх, а если она идет вниз, она определяется как тенденция вниз. MACD определяет, достаточно ли движения рынка для формирования тенденции.
В совокупности эти показатели позволяют выявить более надежные прорывы в тренде как время для создания позиций.
Анализ преимуществ
Наибольшим преимуществом этой стратегии является объединение нескольких показателей для принятия решений, а не зависимость от одного технического показателя, что позволяет эффективно снизить вероятность ошибочных сделок и обеспечить более надежный торговый сигнал. Кроме того, динамические параметры корректировки также позволяют стратегии адаптироваться к изменениям рынка.
Еще одним преимуществом является возможность проведения высокочастотных торгов. Показатели диапазона фильтров чувствительны к небольшим циклическим изменениям цен, что означает, что стратегия может открывать мирные позиции в более короткие сроки, поэтому очень подходит для высокой частоты и позволяет получать прибыль на более высоких колебаниях криптовалютного рынка.
Анализ рисков
Существуют определенные риски, связанные с этой стратегией. Во-первых, есть риск того, что техническое суждение будет неэффективным, поскольку индикаторы не могут быть полностью уверены в движении цены.
Другой основной риск заключается в том, что средняя линия диапазона фильтра не может полностью отфильтровывать колебания цены. Когда возникают колебания цены, превышающие диапазон средней линии, средняя линия будет недействительна, что приводит к риску создания ошибочного сигнала. В этом случае параметры могут быть соответствующим образом ослаблены, расширяя диапазон средней линии.
В конце концов, высокая частота торговли также сопряжена с определенным риском. Когда частота торговли слишком высока, торговые расходы могут быть большими и могут компенсировать часть прибыли. В этом случае можно соответственно уменьшить частоту торговли и время удержания позиций.
Оптимизация стратегии
Существует еще много возможностей для дальнейшей оптимизации этой стратегии. Например, можно рассмотреть возможность объединения большего количества показателей, таких как признание тенденции показателями волатильности, внедрение более строгих условий фильтрации, чтобы гарантировать более точный торговый сигнал. Или изучение закономерностей ценового поведения различных криптовалют и акций, чтобы установить наиболее подходящие для них параметры показателя.
С точки зрения логики торговли, можно также установить динамическую остановку убытков и остановку прибыли. Это означает, что при увеличении объема позиции можно расширить пределы убытков, чтобы закрепить больше прибыли. Или ускорить остановку прибыли. Это может в некоторой степени уменьшить отказ.
Наконец, можно оптимизировать параметры фильтра, чтобы найти набор параметров, позволяющих среднему диапазону эффективно отфильтровывать колебания, а также по возможности улавливать переломные моменты. Это требует большого количества обратных данных для итерационного анализа.
Подвести итог
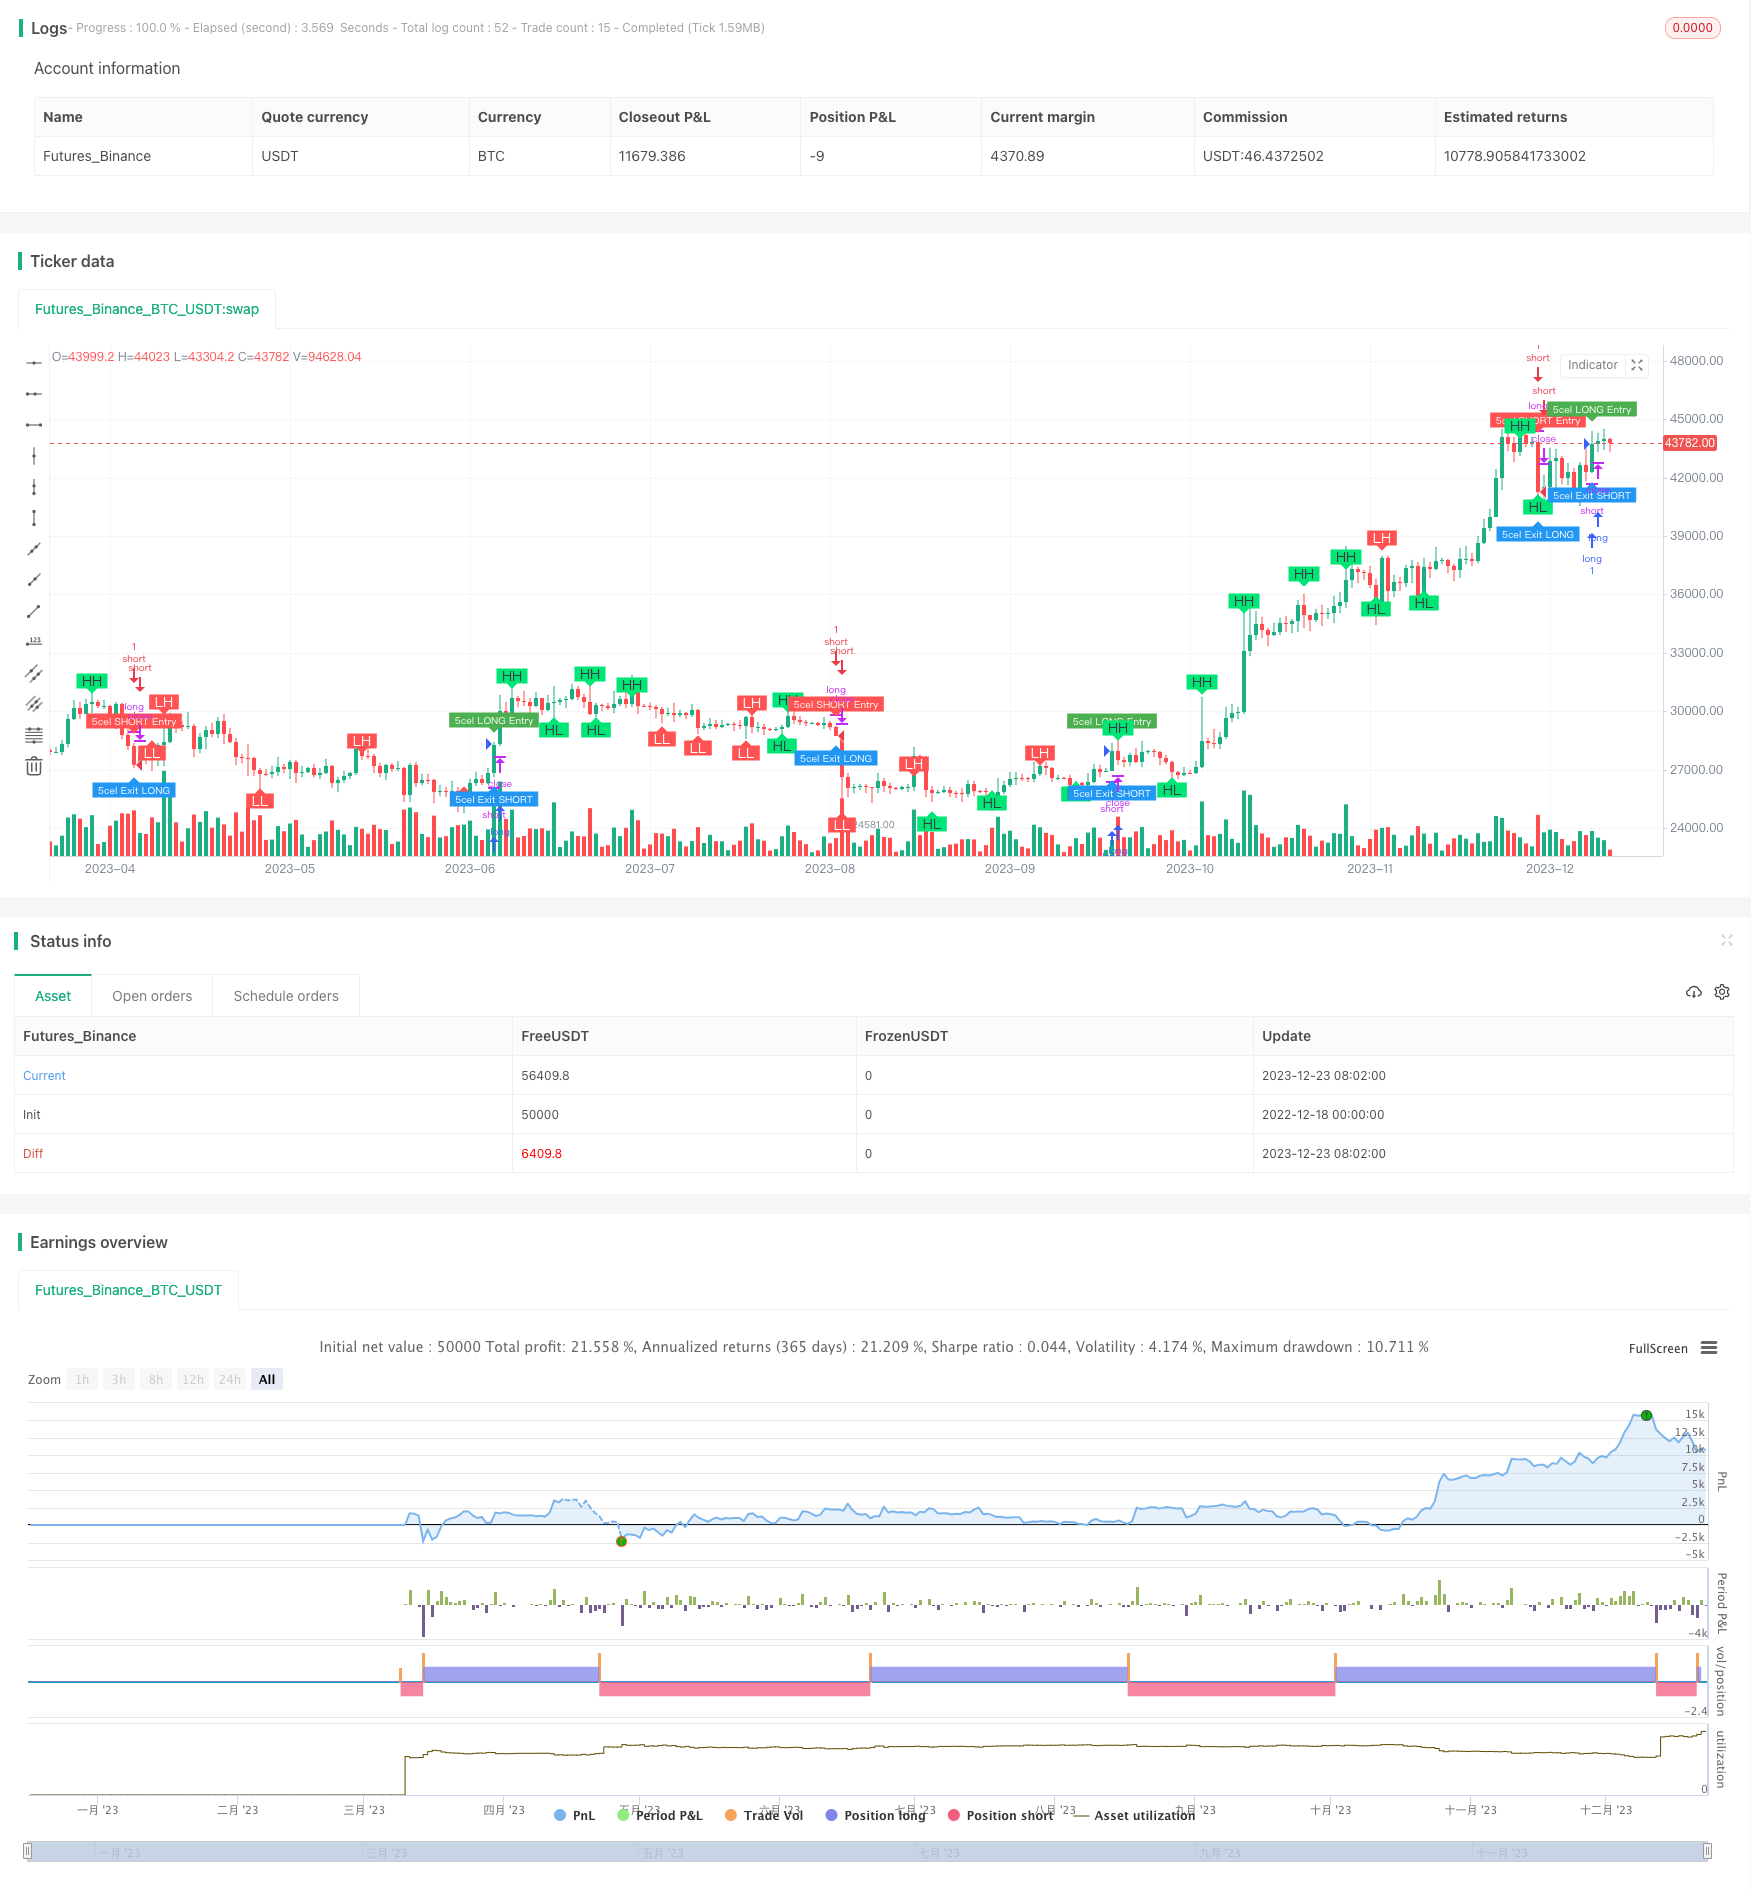
Эта стратегия успешно объединяет различные показатели, чтобы судить, формируя высоконадежную торговую стратегию, подходящую для использования в высокочастотных количественных сделках. После постоянной оптимизации и улучшения, мы считаем, что можно получить стабильную прибыль, которая заслуживает дальнейшей разработки.
/*backtest
start: 2022-12-18 00:00:00
end: 2023-12-24 00:00:00
period: 1d
basePeriod: 1h
exchanges: [{"eid":"Futures_Binance","currency":"BTC_USDT"}]
*/

//@version=5
strategy(title='5cel Scalp Strategy BTCUSDT Long & Short 30 Min', shorttitle='BTCUSDT Long & Short Scalp 30m', precision=1, overlay=true)

//Swing Call - Based on RSI Overbought & Oversold
//#### Starts Here #####
ema_value = input(5)
sma_value = input(50)
ema1 = ta.ema(close, ema_value)
sma2 = ta.sma(close, sma_value)
rs = ta.rsi(close, 14)

iff_1 = high < sma2 ? color.red : color.yellow
iff_2 = low > sma2 ? color.lime : iff_1
mycolor = rs >= 85 or rs <= 15 ? color.yellow : iff_2

//For Main Strategy
bool swingCallGreen = false
bool swingCallRed = false
bool swingCallYellow = false

if rs >= 85 or rs <= 15
    //color.yellow
    swingCallGreen := false
    swingCallRed := false
    swingCallYellow := true
    swingCallYellow
else
    if low > sma2
        //color.lime
        swingCallGreen := true
        swingCallRed := false
        swingCallYellow := false
        swingCallYellow
        //color.red
    else if high < sma2
        swingCallGreen := false
        swingCallRed := true
        swingCallYellow := false
        swingCallYellow
    else
        //color.yellow
        swingCallGreen := false
        swingCallRed := false
        swingCallYellow := true
        swingCallYellow

hlong = input.int(80, title='Overbought limit of RSI', step=1)
ll = input.int(20, title='Oversold limit of RSI', step=1)

buyexit = ta.crossunder(rs, hlong)
sellexit = ta.crossover(rs, ll)

sellcall = ta.crossover(sma2, ema1) and open > close
buycall = ta.crossunder(sma2, ema1) and high > sma2
//#### Ends Here #####


//Parabolic SAR -  Trend Circles
//#### Starts Here #####
start = input.int(2, minval=0, maxval=10, title='Start - Default = 2 - Multiplied by .01')
increment = input.int(2, minval=0, maxval=10, title='Step Setting (Sensitivity) - Default = 2 - Multiplied by .01')
maximum = input.int(2, minval=1, maxval=10, title='Maximum Step (Sensitivity) - Default = 2 - Multiplied by .10')
sus = input(true, 'Show Up Trending Parabolic Sar')
sds = input(true, 'Show Down Trending Parabolic Sar')
disc = input(false, title='Start and Step settings are *.01 so 2 = .02 etc, Maximum Step is *.10 so 2 = .2')

startCalc = start * .01
incrementCalc = increment * .01
maximumCalc = maximum * .10

sarUp = ta.sar(startCalc, incrementCalc, maximumCalc)
sarDown = ta.sar(startCalc, incrementCalc, maximumCalc)

colUp = close >= sarDown ? color.lime : na
colDown = close <= sarUp ? color.red : na

parabolicSARGreen = ta.sar(startCalc, incrementCalc, maximumCalc)
parabolicSARRed = ta.sar(startCalc, incrementCalc, maximumCalc)
//#### Ends Here #####


//EMA Line
//#### Starts Here #####
ema100 = ta.ema(close, 100)
//#### Ends Here #####


// Ichimoku Cloud
//#### Starts Here #####
sCloud = input(false, 'Show Ichimoku lines')

// Colors
colorGreen = #00ff00
colorRed = #ff0000
colorTenkanViolet = #9400D3
colorKijun = #fdd8a0
colorLime = #006400
colorMaroon = #8b0000

//Periods are set to standard
tenkanPeriods = input.int(9, minval=1, title='Tenkan')
kijunPeriods = input.int(26, minval=1, title='Kijun')
chikouPeriods = input.int(52, minval=1, title='Chikou')
displacement = input.int(26, minval=1, title='Offset')

donchian(len) =>
    math.avg(ta.lowest(len), ta.highest(len))

tenkan = donchian(tenkanPeriods)
kijun = donchian(kijunPeriods)
senkouA = math.avg(tenkan, kijun)
senkouB = donchian(chikouPeriods)
displacedSenkouA = senkouA[displacement]
displacedSenkouB = senkouB[displacement]

bullishSignal = ta.crossover(tenkan, kijun)
bearishSignal = ta.crossunder(tenkan, kijun)

bullishSignalValues = bullishSignal ? tenkan : na
bearishSignalValues = bearishSignal ? tenkan : na


strongBullishSignal = bullishSignalValues > displacedSenkouA and bullishSignalValues > displacedSenkouB
neutralBullishSignal = bullishSignalValues > displacedSenkouA and bullishSignalValues < displacedSenkouB or bullishSignalValues < displacedSenkouA and bullishSignalValues > displacedSenkouB
weakBullishSignal = bullishSignalValues < displacedSenkouA and bullishSignalValues < displacedSenkouB

strongBearishSignal = bearishSignalValues < displacedSenkouA and bearishSignalValues < displacedSenkouB
neutralBearishSignal = bearishSignalValues > displacedSenkouA and bearishSignalValues < displacedSenkouB or bearishSignalValues < displacedSenkouA and bearishSignalValues > displacedSenkouB
weakBearishSignal = bearishSignalValues > displacedSenkouA and bearishSignalValues > displacedSenkouB
//#### Ends Here #####


//Higher High Lower Low Strategy
//#### Starts Here #####
lb = input.int(5, title='Left Bars', minval=1)
rb = input.int(5, title='Right Bars', minval=1)
showsupres = input.bool(true, title='Support/Resistance', inline='srcol')
supcol = input.color(color.lime, title='', inline='srcol')
rescol = input.color(color.red, title='', inline='srcol')
// srlinestyle = input.string(line.style_dotted, title='Line Style/Width', options=[line.style_solid, line.style_dashed, line.style_dotted], inline='style')
srlinewidth = input.int(3, title='', minval=1, maxval=5, inline='style')
changebarcol = input.bool(true, title='Change Bar Color', inline='bcol')
bcolup = input.color(color.blue, title='', inline='bcol')
bcoldn = input.color(color.black, title='', inline='bcol')

ph = ta.pivothigh(lb, rb)
pl = ta.pivotlow(lb, rb)

iff_3 = pl ? -1 : na  // Trend direction
hl = ph ? 1 : iff_3
iff_4 = pl ? pl : na  // similar to zigzag but may have multiple highs/lows
zz = ph ? ph : iff_4
valuewhen_1 = ta.valuewhen(hl, hl, 1)
valuewhen_2 = ta.valuewhen(zz, zz, 1)
zz := pl and hl == -1 and valuewhen_1 == -1 and pl > valuewhen_2 ? na : zz
valuewhen_3 = ta.valuewhen(hl, hl, 1)
valuewhen_4 = ta.valuewhen(zz, zz, 1)
zz := ph and hl == 1 and valuewhen_3 == 1 and ph < valuewhen_4 ? na : zz

valuewhen_5 = ta.valuewhen(hl, hl, 1)
valuewhen_6 = ta.valuewhen(zz, zz, 1)
hl := hl == -1 and valuewhen_5 == 1 and zz > valuewhen_6 ? na : hl
valuewhen_7 = ta.valuewhen(hl, hl, 1)
valuewhen_8 = ta.valuewhen(zz, zz, 1)
hl := hl == 1 and valuewhen_7 == -1 and zz < valuewhen_8 ? na : hl
zz := na(hl) ? na : zz

findprevious() =>  // finds previous three points (b, c, d, e)
    ehl = hl == 1 ? -1 : 1
    loc1 = 0.0
    loc2 = 0.0
    loc3 = 0.0
    loc4 = 0.0
    xx = 0
    for x = 1 to 1000 by 1
        if hl[x] == ehl and not na(zz[x])
            loc1 := zz[x]
            xx := x + 1
            break
    ehl := hl
    for x = xx to 1000 by 1
        if hl[x] == ehl and not na(zz[x])
            loc2 := zz[x]
            xx := x + 1
            break
    ehl := hl == 1 ? -1 : 1
    for x = xx to 1000 by 1
        if hl[x] == ehl and not na(zz[x])
            loc3 := zz[x]
            xx := x + 1
            break
    ehl := hl
    for x = xx to 1000 by 1
        if hl[x] == ehl and not na(zz[x])
            loc4 := zz[x]
            break
    [loc1, loc2, loc3, loc4]

float a = na
float b = na
float c = na
float d = na
float e = na
if not na(hl)
    [loc1, loc2, loc3, loc4] = findprevious()
    a := zz
    b := loc1
    c := loc2
    d := loc3
    e := loc4

_hh = zz and a > b and a > c and c > b and c > d
_ll = zz and a < b and a < c and c < b and c < d
_hl = zz and (a >= c and b > c and b > d and d > c and d > e or a < b and a > c and b < d)
_lh = zz and (a <= c and b < c and b < d and d < c and d < e or a > b and a < c and b > d)

plotshape(_hl, text='HL', title='Higher Low', style=shape.labelup, color=color.new(color.lime, 0), textcolor=color.new(color.black, 0), location=location.belowbar, offset=-rb)
plotshape(_hh, text='HH', title='Higher High', style=shape.labeldown, color=color.new(color.lime, 0), textcolor=color.new(color.black, 0), location=location.abovebar, offset=-rb)
plotshape(_ll, text='LL', title='Lower Low', style=shape.labelup, color=color.new(color.red, 0), textcolor=color.new(color.white, 0), location=location.belowbar, offset=-rb)
plotshape(_lh, text='LH', title='Lower High', style=shape.labeldown, color=color.new(color.red, 0), textcolor=color.new(color.white, 0), location=location.abovebar, offset=-rb)

float res = na
float sup = na
res := _lh ? zz : res[1]
sup := _hl ? zz : sup[1]

int trend = na
iff_5 = close < sup ? -1 : nz(trend[1])
trend := close > res ? 1 : iff_5

res := trend == 1 and _hh or trend == -1 and _lh ? zz : res
sup := trend == 1 and _hl or trend == -1 and _ll ? zz : sup
rechange = res != res[1]
suchange = sup != sup[1]

var line resline = na
var line supline = na
//#### Ends Here #####


//Range Filter 5Min
//#### Starts Here #####

src = input(defval=close, title='Source')
per = input.int(defval=100, minval=1, title='Sampling Period')

// Range Multiplier
mult = input.float(defval=3.0, minval=0.1, title='Range Multiplier')

// Smooth Average Range
smoothrng(x, t, m) =>
    wper = t * 2 - 1
    avrng = ta.ema(math.abs(x - x[1]), t)
    smoothrng = ta.ema(avrng, wper) * m
    smoothrng
smrng = smoothrng(src, per, mult)

// Range Filter
rngfilt(x, r) =>
    rngfilt = x
    rngfilt := x > nz(rngfilt[1]) ? x - r < nz(rngfilt[1]) ? nz(rngfilt[1]) : x - r : x + r > nz(rngfilt[1]) ? nz(rngfilt[1]) : x + r
    rngfilt
filt = rngfilt(src, smrng)

// Filter Direction
upward = 0.0
upward := filt > filt[1] ? nz(upward[1]) + 1 : filt < filt[1] ? 0 : nz(upward[1])
downward = 0.0
downward := filt < filt[1] ? nz(downward[1]) + 1 : filt > filt[1] ? 0 : nz(downward[1])

// Target Bands
hband = filt + smrng
lband = filt - smrng

// Colors
filtcolor = upward > 0 ? color.lime : downward > 0 ? color.red : color.orange
barcolor = src > filt and src > src[1] and upward > 0 ? color.lime : src > filt and src < src[1] and upward > 0 ? color.green : src < filt and src < src[1] and downward > 0 ? color.red : src < filt and src > src[1] and downward > 0 ? color.maroon : color.orange

// Break Outs
longCond = bool(na)
shortCond = bool(na)
longCond := src > filt and src > src[1] and upward > 0 or src > filt and src < src[1] and upward > 0
shortCond := src < filt and src < src[1] and downward > 0 or src < filt and src > src[1] and downward > 0

CondIni = 0
CondIni := longCond ? 1 : shortCond ? -1 : CondIni[1]
longCondition = longCond and CondIni[1] == -1
shortCondition = shortCond and CondIni[1] == 1
//#### Ends Here #####


//#### Starts Here #####
source = close
useCurrentRes = input(true, title='Use Current Chart Resolution?')
resCustom = input.timeframe(title='Use Different Timeframe? Uncheck Box Above', defval='60')
smd = input(true, title='Show MacD & Signal Line? Also Turn Off Dots Below')
sd = input(true, title='Show Dots When MacD Crosses Signal Line?')
sh = input(true, title='Show Histogram?')
macd_colorChange = input(true, title='Change MacD Line Color-Signal Line Cross?')
hist_colorChange = input(true, title='MacD Histogram 4 Colors?')

res1 = useCurrentRes ? timeframe.period : resCustom

fastLength = input.int(12, minval=1)
slowLength = input.int(26, minval=1)
signalLength = input.int(9, minval=1)

fastMA = ta.ema(source, fastLength)
slowMA = ta.ema(source, slowLength)

macd = fastMA - slowMA
signal = ta.sma(macd, signalLength)
hist = macd - signal

outMacD = request.security(syminfo.tickerid, res1, macd)
outSignal = request.security(syminfo.tickerid, res1, signal)
outHist = request.security(syminfo.tickerid, res1, hist)

histA_IsUp = outHist > outHist[1] and outHist > 0
histA_IsDown = outHist < outHist[1] and outHist > 0
histB_IsDown = outHist < outHist[1] and outHist <= 0
histB_IsUp = outHist > outHist[1] and outHist <= 0

//MacD Color Definitions
macd_IsAbove = outMacD >= outSignal
macd_IsBelow = outMacD < outSignal

plot_color = hist_colorChange ? histA_IsUp ? color.aqua : histA_IsDown ? color.blue : histB_IsDown ? color.red : histB_IsUp ? color.maroon : color.yellow : color.gray
macd_color = macd_colorChange ? macd_IsAbove ? color.lime : color.red : color.red
signal_color = macd_colorChange ? macd_IsAbove ? color.yellow : color.yellow : color.lime

circleYPosition = outSignal
//#### Ends Here #####


//////////////////
// Main Strategy
/////////////////
//#### Starts Here #####
var bottomText = 'Something is not ok'

bool rangeBuy = false
if longCondition
    rangeBuy := true
else
    rangeBuy := false

bool rangeSell = false
if shortCondition
    rangeSell := true
else
    rangeSell := false

bool ema100Bullish = false
bool ema100Bearish = false
bool ichimokuBearish = false
bool ichimokuBullish = false
string statusChance = 'Who knows what will happen'
string futureIchimokuTrend = 'Anything can happen'

if close > ema100
    ema100Bullish := true
    ema100Bearish := false
else
    ema100Bullish := false
    ema100Bearish := true

if displacedSenkouA > displacedSenkouB
    ichimokuBearish := false
    futureIchimokuTrend := 'Green - chance to go up'
    ichimokuBullish := true
else
    ichimokuBearish := true
    futureIchimokuTrend := 'Red - chance to go down'
    ichimokuBullish := false
    ichimokuBullish

if ema100Bullish and parabolicSARGreen
    if ichimokuBullish
        statusChance := '100%'
    else
        statusChance := '95%'
else
    if ema100Bullish and parabolicSARRed
        statusChance := '75%'
    else if ema100Bearish and parabolicSARGreen
        statusChance := '65%'
    else
        statusChance := '55%'

bool longTradePosition = false
bool shortTradePosition = false
string longTradeText = 'Now cannot say anything'

if (swingCallGreen or swingCallYellow) and ichimokuBullish and longCondition and ema100Bullish and parabolicSARGreen
    longTradePosition := true
    longTradeText := 'Bullish'

bottomText := longTradeText + ' Chance: ' + statusChance + '\n Future Trend: ' + futureIchimokuTrend
// Bottom Text

var tLog = table.new(position=position.bottom_right, rows=1, columns=2, bgcolor=color.blue, border_width=1)
table.cell(tLog, row=0, column=0, text=bottomText, text_color=color.white)
table.cell_set_text(tLog, row=0, column=0, text=bottomText)
//#### Ends Here #####

bool entryLongPosition = false
bool exitLongPosition = false

bool entryShortPosition = false
bool exitShortPosition = false

bool longPositionCount = false
bool shortPositionCount = false


if (strategy.position_size > 0)
    longPositionCount := true

if (strategy.position_size < 0)
    shortPositionCount := true

// Entry LONG
if (longCondition) and (not longPositionCount)
    entryLongPosition := true

// Exit LONG
if (shortCondition) and (longPositionCount)
    exitLongPosition := true

// Entry SHORT
if (shortCondition) and (not shortPositionCount)
    entryShortPosition := true

// Exit SHORT
if (longCondition) and (shortPositionCount)
    exitShortPosition := true

// LONG Entry & Exit
plotshape(entryLongPosition, style=shape.labeldown, location=location.abovebar, color=color.new(color.green, 0), size=size.tiny, title='buy label', text='5cel\nLONG Entry', textcolor=color.new(color.white, 0))
plotshape(exitLongPosition, style=shape.labelup, location=location.belowbar, color=color.new(color.blue, 0), size=size.tiny, title='sell label', text='5cel\nExit LONG', textcolor=color.new(color.white, 0))

//SHORT Entry & Exit
plotshape(entryShortPosition, style=shape.labeldown, location=location.abovebar, color=color.new(color.red, 0), size=size.tiny, title='buy label', text='5cel\nSHORT Entry', textcolor=color.new(color.white, 0))
plotshape(exitShortPosition, style=shape.labelup, location=location.belowbar, color=color.new(color.blue, 0), size=size.tiny, title='sell label', text='5cel\nExit SHORT', textcolor=color.new(color.white, 0))

//Get the Current Value
heikinashi_close = request.security(ticker.heikinashi(syminfo.tickerid), timeframe.period, close)

if entryLongPosition
    longLabel = label.new(bar_index, high, text=str.tostring(heikinashi_close, '0.00'), color=color.orange, style=label.style_label_down, yloc=yloc.abovebar)

if entryShortPosition
    shortLabel = label.new(bar_index, high, text=str.tostring(heikinashi_close, '0.00'), color=color.orange, style=label.style_label_down, yloc=yloc.abovebar)

/// SHORT Exit
strategy.close("short", when=exitShortPosition, comment="close_short_position")

/// LONG Exit
strategy.close("long", when=exitLongPosition, comment = "close_long_position")

/// LONG Enter
strategy.entry("long", strategy.long, when=entryLongPosition, comment="open_long_position")

/// SHORT Enter
strategy.entry("short", strategy.short, when = entryShortPosition, comment="open_short_position")