بیک ٹسٹنگ- اشارے
مصنف:چاؤ ژانگ، تاریخ: 2022-05-17 13:59:05ٹیگز:ای ایم اے
کسی بھی دلچسپی رکھنے والے کے لئے ، یہاں ایک مثال ہے کہ کس طرح بیک ٹیسٹنگ کے نتائج کو اشارے میں ڈالنا ہے۔ یہ وہی اقدار کا حساب لگاتا ہے جو آپ کو بلٹ ان اسٹریٹیجی بیک ٹیسٹر کی خلاصہ اسکرین میں ملتی ہے۔ اس میں معیاری بیک ٹیسٹر کے طور پر اسی نتائج کے سائز کا استعمال کیا جائے گا یعنی 5 منٹ کا چارٹ تقریبا 1 ماہ کے اعداد و شمار ، 1 منٹ کا چارٹ 1 ہفتہ کے اعداد و شمار وغیرہ کو پکڑتا ہے۔ میں نے اس کو زیادہ سے زیادہ خود مختار رکھنے کی کوشش کی لہذا میں نے نتائج کے لئے زیادہ تر کوڈ کو اشارے کے نچلے حصے میں ڈال دیا۔ نتائج آخری مکمل تجارتی سگنل پر رک جاتے ہیں یعنی خریدنے میں اس میں فروخت ہوتی ہے۔ یہ وہی اشارہ ہے جو میں نے پی سی ٹی ٹریلنگ اسٹاپ لاس کے ساتھ پہلے پوسٹ کیا تھا لہذا آپ کو یہ کوڈ یہاں بھی نظر آئے گا۔ جیسا کہ میں نے اپنی پچھلی پوسٹ میں کہا تھا ، اشارے میں صرف ایک آسان EMA ہے تاکہ اس کو کچھ مفید مل سکے اور میں اس اشارے کو اپنی ہی اشارے پر استعمال کرنے کی سفارش نہیں کروں گا ، لیکن اگر آپ اس کی بجائے اس کوڈ
اضافی نوٹ:
- نتائج حقیقت یہ ہے کہ اشارے کی حکمت عملی Backtester میں کی طرح اصل تجارت کے مقابلے میں خرید اور فروخت سگنل واقع جب کی بنیاد پر حساب کرنے کے لئے ہے کہ کی وجہ سے ایک قابل قبول غلطی کے مارجن کے اندر اندر ہیں
- میں استعمال کرنے کے لئے خرید سگنلز کی تعداد مقرر کرنے کا ایک طریقہ تلاش کرنے کی کوشش کر رہا تھا یعنی مجھے گزشتہ 100 تجارتوں کے نتائج دکھائیں لیکن منطق کو ترتیب نہیں دے سکا۔ میں تجاویز کے لئے کھلا ہوں۔ یہ بھی ذہن میں رکھیں کہ میں پیشے کے لحاظ سے کوڈر نہیں ہوں لہذا اگر آپ کے پاس اس محاذ پر کوئی نظریات ہیں تو ، براہ کرم مجھے اس کی وضاحت کریں جیسے میں 5 سال کا بچہ ہوں اور اگر ممکن ہو تو کوڈ کی مثالیں فراہم کریں :)
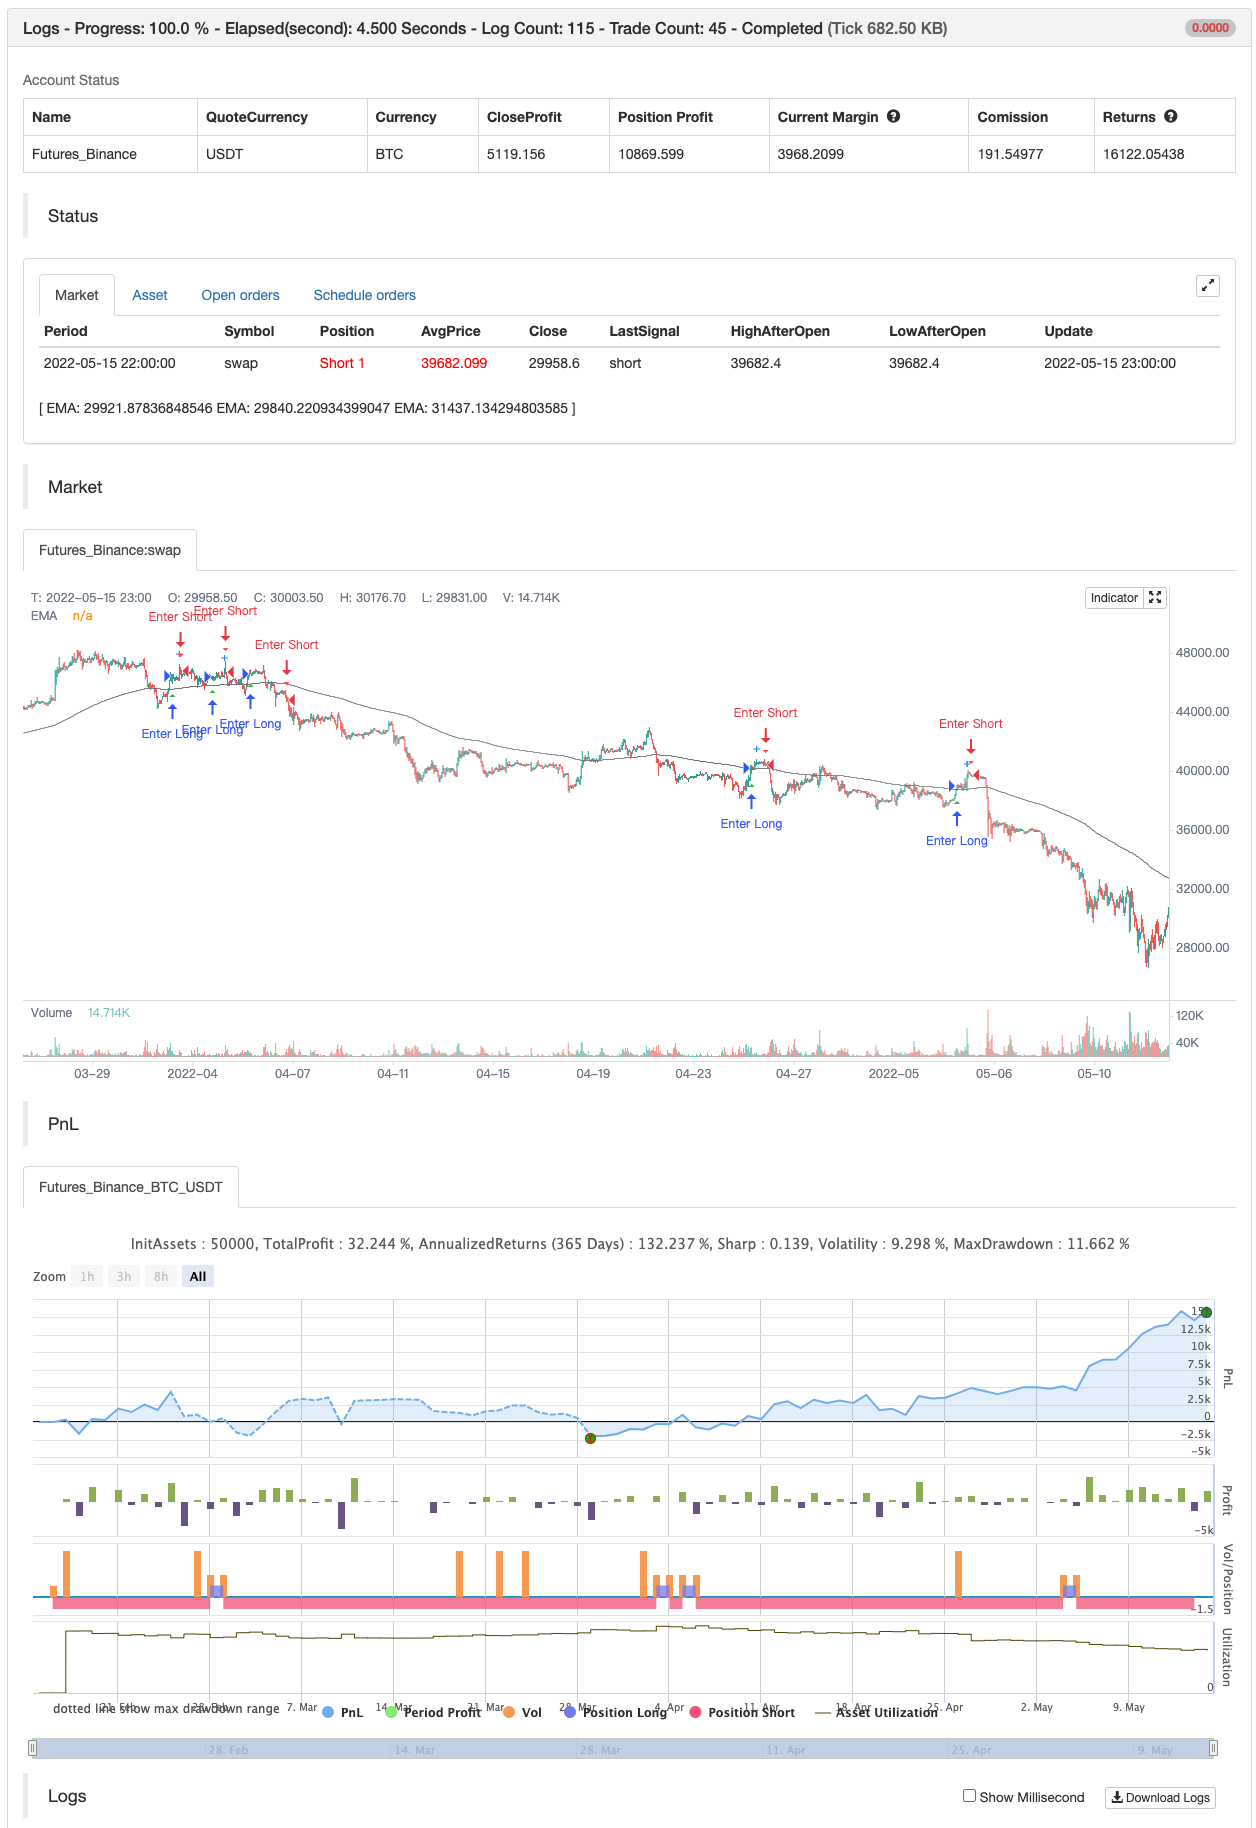
- میں نے اسٹریٹیجی کے نتائج کو اسکرین شاٹس میں شامل کیا تاکہ آپ دیکھ سکیں کہ نتائج کہاں کھڑے ہیں۔ اضافی اضافی نوٹ: یہ مالی مشورہ نہیں ہے۔ اپنے خطرے پر استعمال کریں۔
بیک ٹسٹ
/*backtest
start: 2022-02-16 00:00:00
end: 2022-05-16 00:00:00
period: 1h
basePeriod: 15m
exchanges: [{"eid":"Futures_Binance","currency":"BTC_USDT"}]
*/

// This source code is subject to the terms of the Mozilla Public License 2.0 at https://mozilla.org/MPL/2.0/
// © Thumpyr
//@version=5

/////////////////////////////////////////////////////////////////////////////////////////////
// Comment out Strategy Line and remove // from Indicator line to turn into Indicator  //////
// Do same for alertConidction at bottom                                               //////
/////////////////////////////////////////////////////////////////////////////////////////////
//strategy("Backtesting-Strategy", shorttitle="Backtesting- Strategy", overlay=true, margin_long=100, margin_short=100, default_qty_type=strategy.percent_of_equity,default_qty_value=90, commission_type=strategy.commission.percent, commission_value=.075)
indicator(title="Backtesting- Indicator", shorttitle="Backtesting - Indicator", overlay=true)//


openBalance  =input.float(3000, minval=0, title="Opening Balance:", group="Back Test")
pctAllocated =input.float(.9, minval=0, title="Allocated % (90% = .9):", group="Back Test")
commission   =input.float(.075, minval=0, title="Commission%", group="Back Test")


sellLow=input.float(.035, minval=0, title="Stop Loss Loss: 1% = .01", group="Sell Settings")
trailStopArm=input.float(.0065, minval=0, title="Trailing Stop Arm: 1%=.01", group="Sell Settings")
trailStopPct=input.float(.003, minval=0, title="Trailing Stop Trigger: 1%=.01 ", group="Sell Settings")

/////////////////////////////////////////////////
//               Indicators                    //
/////////////////////////////////////////////////
ema1Len = input.int(14, minval=1, title=" ema 1 Length", group="Trend Line Settings")
ema1Src = input(close, title="ema 1 Source", group="Trend Line Settings")
ema1 = ta.ema(ema1Src, ema1Len)
plot(ema1, title="EMA", color=color.blue)

ema2Len = input.int(22, minval=1, title=" ema 2 Length", group="Trend Line Settings")
ema2Src = input(close, title="ema 2 Source", group="Trend Line Settings")
ema2 = ta.ema(ema2Src, ema2Len)
plot(ema2, title="EMA", color=color.orange)

ema3Len = input.int(200, minval=1, title=" ema 3 Length", group="Trend Line Settings")
ema3Src = input(close, title="ema 2 Source", group="Trend Line Settings")
ema3 = ta.ema(ema3Src, ema3Len)
plot(ema3, title="EMA", color=color.gray)


/////////////////////////////
////   Buy Conditions    ////
/////////////////////////////

alertBuy = ta.crossover(ema1,ema2) and close>ema3

////////////////////////////////////////////////////////////////////
////   Filter redundant Buy Signals if Sell has not happened    ////
////////////////////////////////////////////////////////////////////
var lastsignal = 0
showAlertBuy   = 0
if(alertBuy and lastsignal != 1)
    showAlertBuy           := 1
    lastsignal             := 1
buyAlert= showAlertBuy     > 0

var buyActive = 0
if  buyAlert
    buyActive :=1

//////////////////////////////////////////////////////////////////
////          Track Conditions at buy Signal                  ////
//////////////////////////////////////////////////////////////////

alertBuyValue = ta.valuewhen(buyAlert, close,0)
alertSellValueLow = alertBuyValue - (alertBuyValue*sellLow)

////////////////////////////////////////////////////////////
/////            Trailing Stop                         /////
////////////////////////////////////////////////////////////
var TSLActive       = 0         //Check to see if TSL has been activated
var TSLTriggerValue = 0.0 //Initial and climbing value of TSL
var TSLStop         = 0.0       //Sell Trigger
var TSLRunning      = 0       //Continuously check each bar to raise TSL or not

//  Check if a Buy has been triggered and set initial value for TSL //
if buyAlert
    TSLTriggerValue := alertBuyValue+(alertBuyValue*trailStopArm)
    TSLActive  := 0
    TSLRunning := 1
    TSLStop := TSLTriggerValue - (TSLTriggerValue*trailStopPct)


//  Check that Buy has triggered and if Close has reached initial TSL//
//  Keeps from setting Sell Signal before TSL has been armed w/TSLActive//
beginTrail=TSLRunning==1 and TSLActive==0 and close>alertBuyValue+(alertBuyValue*trailStopArm) and ta.crossover(close,TSLTriggerValue)
if beginTrail
    TSLTriggerValue :=close
    TSLActive :=1
    TSLStop :=TSLTriggerValue - (TSLTriggerValue*trailStopPct)

//  Continuously check if TSL needs to increase and set new value //
runTrail= TSLActive==1 and (ta.crossover(close,TSLTriggerValue) or close>=TSLTriggerValue)
if runTrail
    TSLTriggerValue :=close
    TSLStop :=TSLTriggerValue - (TSLTriggerValue*trailStopPct)

//  Verify that TSL is active and trigger when close cross below TSL Stop//
TSL=TSLActive==1 and (ta.crossunder(close,TSLStop) or (close[1]>TSLStop and close<TSLStop))

// Plot point of inital arming of TSL//
TSLTrigger=TSLActive==1 and TSLActive[1]==0
plotshape(TSLTrigger, title='TSL Armed', location=location.abovebar, color=color.new(color.blue, 0), size=size.small, style=shape.cross, text='TSL Armed')


////////////////////////////////////////////////////////////
/////             Sell Conditions                    ///////
////////////////////////////////////////////////////////////
Sell1 = TSL
Sell2 = ta.crossunder(close,alertSellValueLow)

alertSell = Sell1 or Sell2
////////////////////////////////////////////////////////////

////////////////////////////////////////////////////////////
////        Remove Redundant Signals                    ////
////////////////////////////////////////////////////////////
showAlertSell = 0
if(alertSell and lastsignal != -1)
    showAlertSell           := 1
    lastsignal              := -1
sellAlert= showAlertSell    > 0

if sellAlert
    TSLActive  :=0
    TSLRunning :=0
    buyActive  :=0
/////////////////////////////////////////
//  Plot Buy and Sell Shapes on Chart  //
/////////////////////////////////////////
plotshape(buyAlert,  title='Buy' , location=location.belowbar , color=color.new(color.green, 0), size=size.small , style=shape.triangleup   , text='Buy')
plotshape(sellAlert, title='Sell', location=location.abovebar , color=color.new(color.red, 0)  , size=size.small , style=shape.triangledown , text='Sell')

/////////////////////////////////////////////////////////////////////////////////////////////
//                        Remove // on alertCondition to enable Alerts                     //
/////////////////////////////////////////////////////////////////////////////////////////////
//Alerts
alertcondition(title='Buy Alert', condition=buyAlert, message='Buy Conditions are Met')
alertcondition(title='Sell Alert', condition=sellAlert, message='Sell Conditions are Met')
/////////////////////////////////////////////////////////////////////////////////////////////


////////////////////////////////////////////////////////////
////  Comment out this section if setup as Indicator    ////
////////////////////////////////////////////////////////////
//longCondition = buyAlert
//if (longCondition)
//    strategy.entry("Buy", strategy.long)
//    alert(message='Buy', freq=alert.freq_once_per_bar_close)

//shortCondition = sellAlert
//if (shortCondition)
//    strategy.close_all(sellAlert,"Sell")
//    alert(message='Sell', freq=alert.freq_once_per_bar_close)
/////////////////////////////////////////////////////////////


if buyAlert
    strategy.entry("Enter Long", strategy.long)
else if sellAlert
    strategy.entry("Enter Short", strategy.short)
- مسلسل MACD گولڈن اور ڈیتھ کراس پر مبنی ٹریڈنگ حکمت عملی
- بہتر بولنگر بینڈس آر ایس آئی ٹریڈنگ حکمت عملی
- ٹرپل ای ایم اے کراس اوور حکمت عملی
- ایکسپونینشل حرکت پذیر اوسط کراس اوور لیورج کی حکمت عملی
- GM-8 اور ADX ڈبل حرکت پذیر اوسط حکمت عملی
- RSI/MACD/ATR کے ساتھ EMA کراس اوور کی بہتر حکمت عملی
- Z- اسکور رجحان کی پیروی کی حکمت عملی
- ای ایم اے پر طویل اندراج خطرے کے انتظام کی حکمت عملی کے ساتھ کراس
- وی ڈبلیو اے پی ٹریڈنگ حکمت عملی
- ویو ٹرینڈ کراس لیزیبیئر حکمت عملی
- الفا ٹریڈنگ بوٹ ٹریڈنگ کی حکمت عملی
- ایس ایس ایل ہائبرڈ
- لوڈشیلڈر باہر نکلیں
- ریسوٹو
- ای ایم اے کلاؤڈ انٹرا ڈے حکمت عملی
- پییوٹ پوائنٹ سپر ٹرینڈ
- سپر ٹرینڈ+4متحرک
- رفتار پر مبنی زگ زگ
- VuManChu Cipher B + Divergences حکمت عملی
- تصور دوہری سپر ٹرینڈ
- سپر اسکیلپر
- ٹرینڈیلیوس
- ایس ایم اے بی ٹی سی قاتل
- ایم ایل انتباہات کا نمونہ
- وقفے کے ساتھ فبونیکی ترقی
- RSI MTF Ob+Os
- Fukuiz Octa-EMA + Ichimoku
- سی سی آئی ایم ٹی ایف او بی + او
- زیادہ ذہین MACD
- OCC حکمت عملی R5.1
- بیئر مارکیٹ میں خوش آمدید