رشتہ دار طاقت کا انڈیکس - اختلافات - لبرٹوس
مصنف:چاؤ ژانگ، تاریخ: 2022-05-24 15:24:22ٹیگز:آر ایس آئی
ہیلو سب،
ہر کسی کے ٹریڈنگ کے تجربے کو آسان بنانے کے لئے میں نے یہ اسکرپٹ بنایا ہے جو آر ایس آئی کو زیادہ خریدنے اور زیادہ فروخت کی حالتوں کو رنگ دیتا ہے اور ایک بونس کے طور پر آخری 50 موم بتیوں میں تیزی یا bearish اختلافات کو ظاہر کرتا ہے (ڈیفالٹ کے طور پر، آپ اسے تبدیل کرسکتے ہیں). اسکرپٹ اوپن سورس ہے ، کوڈ کا ایک حصہ ٹریڈنگ ویو مثالوں سے ہے۔ اگر آپ کے پاس تجاویز ہیں یا آپ نے پہلے ہی کچھ بہتری کی ہے تو ، براہ کرم تبصرے میں اطلاع دیں۔
خوش تجارت اور اچھی قسمت!
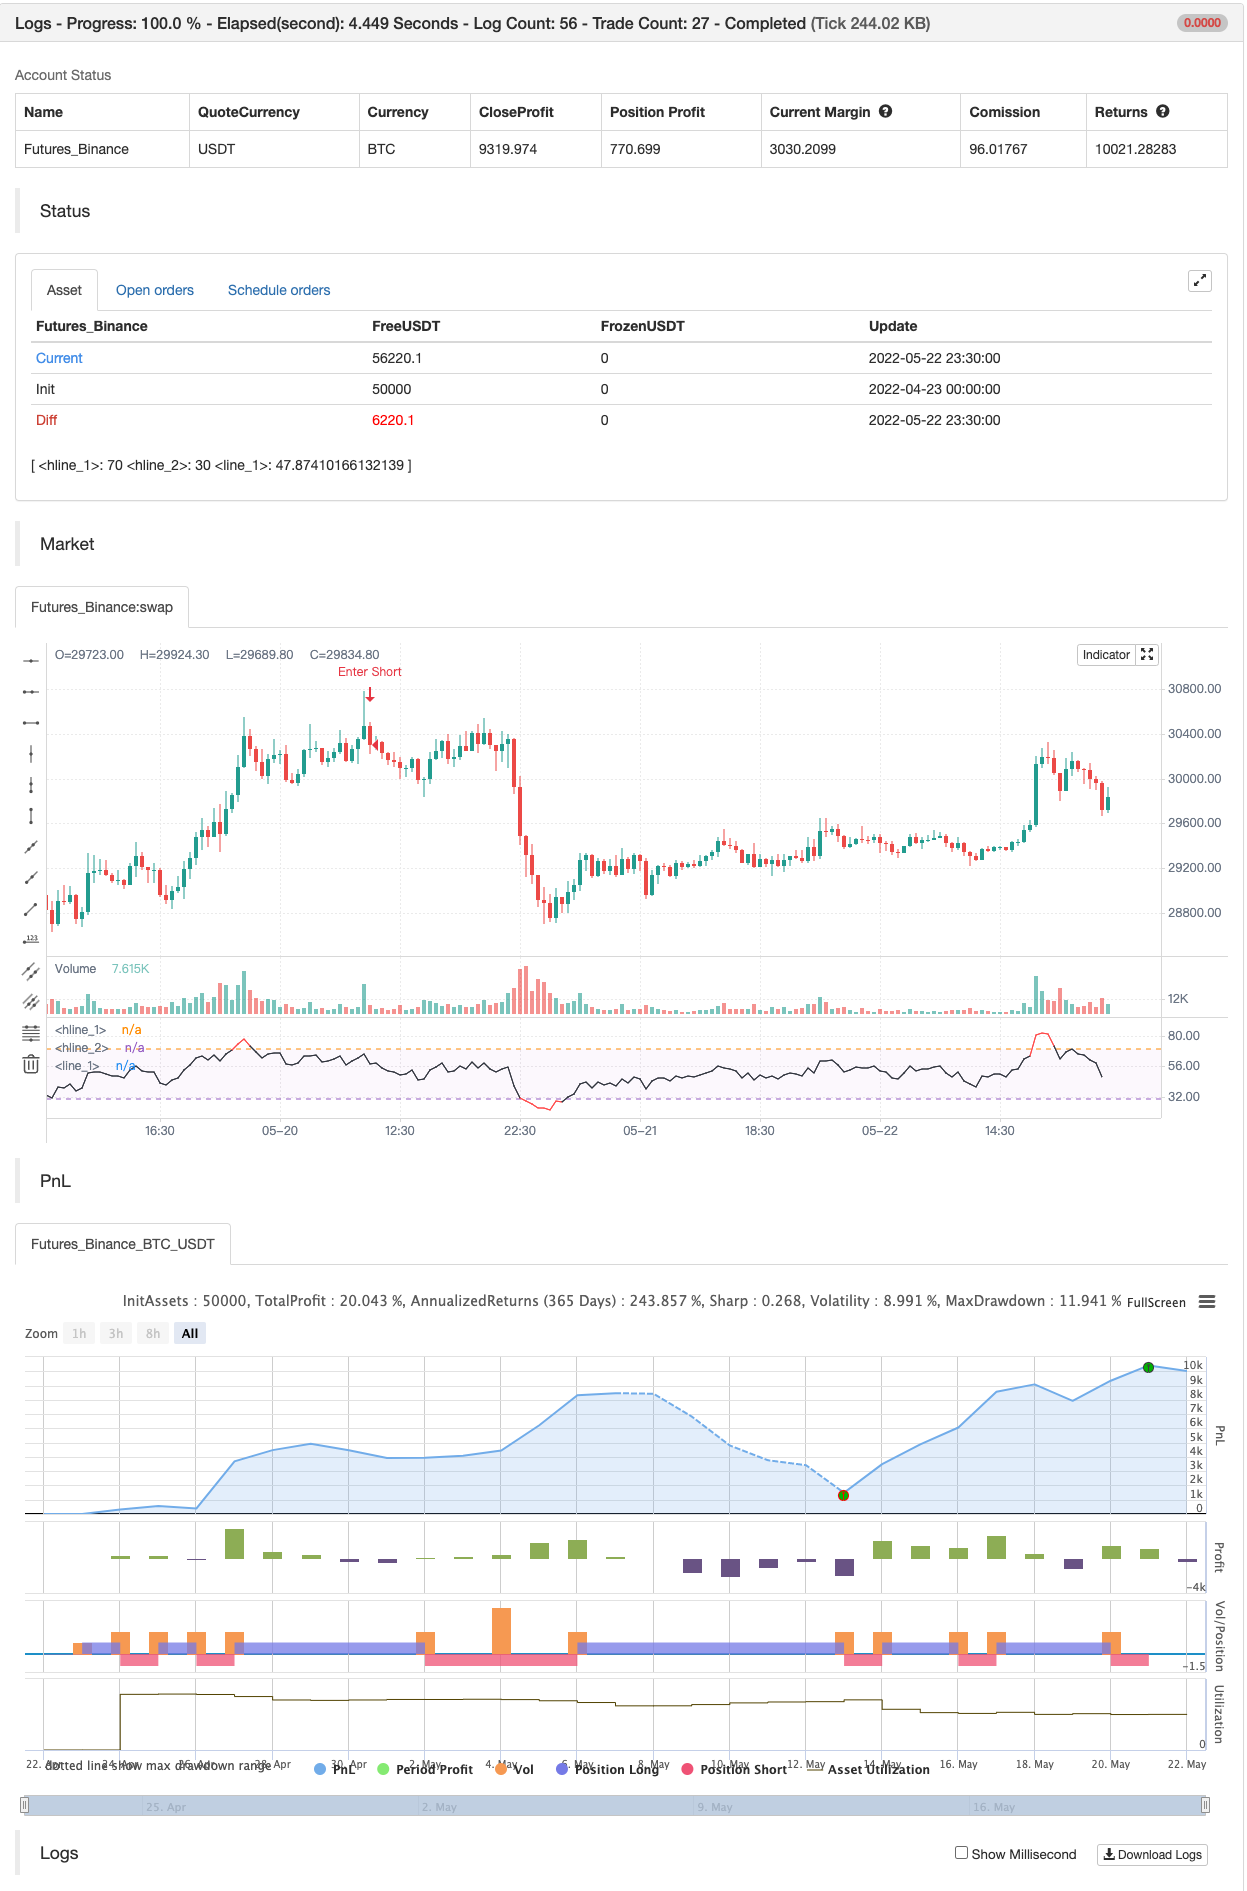
بیک ٹسٹ
//@version=4
// Copyright by Libertus - 2021
// RSI Divergences v3.2
// Free for private use
study(title="Relative Strength Index - Divergences - Libertus", shorttitle="RSI Div - Lib")
len = input(14, minval=1, title="RSI Length")
ob = input(defval=70, title="Overbought", type=input.integer, minval=0, maxval=100)
os = input(defval=30, title="Oversold", type=input.integer, minval=0, maxval=100)

// RSI code
rsi = rsi(close, len)
band1 = hline(ob)
band0 = hline(os)
plot(rsi, color=(rsi > ob or rsi < os ? color.new(color.red, 0) : color.new(color.black, 0)))
fill(band1, band0, color=color.new(color.purple, 97))

// DIVS code
piv = input(false,"Hide pivots?")
shrt = input(false,"Shorter labels?")
hidel = input(false, "Hide labels and color background")
xbars = input(defval=90, title="Div lookback period (bars)?", type=input.integer, minval=1)
hb = abs(highestbars(rsi, xbars)) // Finds bar with highest value in last X bars
lb = abs(lowestbars(rsi, xbars)) // Finds bar with lowest value in last X bars

// Defining variable values, mandatory in Pine 3
max = float(na)
max_rsi = float(na)
min = float(na)
min_rsi = float(na)
pivoth = bool(na)
pivotl = bool(na)
divbear = bool(na)
divbull = bool(na)

// If bar with lowest / highest is current bar, use it's value
max := hb == 0 ? close : na(max[1]) ? close : max[1]
max_rsi := hb == 0 ? rsi : na(max_rsi[1]) ? rsi : max_rsi[1]
min := lb == 0 ? close : na(min[1]) ? close : min[1]
min_rsi := lb == 0 ? rsi : na(min_rsi[1]) ? rsi : min_rsi[1]

// Compare high of current bar being examined with previous bar's high
// If curr bar high is higher than the max bar high in the lookback window range
if close > max // we have a new high
    max := close // change variable "max" to use current bar's high value
if rsi > max_rsi // we have a new high
    max_rsi := rsi // change variable "max_rsi" to use current bar's RSI value
if close < min // we have a new low
    min := close // change variable "min" to use current bar's low value
if rsi < min_rsi // we have a new low
    min_rsi := rsi // change variable "min_rsi" to use current bar's RSI value

// Finds pivot point with at least 2 right candles with lower value
pivoth := (max_rsi == max_rsi[2]) and (max_rsi[2] != max_rsi[3]) ? true : na
pivotl := (min_rsi == min_rsi[2]) and (min_rsi[2] != min_rsi[3]) ? true : na

// Detects divergences between price and indicator with 1 candle delay so it filters out repeating divergences
if (max[1] > max[2]) and (rsi[1] < max_rsi) and (rsi <= rsi[1])
    divbear := true
if (min[1] < min[2]) and (rsi[1] > min_rsi) and (rsi >= rsi[1])
    divbull := true

// Alerts
alertcondition(divbear, title='Bear div', message='Bear div')
alertcondition(divbull, title='Bull div', message='Bull div')
alertcondition(pivoth, title='Pivot high', message='Pivot high')
alertcondition(pivotl, title='Pivot low', message='Pivot low')

if divbull
    strategy.entry("Enter Long", strategy.long)
else if divbear
    strategy.entry("Enter Short", strategy.short)

// // Plots divergences and pivots with offest
// l = divbear ?
//       label.new (bar_index-1, rsi[1]+1, "BEAR", color=color.red, textcolor=color.white, style=label.style_labeldown, yloc=yloc.price, size=size.small) :
//       divbull ?
//           label.new (bar_index-1, rsi[1]-1, "BULL", color=color.green, textcolor=color.white, style=label.style_labelup, yloc=yloc.price, size=size.small) :
//           pivoth ?
//               label.new (bar_index-2, max_rsi+1, "PIVOT", color=color.blue, textcolor=color.white, style=label.style_labeldown, yloc=yloc.price, size=size.small) :
//               pivotl ?
//                   label.new (bar_index-2, min_rsi-1, "PIVOT", color=color.blue, textcolor=color.white, style=label.style_labelup, yloc=yloc.price, size=size.small) :
//                   na

// // Shorter labels
// if shrt
//     label.set_text (l, na)
// // Hides pivots or labels
// if (piv and (pivoth or pivotl)) or hidel
//     label.delete (l)
// // Colors indicator background
// bgcolor (hidel ? (divbear ? color.new(color.red, 50) : divbull ? color.new(color.green, 50) : na) : na, offset=-1)
// bgcolor (hidel ? (piv ? na : (pivoth or pivotl ? color.new(color.blue, 50) : na)) : na, offset=-2)

// Debug tools
// plot(max, color=blue, linewidth=2)
// plot(max_rsi, color=red, linewidth=2)
// plot(hb, color=orange, linewidth=2)
// plot(lb, color=purple, linewidth=1)
// plot(min_rsi, color=lime, linewidth=1)
// plot(min, color=black, linewidth=1)
متعلقہ
- طویل حکمت عملی کے بعد ایم اے سی ڈی آر ایس آئی Ichimoku رفتار کا رجحان
- آر ایس آئی سمت کی تبدیلی کی حکمت عملی
- بہتر بولنگر بینڈس آر ایس آئی ٹریڈنگ حکمت عملی
- محور اور رفتار کی حکمت عملی
- چلتی اوسط اور آر ایس آئی جامع ٹریڈنگ حکمت عملی
- منگل کی تبدیلی کی حکمت عملی (ہفتے کے اختتام کے فلٹر)
- RSI/MACD/ATR کے ساتھ EMA کراس اوور کی بہتر حکمت عملی
- ایم اے سی ڈی اور آر ایس آئی مشترکہ طویل مدتی تجارتی حکمت عملی
- RSI2 حکمت عملی دن کے اندر واپسی جیت کی شرح بیک ٹیسٹ
- حکمت عملی کے بعد کثیر اشارے کا رجحان
- الفا ٹریڈنگ بوٹ ٹریڈنگ کی حکمت عملی
مزید
- سوئنگ ہول/آر ایس آئی/ای ایم اے حکمت عملی
- اسکیلپنگ سوئنگ ٹریڈنگ ٹول R1-4
- بہترین نگلنگ + بریک آؤٹ حکمت عملی
- بولنگر زبردست الرٹ R1
- ملٹی ایکسچینج بیک وقت پلگ ان
- ٹرائیگون سود (چھوٹی کرنسیوں کی قیمتوں میں فرق حاصل کرنا)
- بائی بٹ ریورس کنٹریکٹ متحرک گرڈ (خصوصی گرڈ)
- MT4 MT5 + متحرک متغیرات کے لئے ٹریڈنگ ویو انتباہات
- میٹرکس سیریز
- سپر اسکیلپر - 5 منٹ 15 منٹ
- لکیری رجسٹریشن ++
- توانائی کی سلاخوں کے ساتھ ریڈ کے ڈبل ویڈر
- کنسولیڈیشن زونز - لائیو
- مقداری معیار کا اندازہ
- چلتی اوسط کراس الرٹ، ملٹی ٹائم فریم (MTF)
- ایم اے سی ڈی ری لوڈ شدہ حکمت عملی
- سپر ٹرینڈڈ چلتی اوسط
- ٹریڈنگ اے بی سی
- 15MIN BTCUSDTPERP BOT
- شینن اینٹروپی V2