حکمت عملی کے بعد ڈبل ریورسل آسکیلیٹر رجحان
جائزہ
ڈبل ریورس ہلچل بینڈ ٹرینڈ ٹریکنگ اسٹریٹجی ڈبل ریورس سگنل اور ہلچل بینڈ اشارے کے امتزاج کے ذریعے رجحان کی پیروی کی تجارت کو انجام دیتی ہے۔ یہ پہلے 123 ریورس سسٹم کا استعمال کرتے ہوئے ریورس سگنل تیار کرتا ہے ، اور پھر اس کے ساتھ مل کر Fractal Chaos Bands اشارے فلٹر سگنل ، رجحان کی پیروی کو انجام دیتا ہے۔ یہ حکمت عملی ریورس مواقع کی نشاندہی کرنے کے ساتھ ساتھ رجحان کی پیروی کرنے کے قابل ہے ، اور یہ ایک بہت ہی جامع تجارتی حکمت عملی ہے۔
حکمت عملی کا اصول
123 ریورس نظام
123 ریورسنگ سسٹم کا ماخذ اولف جینسن کی کتاب میں صفحہ 183 پر موجود ہے۔ اس کا ٹریڈنگ سگنل یہ ہے:
جب اختتامی قیمت پچھلے دن کی اختتامی قیمت سے 2 دن مسلسل زیادہ ہو اور 9 ویں سست K لائن 50 سے کم ہو تو ، زیادہ کام کریں۔ جب اختتامی قیمت پچھلے دن کی اختتامی قیمت سے 2 دن مسلسل کم ہو اور 9 ویں فاسٹ K لائن 50 سے زیادہ ہو تو ، خالی کام کریں۔
اس حصے میں بنیادی طور پر اسٹوکاسٹک آسکیلیٹر اشارے کا استعمال کیا جاتا ہے تاکہ اوورلوڈ اوور سیل علاقوں میں سگنل پیدا کیا جاسکے۔ جب اسٹاک کی قیمت میں مسلسل اضافہ ہوتا ہے لیکن اسٹوکاسٹک آسکیلیٹر اشارے میں ابھی بھی زیادہ جگہ بڑھتی ہے تو ، بیوقوفانہ حکمت عملی اختیار کی جائے۔ جب اسٹاک کی قیمت میں مسلسل کمی ہوتی ہے لیکن اسٹوکاسٹک آسکیلیٹر اشارے میں ابھی بھی زیادہ جگہ کم ہوتی ہے تو ، نیچے کی حکمت عملی اختیار کی جائے۔
Fractal Chaos Bands اشارے
Fractal Chaos Bands اشارے اسٹاک کی قیمتوں کے اعلی ترین اور کم ترین مقامات کو نقشہ بنا کر ، اوپری اور نچلے حصے کی تشکیل کرکے ، مارکیٹ کے رجحانات کا فیصلہ کرنے کے لئے۔ مخصوص قواعد یہ ہیں:
جب قیمتوں میں اضافہ ہوتا ہے تو ، زیادہ کام کریں؛ جب قیمتوں میں کمی ہوتی ہے تو ، کم کریں۔
اس حصے کو بنیادی طور پر رجحان فلٹر کے طور پر استعمال کیا جاتا ہے اور 123 ریورس سگنل کے ساتھ مل کر استعمال کیا جاتا ہے۔ پوزیشن صرف اس وقت کھولی جاتی ہے جب دونوں سگنل ایک جیسے ہوں۔
اسٹریٹجک فوائد
- تبدیلی اور رجحانات کے ساتھ مل کر، مواقع پر قابو پانے کے لئے
ڈبل ریورس شاک بینڈ ٹرینڈ ٹریکنگ اسٹریٹجی ریورس مواقع کو پکڑنے کے ساتھ ساتھ رجحانات کی پیروی کرنے کے لئے بھی بہت جامع ہے۔ آپ کو تجارتی سگنل مل سکتے ہیں چاہے مارکیٹ شاک یا رجحان کی حالت میں ہو۔
- جعلی سگنل کم کریں اور جیت کی شرح میں اضافہ کریں
اس حکمت عملی کے ذریعے ، ایک ہی اشارے کے مقابلے میں ، ڈبل اشارے کے امتزاج کے ذریعے فلٹر کیا جاتا ہے ، جس سے جعلی سگنلوں کو نمایاں طور پر کم کیا جاسکتا ہے ، اور حقیقی تجارت کی جیت اور منافع کی شرح میں اضافہ ہوتا ہے۔
- پیرامیٹرز کو ایڈجسٹ کرنے کے لئے لچکدار اور لچکدار
ڈبل ریورس زلزلہ بینڈ رجحان ٹریکنگ حکمت عملی کے پیرامیٹرز کو اچھی طرح سے سمجھا جاتا ہے ، صارف اپنی ضروریات اور مارکیٹ کے ماحول کے مطابق ایڈجسٹ کرسکتا ہے ، اور یہ بہت لچکدار ہے۔ چاہے زلزلے کی مارکیٹ ہو یا رجحان کی مارکیٹ ، پیرامیٹرز کے ذریعے موافقت کی جاسکتی ہے۔
خطرہ اور اصلاح
- بڑے رجحانات کے ساتھ مطابقت نہیں رکھتا
حکمت عملی خود زیادہ انحصار کرتا ہے سیٹ اور شارٹ لائن ٹریڈنگ کے مواقع پر۔ بڑے مارکیٹ کے رجحانات کے تحت ، یہ حکمت عملی بہت زیادہ الٹ سگنل پیدا کرسکتی ہے اور آؤٹ پٹ کو روک سکتی ہے۔ یہ پیرامیٹرز کو ایڈجسٹ کرکے بہتر بنایا جاسکتا ہے۔
- مارجن فنڈنگ کی ضرورت
ڈبل ریورس شاک زون ٹرینڈ ٹریکنگ اسٹریٹجی ایک بار بار تجارت کی قسم ہے جس میں پوزیشن کھولنے کے لئے گارنٹی کی ضرورت کی حمایت کرنے کے لئے کافی مارجن فنڈ کی ضرورت ہوتی ہے۔ کم فنڈز والے صارفین کے لئے ، پوزیشن کو مناسب طریقے سے کم کرنے کی ضرورت ہوسکتی ہے۔
- مزید اشارے فلٹر کر سکتے ہیں
یہ حکمت عملی موجودہ بنیاد پر ، سگنل کے ذرائع کو تقویت دینے اور حکمت عملی کی استحکام کو بہتر بنانے کے لئے مزید مختلف اقسام کے اشارے متعارف کروا سکتی ہے۔ اس میں الٹ اور رجحان سگنل کی جانچ پڑتال کے لئے اضافی توانائی کے اشارے ، اتار چڑھاؤ کے اشارے وغیرہ شامل ہیں۔
خلاصہ کریں۔
ڈبل ریورس شاک بینڈ ٹرینڈ ٹریکنگ حکمت عملی کامیابی کے ساتھ ریورس ٹریڈنگ اور ٹرینڈ ٹریکنگ کے فوائد کو جوڑتی ہے ، جو ریورس کو پکڑنے اور رجحان کی پیروی کرنے کے قابل ہے ، یہ بہت جامع اور موثر ہے۔ ایک ہی اشارے کے مقابلے میں ، یہ جعلی سگنل کو بہت کم کرسکتا ہے ، اور اصل تجارت کی جیت کی شرح اور منافع کی سطح کو بہتر بنا سکتا ہے۔ اس کے علاوہ ، اس حکمت عملی کے پیرامیٹرز کو ایڈجسٹ کرنے میں لچک ہے ، اور صارف اپنے انداز اور مارکیٹ کے ماحول کے مطابق اس کو بہتر بنا سکتا ہے۔
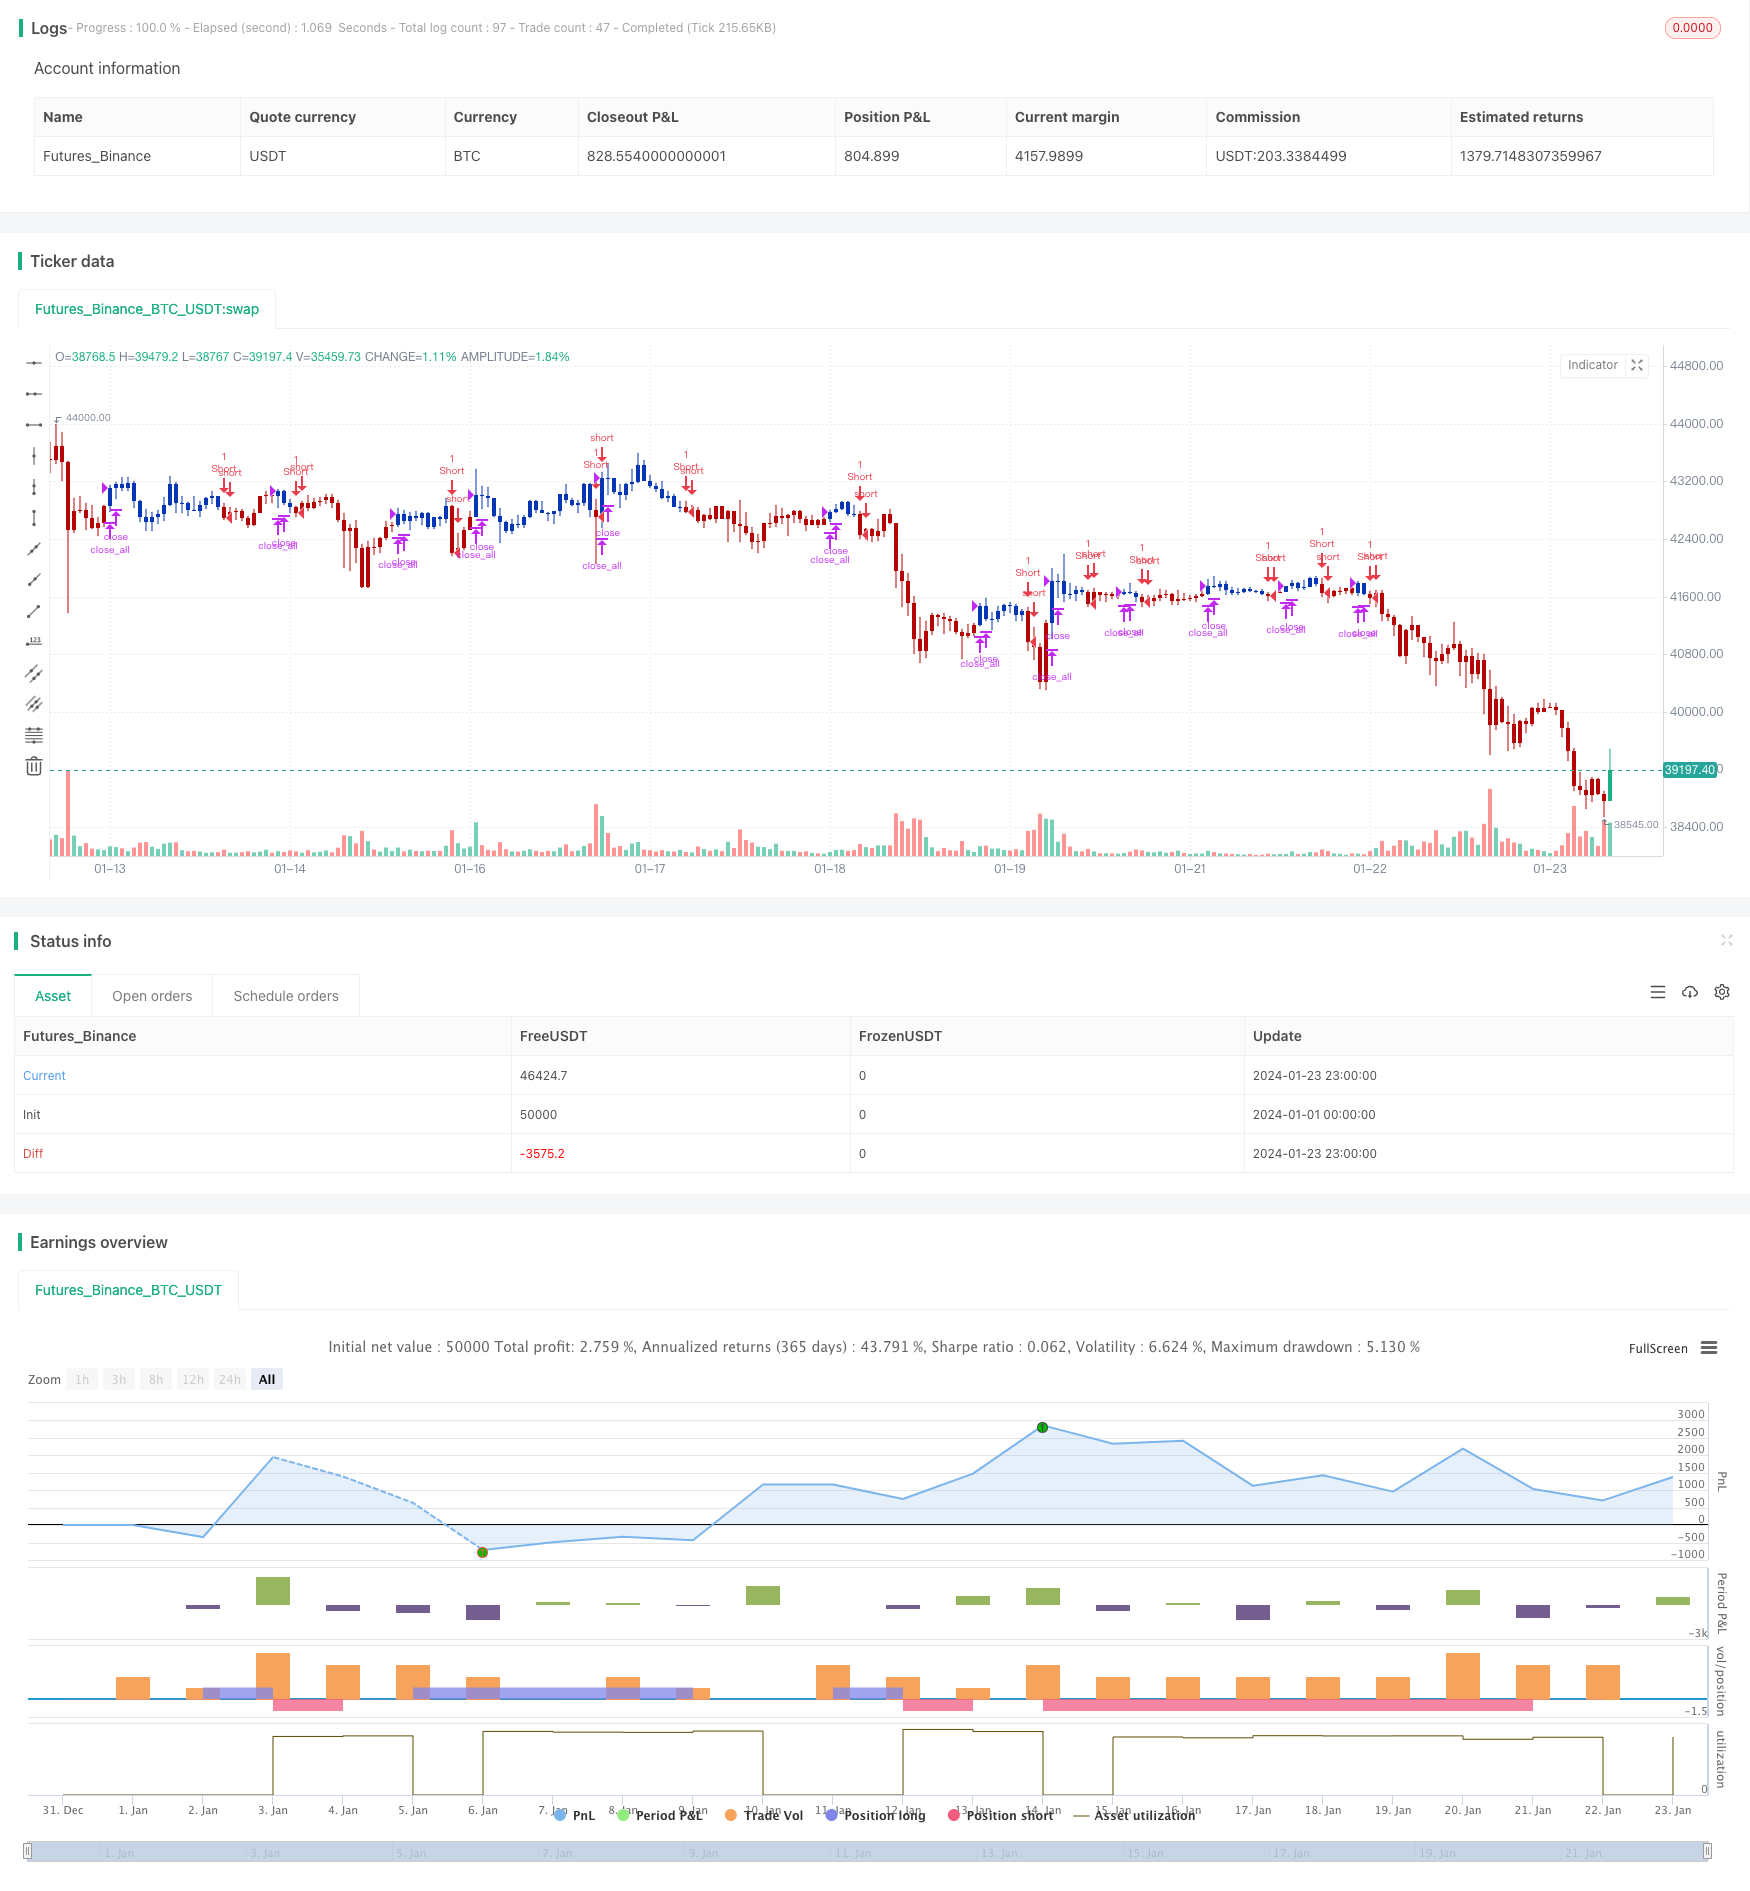
/*backtest
start: 2024-01-01 00:00:00
end: 2024-01-24 00:00:00
period: 1h
basePeriod: 15m
exchanges: [{"eid":"Futures_Binance","currency":"BTC_USDT"}]
*/

//@version=4
////////////////////////////////////////////////////////////
//  Copyright by HPotter v1.0 21/09/2020
// This is combo strategies for get a cumulative signal.
//
// First strategy
// This System was created from the Book "How I Tripled My Money In The
// Futures Market" by Ulf Jensen, Page 183. This is reverse type of strategies.
// The strategy buys at market, if close price is higher than the previous close
// during 2 days and the meaning of 9-days Stochastic Slow Oscillator is lower than 50.
// The strategy sells at market, if close price is lower than the previous close price
// during 2 days and the meaning of 9-days Stochastic Fast Oscillator is higher than 50.
//
// Second strategy
//  Stock market moves in a highly chaotic way, but at a larger scale, the movements
// follow a certain pattern that can be applied to shorter or longer periods of time
// and we can use Fractal Chaos Bands Indicator to identify those patterns. Basically,
// the Fractal Chaos Bands Indicator helps us to identify whether the stock market is
// trending or not. When a market is trending, the bands will have a slope and if market
// is not trending the bands will flatten out. As the slope of the bands decreases, it
// signifies that the market is choppy, insecure and variable. As the graph becomes more
// and more abrupt, be it going up or down, the significance is that the market becomes
// trendy, or stable. Fractal Chaos Bands Indicator is used similarly to other bands-indicator
// (Bollinger bands for instance), offering trading opportunities when price moves above or
// under the fractal lines.
//
// The FCB indicator looks back in time depending on the number of time periods trader selected
// to plot the indicator. The upper fractal line is made by plotting stock price highs and the
// lower fractal line is made by plotting stock price lows. Essentially, the Fractal Chaos Bands
// show an overall panorama of the price movement, as they filter out the insignificant fluctuations
// of the stock price.
//
// WARNING:
// - For purpose educate only
// - This script to change bars colors.
////////////////////////////////////////////////////////////
Reversal123(Length, KSmoothing, DLength, Level) =>
    vFast = sma(stoch(close, high, low, Length), KSmoothing)
    vSlow = sma(vFast, DLength)
    pos = 0.0
    pos := iff(close[2] < close[1] and close > close[1] and vFast < vSlow and vFast > Level, 1,
	         iff(close[2] > close[1] and close < close[1] and vFast > vSlow and vFast < Level, -1, nz(pos[1], 0)))
	pos

fractalUp(pattern) =>
    p = high[pattern+1]
    okl = 1
    okr = 1
    res = 0.0
	for i = pattern to 1
		okl := iff(high[i] < high[i+1] and okl == 1 , 1, 0)
	for i = pattern+2 to pattern*2+1
		okr := iff(high[i] < high[i-1] and okr == 1, 1, 0)
	res := iff(okl == 1 and okr == 1, p, res[1])
    res

fractalDn(pattern) =>
    p = low[pattern+1]
    okl = 1
    okr = 1
    res =0.0
	for i = pattern to 1
		okl := iff(low[i] > low[i+1] and okl == 1 , 1, 0)
	for i = pattern+2 to pattern*2+1
		okr := iff(low[i] > low[i-1] and okr == 1, 1, 0)
	res := iff(okl == 1 and okr == 1, p, res[1])
    res

FCB(Pattern) =>
    pos = 0.0
    xUpper = fractalUp(Pattern)
    xLower = fractalDn(Pattern)
    pos := iff(close > xUpper, 1,
             iff(close < xLower, -1, nz(pos[1], 0)))
    pos

strategy(title="Combo Backtest 123 Reversal & Fractal Chaos Bands", shorttitle="Combo", overlay = true)
Length = input(15, minval=1)
KSmoothing = input(1, minval=1)
DLength = input(3, minval=1)
Level = input(50, minval=1)
//-------------------------
Pattern = input(1, minval=1)
reverse = input(false, title="Trade reverse")
posReversal123 = Reversal123(Length, KSmoothing, DLength, Level)
posFCB = FCB(Pattern)
pos = iff(posReversal123 == 1 and posFCB == 1 , 1,
	   iff(posReversal123 == -1 and posFCB == -1, -1, 0))
possig = iff(reverse and pos == 1, -1,
          iff(reverse and pos == -1 , 1, pos))
if (possig == 1)
    strategy.entry("Long", strategy.long)
if (possig == -1)
    strategy.entry("Short", strategy.short)
if (possig == 0)
    strategy.close_all()
barcolor(possig == -1 ? #b50404: possig == 1 ? #079605 : #0536b3 )