Williams %R - Đơn giản hóa
Tác giả:ChaoZhang, Ngày: 2022-05-09 12:04:48Tags:WMAEMA
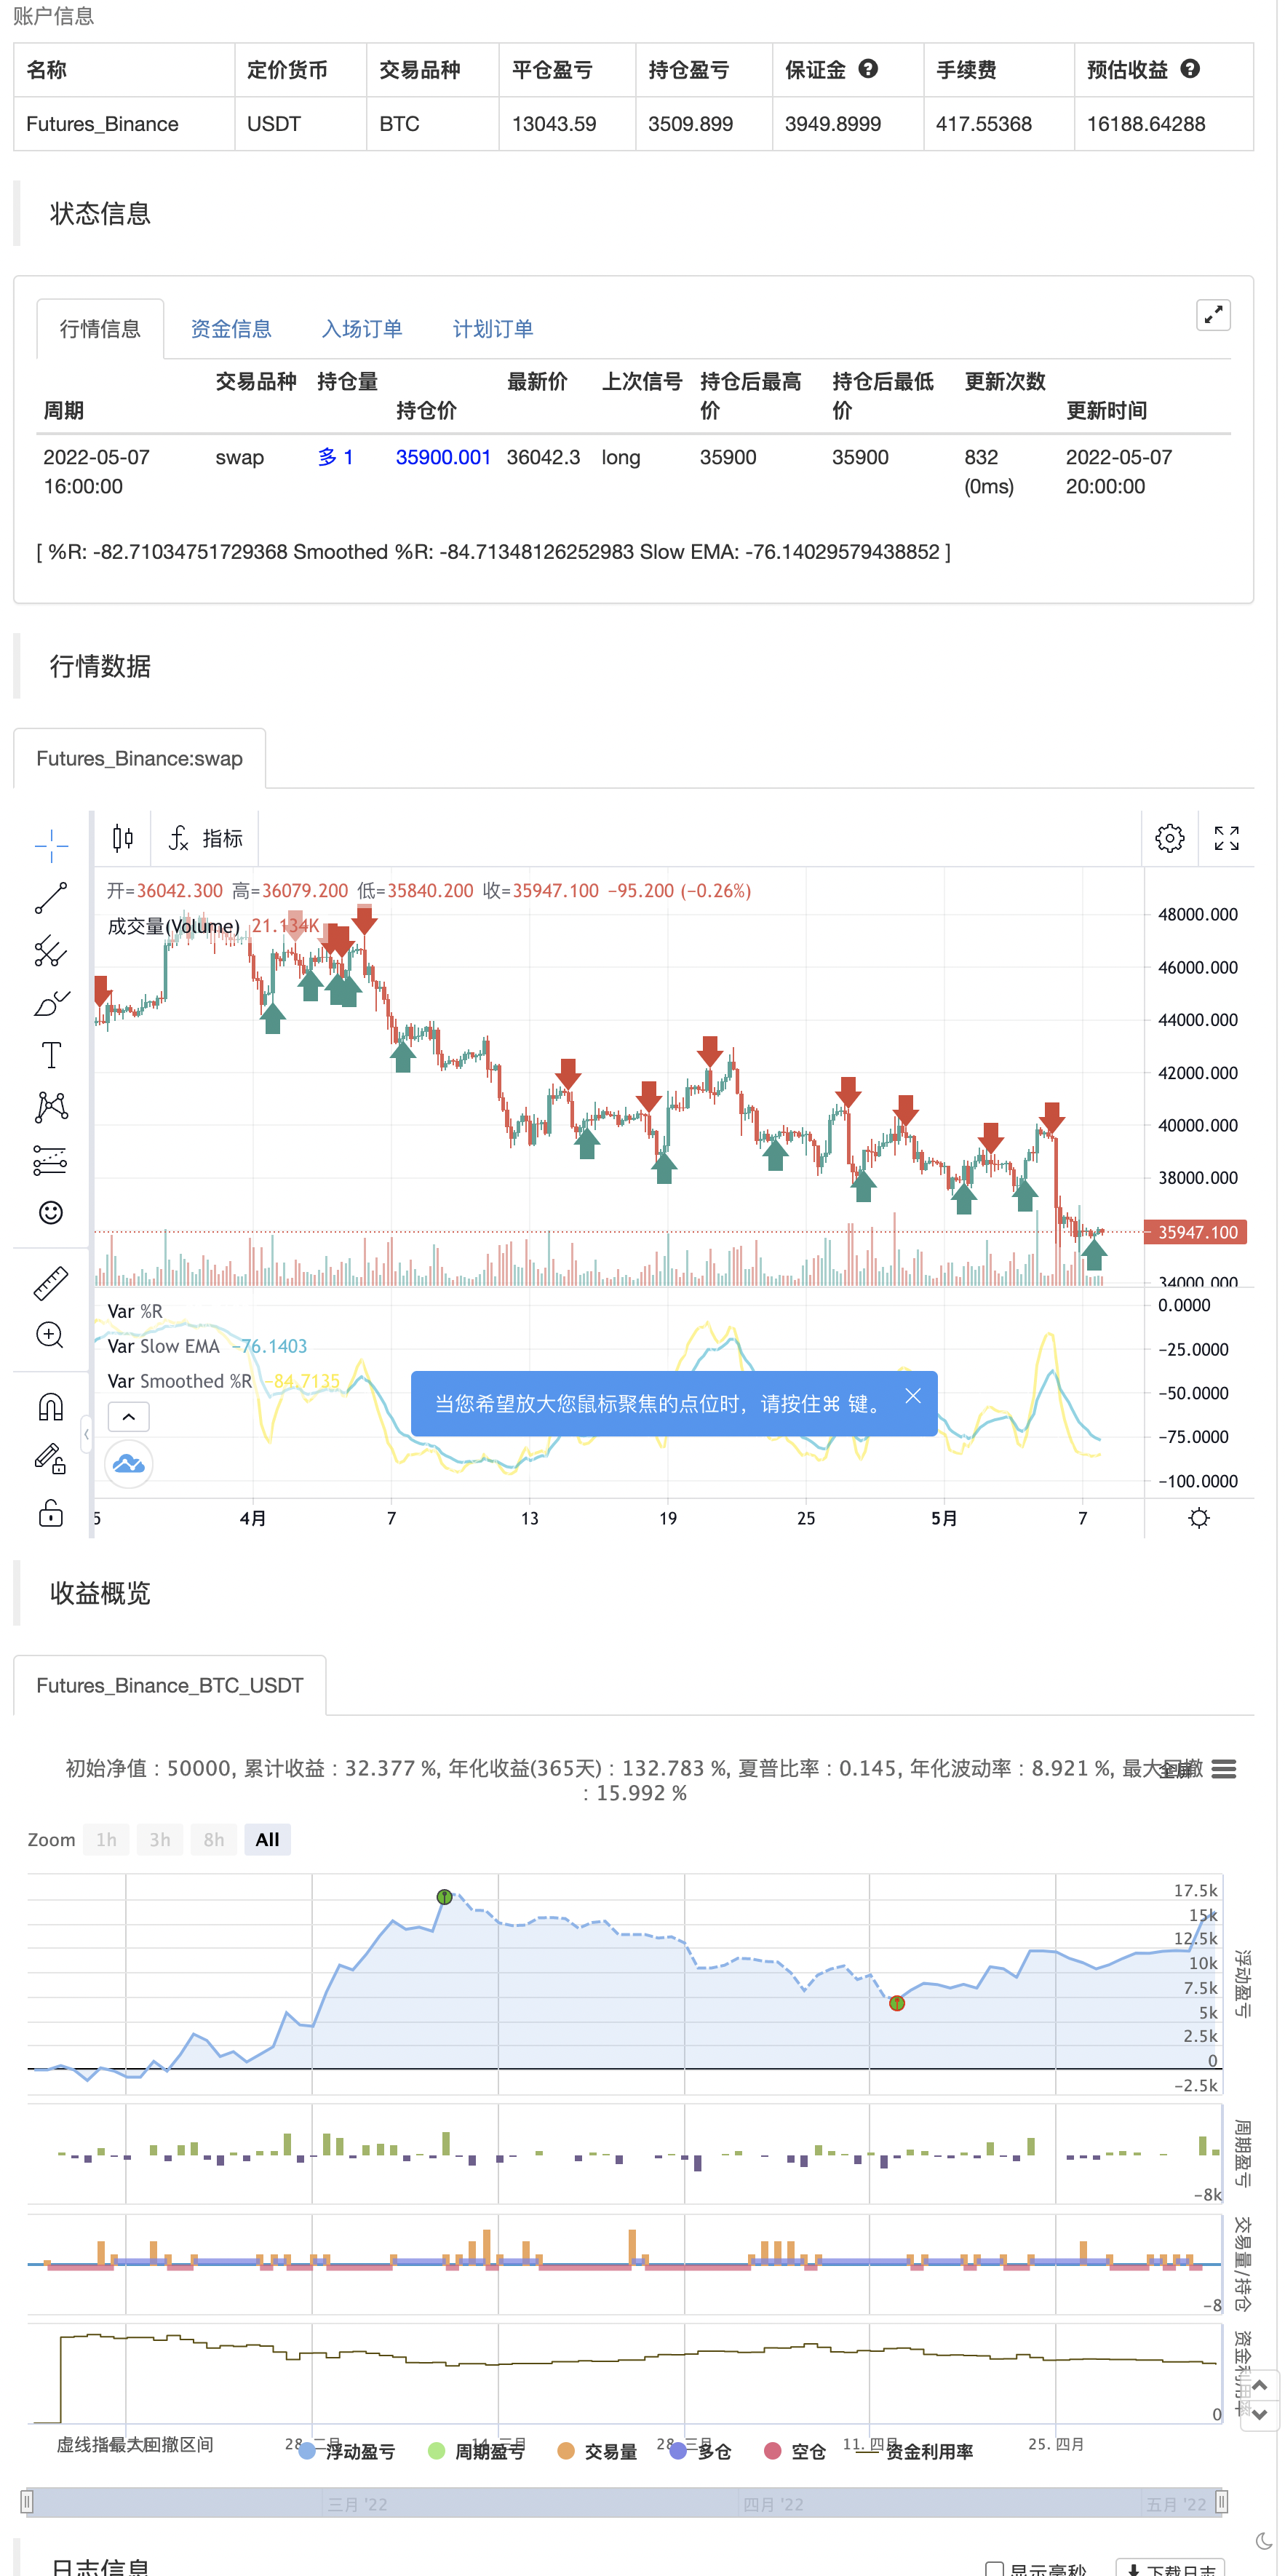
Từ mô tả của TradingView: Williams %R (%R) là một bộ dao động dựa trên động lực được sử dụng trong phân tích kỹ thuật, chủ yếu để xác định các điều kiện mua quá mức và bán quá mức. %R dựa trên so sánh giữa mức đóng hiện tại và mức cao nhất cho một khoảng thời gian nhìn lại được xác định bởi người dùng. %R dao động giữa 0 và -100 (lưu ý các giá trị âm) với các phép đọc gần 0 chỉ ra các điều kiện mua quá mức và các phép đọc gần -100 chỉ ra quá mức. Thông thường %R có thể tạo ra các thiết lập dựa trên các điều kiện mua quá mức và bán quá mức cũng như các thay đổi tổng thể về động lực.
Điều gì đặc biệt? Chỉ số này thêm hai đường EMA bổ sung vào chỉ số Williams %R ban đầu. Độ dài EMA mặc định là 5 và 13. Kết quả là 2 đường trung bình mịn hơn, dễ đọc hơn. Chỉ số này bao gồm:
- tín hiệu cho đường chéo EMA. đường chéo EMA có thể giúp chỉ ra sự thay đổi xu hướng đã được xác nhận. Màu mặc định là màu xanh lá cây và màu đỏ
- tín hiệu cho sự đảo ngược xu hướng trên đường EMA nhanh hơn.
Các cảnh báo có sẵn cho các chéo tăng / giảm và đảo ngược.
Thưởng thức nhé!
backtest
/*backtest
start: 2022-02-08 00:00:00
end: 2022-05-08 00:00:00
period: 4h
basePeriod: 15m
exchanges: [{"eid":"Futures_Binance","currency":"BTC_USDT"}]
*/

// This source code is subject to the terms of the Mozilla Public License 2.0 at https://mozilla.org/MPL/2.0/
// © platsn

//@version=5
indicator(title='Williams %R - Smoothed', shorttitle='The Smooth Willy')

// Williams %R
length = input.int(defval=34, minval=1)
upper = ta.highest(length)
lower = ta.lowest(length)

output = 100 * (close - upper) / (upper - lower)

fast_period = input(defval=5, title='Smoothed %R Length')
slow_period = input(defval=13, title='Slow EMA Length')

fast_ema = ta.wma(output,fast_period)
slow_ema = ta.ema(output,slow_period)

// Plot
//h1 = hline(-20, title='Upper Band')
//h2 = hline(-80, title='Lower Band')
//fill(h1, h2, title='Background', transp=90)

plot(output, title='%R', color=color.new(color.white, 80), linewidth=1)
plot(fast_ema, title='Smoothed %R', color=color.new(color.yellow, 0), linewidth=2)
plot(slow_ema, title='Slow EMA', color=color.new(color.aqua, 0), linewidth=2)

bullX = ta.crossover(fast_ema, slow_ema)
bearX = ta.crossunder(fast_ema, slow_ema)
bullreverse = fast_ema[2] > fast_ema[1] and fast_ema > fast_ema[1] and fast_ema < -30
bearreverse = fast_ema[2] < fast_ema[1] and fast_ema < fast_ema[1] and fast_ema > -70

plotX = input.bool(true, "Show EMA Crossovers")
plotRev = input.bool(true, "Show trend reversals")

//plotshape(plotX and bearX ,"Cross down", color=color.red, style=shape.triangledown, location = location.top, size =size.tiny, offset=-1)
//plotshape(plotX and bullX ,"Cross up", color=color.green, style=shape.triangleup, location = location.bottom, size =size.tiny, offset=-1)
//plotshape(plotRev and bearreverse ,"Bear reversal", color=color.orange, style=shape.triangledown, location = location.top, size =size.tiny, offset=-1)
//plotshape(plotRev and bullreverse ,"Bull reversal", color=color.blue, style=shape.triangleup, location = location.bottom, size =size.tiny, offset=-1)

//alertcondition(bearX,"Bearish Crossover", "Bearish cross on William %R")
//alertcondition(bullX,"Bullish Crossover", "Bullish cross on William %R")
//alertcondition(bearreverse,"Bearish Reversal", "Bearish Reversal on William %R")
//alertcondition(bullreverse,"Billish Reversal", "Bullish Reversal on William %R")

if plotRev and bullreverse
    strategy.entry("Enter Long", strategy.long)
else if plotRev and bearreverse
    strategy.entry("Enter Short", strategy.short)
- Low Scanner chiến lược crypto
- Chiến lược giao dịch định lượng dựa trên đường trung bình động và băng Bollinger
- Tỷ lệ năng lượng hướng tăng tốc theo khối lượng RedK
- HALFTREND + HEMA + SMA (Chiến lược tín hiệu sai)
- Chiến lược Swing Hull/rsi/EMA
- Cảnh báo chéo trung bình chuyển động, nhiều khung thời gian (MTF)
- Chiến lược ngập + thoát tốt nhất
- RedK Dual VADER với thanh năng lượng
- RedK Momentum Bars
- Rainbow Oscillator
- R3.0 + Tình trạng biến động tăng cao + TP RSI
- Chande Kroll dừng lại
- CCI + EMA với Chiến lược chéo RSI
- EMA bands + leledc + bollinger bands
- RSI MTF Ob+Os
- Chiến lược MACD Willy
- RSI - Bán tín hiệu mua
- Xu hướng Heikin-Ashi
- HA Xấu đảo thị trường
- Ichimoku Cloud Smooth Oscillator
- QQE MOD + SSL Hybrid + Waddah Attar vụ nổ
- Mua/Bán Strat
- Triple Supertrend với EMA và ADX
- Bản đồ nhiệt theo trình tự Tom DeMark
- jma + dwma bằng nhiều hạt
- MACD MAGIC
- Điểm số Z với tín hiệu
- Phương pháp biến động dễ dàng của Ngôn ngữ Pine
- 3EMA + Boullinger + PIVOT
- Baguette bằng nhiều hạt