Nhóm nhạc Mobo
Tác giả:ChaoZhang, Ngày: 2022-05-13 14:27:58Tags:SMA
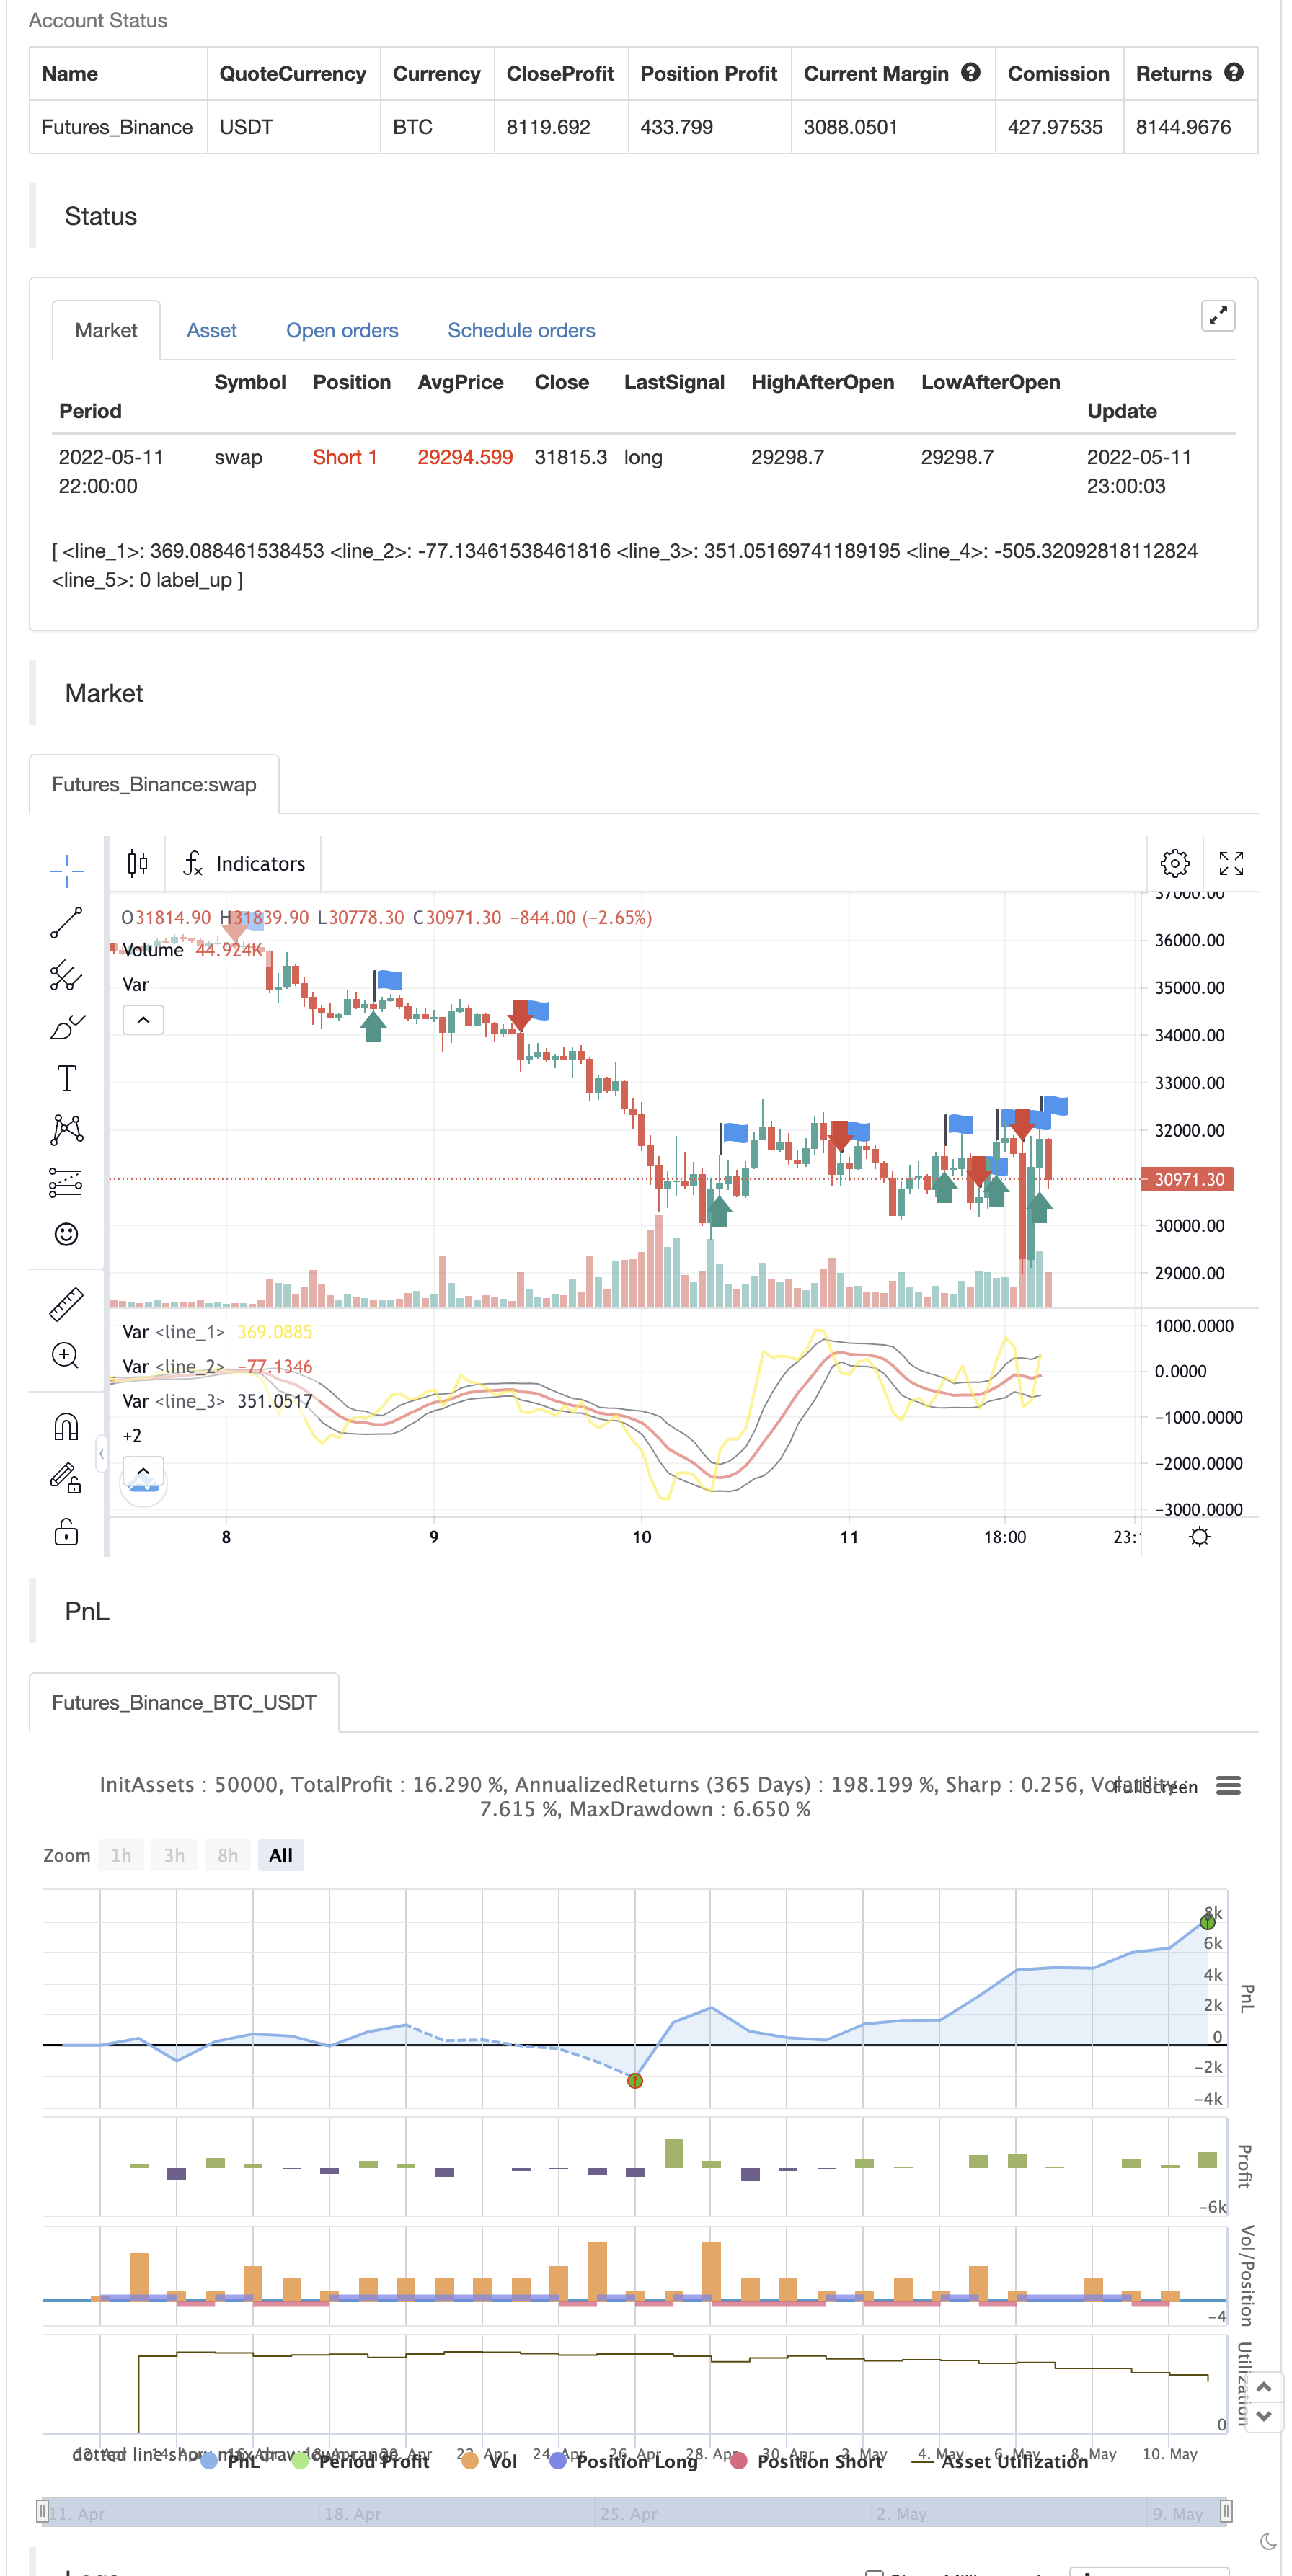
Chỉ số này là Mobo Bands (Momentum Breakout Bands). Những dải này là các dải Bollinger có độ lệch chuẩn điều chỉnh. Có tín hiệu mua khi nó có đà bứt phá trên các dải cho các động thái lên và tín hiệu bán khi nó có đà bứt phá dưới các dải cho các động thái xuống. Dải chỉ đơn giản cho thấy tất cả các thị trường đều có thời gian mà tất cả chúng ta đều biết là đúng. Trong khi giá nằm bên trong dải, nó được cho là không có xu hướng. Một khi các đà bứt phá xảy ra, bạn có thể giao dịch theo hướng bứt phá. Tôi thích sử dụng chúng để thay đổi tùy chọn giao dịch trên khung thời gian hàng giờ nhưng các dải nên hoạt động trên hầu hết các công cụ và khung thời gian. Tôi thích sử dụng nó để thay đổi trên biểu đồ SPY trên biểu đồ 1 giờ cho các mục và sử dụng biểu đồ hàng ngày để xác nhận xu hướng.
backtest
/*backtest
start: 2022-04-12 00:00:00
end: 2022-05-11 23:59:00
period: 1h
basePeriod: 15m
exchanges: [{"eid":"Futures_Binance","currency":"BTC_USDT"}]
*/

//@version=4
study("Mobo Bands", overlay=false)

price           = input(hl2, "Price")
colorNormLength = input(3, "colorNormLength", input.integer)
dpoLength       = input(13, "dpoLength", input.integer)
moboDisplace    = input(0, "moboDisplace", input.integer)
moboLength    = input(10, "moboLength", input.integer)

numDevDn  = input(-0.8, "numDevDn", input.float)
numDevUp  = input(0.8, "numDevUp", input.float)

coloredMobo     = input(true, "coloredMobo")
coloredFill     = input(true, "coloredFill")
breakArrows     = input(true, "breakArrows")
moboShowMid     = input(true, "moboShowMid")


//def DPO = price - Average(price[DPO_length / 2 + 1], DPO_length);
xsma = sma(price[int(dpoLength / 2 + 1)], dpoLength)
//alert(int(dpoLength / 2 + 1))
//xsma = sma(price, dpoLength)
DPO = price - xsma


Midline = sma(DPO, moboLength)

sDev = stdev(DPO, moboLength)

LowerBand = Midline + numDevDn * sDev
UpperBand = Midline + numDevUp * sDev

plot(DPO, color=color.yellow,linewidth=2)

plot(Midline, color=Midline > Midline[1] ? color.lime : color.red,linewidth=2)

Upper = plot(UpperBand, color=color.black,linewidth=1)
Lower = plot(LowerBand, color=color.black,linewidth=1)

plot(0, color=color.white,linewidth=1)

Signal1 = DPO > UpperBand and DPO[1] < UpperBand[1]
Signal2 = DPO < LowerBand and DPO[1] > LowerBand[1]

wasUp = 1
wasDn = 1

wasUp := Signal1 ? 1 : (Signal2 ? 0 : nz(wasUp[1]))
wasDn := Signal2 ? 1 : (Signal1 ? 0 : nz(wasDn[1]))

//plotshape(Signal1 and wasDn[1] ? UpperBand : na, style=shape.arrowup, location=location.absolute, size=size.normal, color=color.red)
//plotshape(Signal2 and wasUp[1] ? LowerBand : na, style=shape.arrowdown, location=location.absolute, size=size.normal, color=color.green)

plotshape(Signal1 and wasDn[1] ? UpperBand : na, style=shape.labelup, location=location.absolute, size=size.normal, color=color.green, text="Buy",textcolor=color.white)
plotshape(Signal2 and wasUp[1] ? LowerBand : na, style=shape.labeldown, location=location.absolute, size=size.normal, color=color.red, text="Sell",textcolor=color.white)


//fill(Upper, Lower, color=color.purple)

alertcondition(Signal1 and wasDn[1], "Break Out Arrow", "Break Out Arrow")
alertcondition(Signal2 and wasUp[1], "Break Down Arrow", "Break Down Arrow")


if Signal1 and wasDn[1]
    strategy.entry("Enter Long", strategy.long)
else if Signal2 and wasUp[1]
    strategy.entry("Enter Short", strategy.short)
- Chiến lược nhập khẩu chéo giữa hai mức trung bình động
- Chiến lược chéo trung bình di chuyển
- Chiến lược Bollinger Bands Breakout
- Chiến lược Bollinger Bands Standard Deviation Breakout
- Bollinger Bands Double Standard Deviation Filtering Chiến lược giao dịch định lượng 5 phút
- Chiến lược giao dịch Bitcoin, Binance Coin và Ethereum Pullback Multi-Timeframe
- MA99 Chiến lược dừng lỗ động và động
- DCA Dual Moving Average Turtle Trading Strategy (Chiến lược giao dịch trung bình chuyển động hai lần)
- RSI2 Chiến lược Trở lại trong ngày Tỷ lệ giành chiến thắng Backtest
- Hurst Các đường biên giới trong tương lai của chiến lược phân định
- Xu hướng theo chiến lược dựa trên tín hiệu chéo OBV và MA
- Phantom Trends theo dõi các cơ sở kinh doanh chiến lược
- Chiến lược theo dõi xu hướng ma
- Rainbow Oscillator
- Thương mại đường cong vốn chủ sở hữu ví dụ về kích thước vị trí
- KLineChart Demo
- Chiến lược siêu xu hướng Villa Dynamic Pivot
- Crodl's Supertrend
- RSI của zdmre
- FTL - Range Filter X2 + EMA + UO
- BRAHMASTRA
- SAR + 3SMMA với SL & TP
- SSS
- Mô hình cảnh báo phóng mặt trăng [Dấu hiệu]
- HALFTREND + HEMA + SMA (Chiến lược tín hiệu sai)
- RSI Divergence với Pivot, BB, SMA, EMA, SMMA, WMA, VWMA
- RSI và BB và đồng thời OverSold
- Quay nến Heikin Ashi
- Combo 2/20 EMA & Bandpass Filter
- ESSMA
- 3EMA