Kiểm tra ngược - Chỉ số
Tác giả:ChaoZhang, Ngày: 2022-05-17 13:59:05Tags:EMA
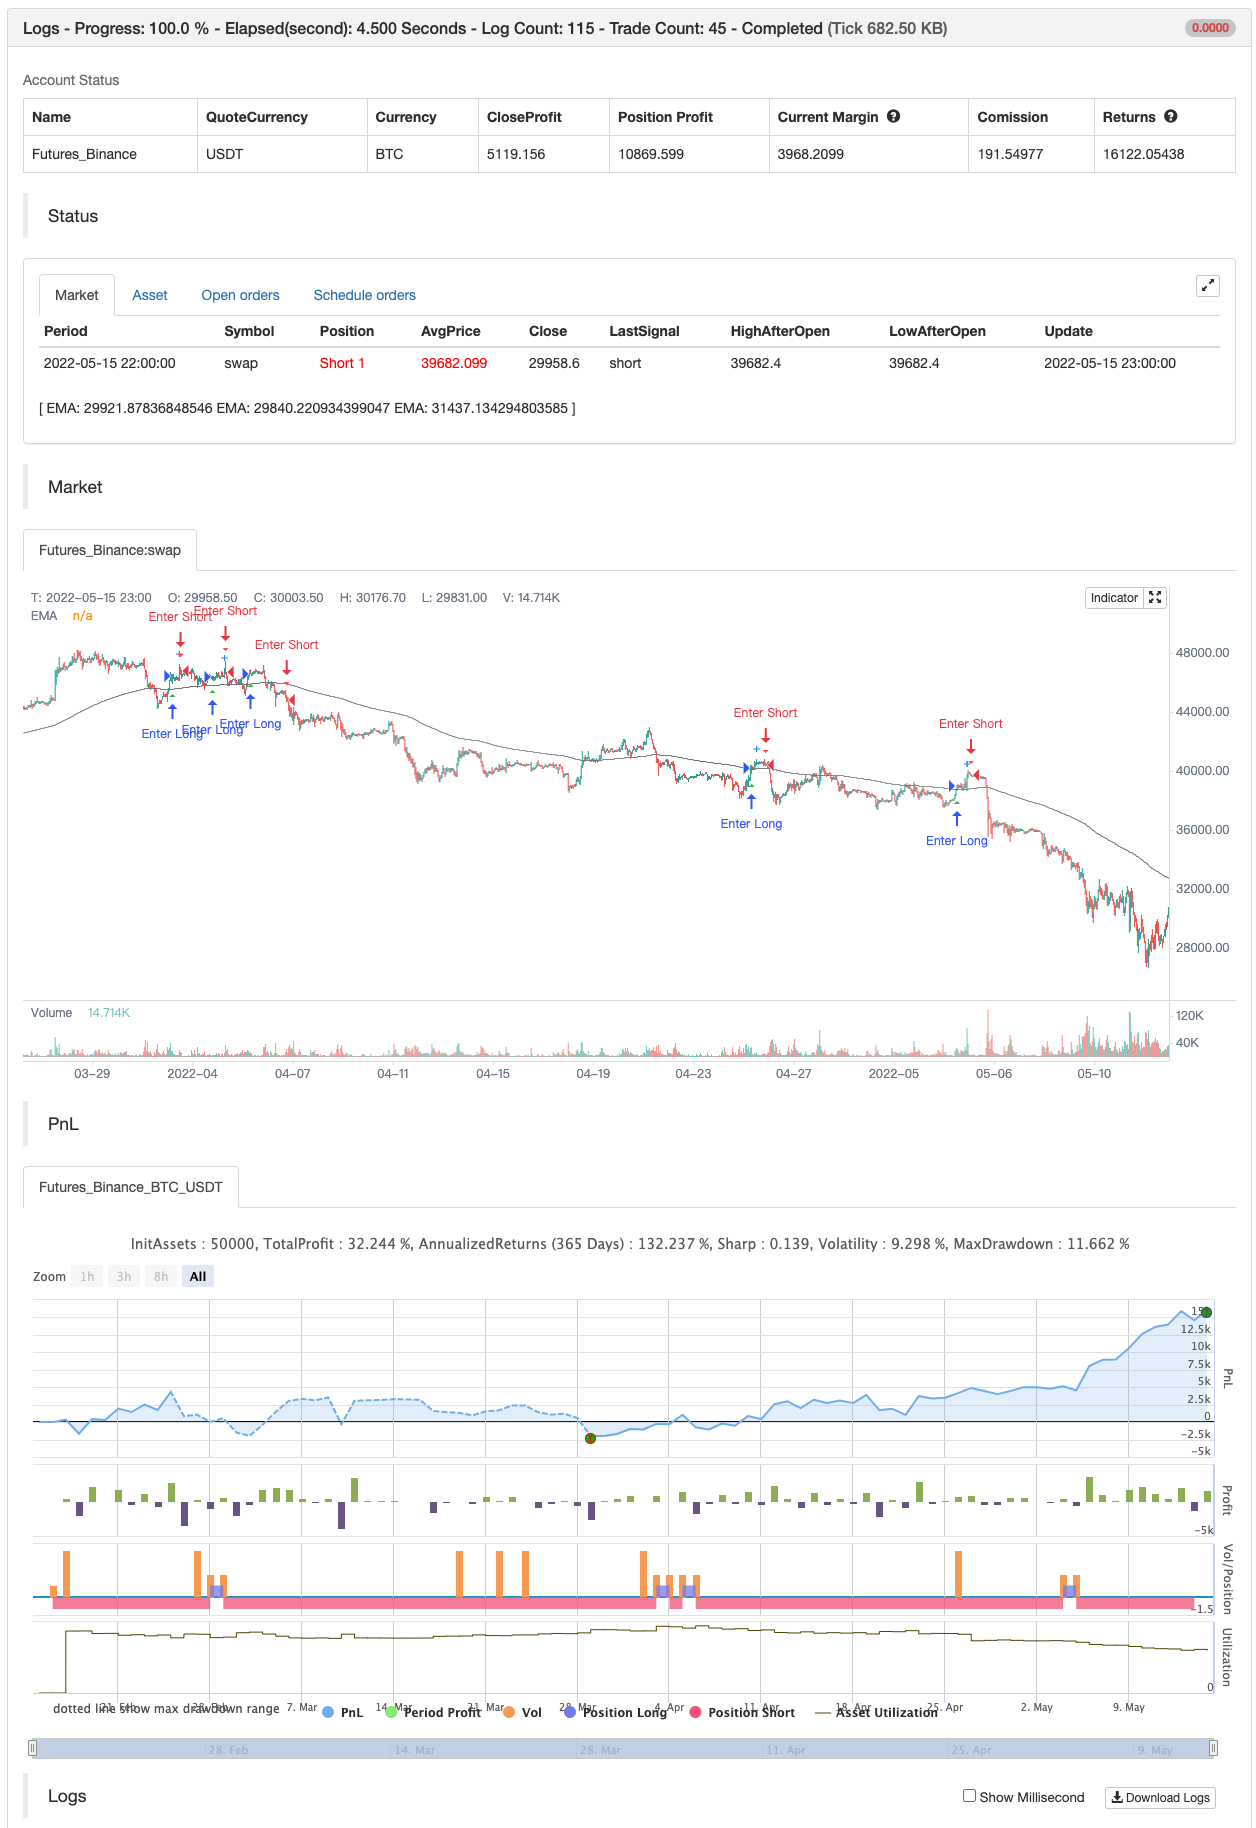
Đối với bất cứ ai quan tâm, đây là một ví dụ về cách đưa kết quả backtesting vào một chỉ số. Điều này tính toán các giá trị tương tự như bạn tìm thấy trong màn hình tóm tắt của backtester Chiến lược được xây dựng trong. Điều này sẽ sử dụng cùng kích thước kết quả như backtester tiêu chuẩn tức là biểu đồ 5 phút lấy khoảng 1 tháng dữ liệu, biểu đồ 1 phút lấy 1 tuần dữ liệu, vv... Tôi đã cố gắng giữ điều này tự chứa càng nhiều càng tốt vì vậy tôi đã đặt hầu hết các mã cho kết quả ở dưới cùng của chỉ số. Kết quả dừng lại tại tín hiệu giao dịch cuối cùng hoàn thành tức là mua có một bán cho nó. Đây là cùng một chỉ số tôi đã đăng trước đây với PCT Trailing StopLoss vì vậy bạn sẽ thấy mã đó ở đây. Như đã nói trong bài đăng trước của tôi, chỉ số chỉ là một EMA chéo đơn giản để cung cấp cho nó một cái gì đó hữu ích và tôi sẽ không khuyên bạn sử dụng chỉ số này trên chính nó, nhưng thay vào đó nếu bạn muốn sao chép lại chỉ số chiến lược, tôi cũng có thể tìm thấy nó để xác minh nếu bạn
Ghi chú bổ sung:
- Các kết quả nằm trong phạm vi phạm vi lỗi chấp nhận được do thực tế là chỉ số phải tính dựa trên khi tín hiệu mua và bán xảy ra trái ngược với khi giao dịch thực tế xảy ra như trong Backtester chiến lược
- Tôi đang cố gắng tìm cách để thiết lập số lượng tín hiệu mua để sử dụng tức là cho tôi thấy kết quả từ 100 giao dịch trước đây nhưng không thể sắp xếp logic. Tôi cởi mở với các đề xuất. Ngoài ra hãy nhớ rằng tôi không phải là một lập trình viên theo nghề nghiệp vì vậy nếu bạn có bất kỳ ý tưởng nào về mặt trước đó, xin vui lòng giải thích cho tôi như thể tôi là một đứa trẻ 5 tuổi và cung cấp ví dụ mã nếu có thể :)
- Tôi đã bao gồm các kết quả chiến lược trong ảnh chụp màn hình để bạn có thể thấy kết quả xếp hàng. Lưu ý bổ sung: Đây không phải là lời khuyên về tài chính.
backtest
/*backtest
start: 2022-02-16 00:00:00
end: 2022-05-16 00:00:00
period: 1h
basePeriod: 15m
exchanges: [{"eid":"Futures_Binance","currency":"BTC_USDT"}]
*/

// This source code is subject to the terms of the Mozilla Public License 2.0 at https://mozilla.org/MPL/2.0/
// © Thumpyr
//@version=5

/////////////////////////////////////////////////////////////////////////////////////////////
// Comment out Strategy Line and remove // from Indicator line to turn into Indicator  //////
// Do same for alertConidction at bottom                                               //////
/////////////////////////////////////////////////////////////////////////////////////////////
//strategy("Backtesting-Strategy", shorttitle="Backtesting- Strategy", overlay=true, margin_long=100, margin_short=100, default_qty_type=strategy.percent_of_equity,default_qty_value=90, commission_type=strategy.commission.percent, commission_value=.075)
indicator(title="Backtesting- Indicator", shorttitle="Backtesting - Indicator", overlay=true)//


openBalance  =input.float(3000, minval=0, title="Opening Balance:", group="Back Test")
pctAllocated =input.float(.9, minval=0, title="Allocated % (90% = .9):", group="Back Test")
commission   =input.float(.075, minval=0, title="Commission%", group="Back Test")


sellLow=input.float(.035, minval=0, title="Stop Loss Loss: 1% = .01", group="Sell Settings")
trailStopArm=input.float(.0065, minval=0, title="Trailing Stop Arm: 1%=.01", group="Sell Settings")
trailStopPct=input.float(.003, minval=0, title="Trailing Stop Trigger: 1%=.01 ", group="Sell Settings")

/////////////////////////////////////////////////
//               Indicators                    //
/////////////////////////////////////////////////
ema1Len = input.int(14, minval=1, title=" ema 1 Length", group="Trend Line Settings")
ema1Src = input(close, title="ema 1 Source", group="Trend Line Settings")
ema1 = ta.ema(ema1Src, ema1Len)
plot(ema1, title="EMA", color=color.blue)

ema2Len = input.int(22, minval=1, title=" ema 2 Length", group="Trend Line Settings")
ema2Src = input(close, title="ema 2 Source", group="Trend Line Settings")
ema2 = ta.ema(ema2Src, ema2Len)
plot(ema2, title="EMA", color=color.orange)

ema3Len = input.int(200, minval=1, title=" ema 3 Length", group="Trend Line Settings")
ema3Src = input(close, title="ema 2 Source", group="Trend Line Settings")
ema3 = ta.ema(ema3Src, ema3Len)
plot(ema3, title="EMA", color=color.gray)


/////////////////////////////
////   Buy Conditions    ////
/////////////////////////////

alertBuy = ta.crossover(ema1,ema2) and close>ema3

////////////////////////////////////////////////////////////////////
////   Filter redundant Buy Signals if Sell has not happened    ////
////////////////////////////////////////////////////////////////////
var lastsignal = 0
showAlertBuy   = 0
if(alertBuy and lastsignal != 1)
    showAlertBuy           := 1
    lastsignal             := 1
buyAlert= showAlertBuy     > 0

var buyActive = 0
if  buyAlert
    buyActive :=1

//////////////////////////////////////////////////////////////////
////          Track Conditions at buy Signal                  ////
//////////////////////////////////////////////////////////////////

alertBuyValue = ta.valuewhen(buyAlert, close,0)
alertSellValueLow = alertBuyValue - (alertBuyValue*sellLow)

////////////////////////////////////////////////////////////
/////            Trailing Stop                         /////
////////////////////////////////////////////////////////////
var TSLActive       = 0         //Check to see if TSL has been activated
var TSLTriggerValue = 0.0 //Initial and climbing value of TSL
var TSLStop         = 0.0       //Sell Trigger
var TSLRunning      = 0       //Continuously check each bar to raise TSL or not

//  Check if a Buy has been triggered and set initial value for TSL //
if buyAlert
    TSLTriggerValue := alertBuyValue+(alertBuyValue*trailStopArm)
    TSLActive  := 0
    TSLRunning := 1
    TSLStop := TSLTriggerValue - (TSLTriggerValue*trailStopPct)


//  Check that Buy has triggered and if Close has reached initial TSL//
//  Keeps from setting Sell Signal before TSL has been armed w/TSLActive//
beginTrail=TSLRunning==1 and TSLActive==0 and close>alertBuyValue+(alertBuyValue*trailStopArm) and ta.crossover(close,TSLTriggerValue)
if beginTrail
    TSLTriggerValue :=close
    TSLActive :=1
    TSLStop :=TSLTriggerValue - (TSLTriggerValue*trailStopPct)

//  Continuously check if TSL needs to increase and set new value //
runTrail= TSLActive==1 and (ta.crossover(close,TSLTriggerValue) or close>=TSLTriggerValue)
if runTrail
    TSLTriggerValue :=close
    TSLStop :=TSLTriggerValue - (TSLTriggerValue*trailStopPct)

//  Verify that TSL is active and trigger when close cross below TSL Stop//
TSL=TSLActive==1 and (ta.crossunder(close,TSLStop) or (close[1]>TSLStop and close<TSLStop))

// Plot point of inital arming of TSL//
TSLTrigger=TSLActive==1 and TSLActive[1]==0
plotshape(TSLTrigger, title='TSL Armed', location=location.abovebar, color=color.new(color.blue, 0), size=size.small, style=shape.cross, text='TSL Armed')


////////////////////////////////////////////////////////////
/////             Sell Conditions                    ///////
////////////////////////////////////////////////////////////
Sell1 = TSL
Sell2 = ta.crossunder(close,alertSellValueLow)

alertSell = Sell1 or Sell2
////////////////////////////////////////////////////////////

////////////////////////////////////////////////////////////
////        Remove Redundant Signals                    ////
////////////////////////////////////////////////////////////
showAlertSell = 0
if(alertSell and lastsignal != -1)
    showAlertSell           := 1
    lastsignal              := -1
sellAlert= showAlertSell    > 0

if sellAlert
    TSLActive  :=0
    TSLRunning :=0
    buyActive  :=0
/////////////////////////////////////////
//  Plot Buy and Sell Shapes on Chart  //
/////////////////////////////////////////
plotshape(buyAlert,  title='Buy' , location=location.belowbar , color=color.new(color.green, 0), size=size.small , style=shape.triangleup   , text='Buy')
plotshape(sellAlert, title='Sell', location=location.abovebar , color=color.new(color.red, 0)  , size=size.small , style=shape.triangledown , text='Sell')

/////////////////////////////////////////////////////////////////////////////////////////////
//                        Remove // on alertCondition to enable Alerts                     //
/////////////////////////////////////////////////////////////////////////////////////////////
//Alerts
alertcondition(title='Buy Alert', condition=buyAlert, message='Buy Conditions are Met')
alertcondition(title='Sell Alert', condition=sellAlert, message='Sell Conditions are Met')
/////////////////////////////////////////////////////////////////////////////////////////////


////////////////////////////////////////////////////////////
////  Comment out this section if setup as Indicator    ////
////////////////////////////////////////////////////////////
//longCondition = buyAlert
//if (longCondition)
//    strategy.entry("Buy", strategy.long)
//    alert(message='Buy', freq=alert.freq_once_per_bar_close)

//shortCondition = sellAlert
//if (shortCondition)
//    strategy.close_all(sellAlert,"Sell")
//    alert(message='Sell', freq=alert.freq_once_per_bar_close)
/////////////////////////////////////////////////////////////


if buyAlert
    strategy.entry("Enter Long", strategy.long)
else if sellAlert
    strategy.entry("Enter Short", strategy.short)
- Chiến lược giao dịch dựa trên các đường chéo vàng và chết MACD liên tiếp
- Chiến lược giao dịch RSI Bollinger Bands nâng cao
- Chiến lược chuyển đổi EMA ba lần
- Chiến lược đòn bẩy chéo trung bình chuyển động theo cấp số nhân
- GM-8 & ADX Chiến lược trung bình di chuyển kép
- Chiến lược chéo EMA tăng cường với RSI/MACD/ATR
- Xu hướng Z-Score theo chiến lược
- Mức đầu tư dài trên EMA với chiến lược quản lý rủi ro
- Chiến lược giao dịch VWAP
- WaveTrend Cross LazyBear Chiến lược
- Chiến lược giao dịch AlphaTradingBot
- SSL lai
- Cửa ra đèn chùm
- RISOTTO
- Chiến lược trong ngày của EMA
- Điểm trung tâm siêu xu hướng
- Supertrend+4 chuyển động
- ZigZag dựa trên động lượng
- VuManChu Cipher B + Divergences chiến lược
- Khái niệm Dual SuperTrend
- Super Scalper
- Trendycious
- Sma BTC killer
- Mẫu cảnh báo ML
- Tiến trình Fibonacci với các đoạn phá vỡ
- RSI MTF Ob+Os
- Fukuiz Octa-EMA + Ichimoku
- CCI MTF Ob+Os
- MACD thông minh hơn
- Chiến lược của OCC R5.1
- Chào mừng bạn đến chợ gấu.