Chiến lược đảo ngược xu hướng dựa trên dải Bollinger

Tổng quan
Chiến lược này dựa trên các chỉ số và đường trung bình di chuyển của Bollinger Bands để xác định xem giá có gần với đường giảm của Bollinger Bands hay không, để có lợi nhuận. Khi giá vượt qua đường giảm của Bollinger Bands, hãy nhìn xuống; khi giá vượt qua đường giảm của Bollinger Bands, hãy nhìn xa hơn.
Nguyên tắc
Chiến lược này chủ yếu đánh giá hai tín hiệu nhập cảnh sau:
-
Tín hiệu đa đầu: khi giá đóng cửa chạm đường ray xuống và giá đóng cửa cao hơn đường trung bình EMA, thực thể đường K trước là đường âm và thực thể đường K hiện tại là đường dương.
-
Tín hiệu trống: Khi giá đóng cửa chạm đường lên và giá đóng cửa thấp hơn đường trung bình EMA, thực thể đường K trước là đường dương và thực thể đường K hiện tại là đường âm.
Phương pháp dừng lỗ: Cài đặt dừng lỗ. Điểm dừng lỗ là chi phí đầu vào với hệ số lợi nhuận rủi ro gấp nhiều lần so với khoảng cách đường ray đối thủ.
Phương pháp dừng chân: mục tiêu là làm lợi nhuận cho đối thủ. Đó là làm nhiều dừng chân xuống đường ray, làm trống dừng chân lên đường ray.
Ưu điểm
-
Kết hợp các lợi thế của chiến lược biến đổi xu hướng và đảo ngược, nó có thể hoạt động tốt hơn trong các biến động xu hướng.
-
Sử dụng chỉ số BRI để đánh giá các khu vực quá mua và quá bán để đánh giá chính xác cơ hội đảo ngược.
-
Các điểm dừng cố định được thiết lập hợp lý để giúp kiểm soát rủi ro.
-
Cách di động để tăng lợi nhuận.
Rủi ro
-
Các chiến lược đột phá dễ bị đánh giá cao, nên hãy cảnh giác với các đột phá giả.
-
Các lệnh dừng có thể được kích hoạt thường xuyên khi giao dịch quá chấn động.
-
Hạn chế cố định không thể điều chỉnh theo biến động của thị trường và có thể quá thoải mái hoặc quá quyết liệt.
-
Nếu bạn đặt các tham số trong vòng Brin không đúng lúc, hiệu quả có thể không tốt.
Tối ưu hóa tư duy
-
Có thể xem xét kết hợp các chỉ số RSI để lọc tín hiệu đầu vào, ví dụ RSI cao hơn 50 làm thêm, RSI thấp hơn 50 làm trống, để tránh tín hiệu sai.
-
Thêm chức năng tự động điều chỉnh khoảng cách dừng cố định, làm cho dừng trở nên linh hoạt hơn. Ví dụ: thiết lập khoảng cách dừng động theo chỉ số ATR.
-
Tối ưu hóa các tham số của vùng Brin, tìm kiếm sự kết hợp tham số tốt nhất.
-
Có thể thử nghiệm các tham số đường trung bình khác nhau của EMA để tối ưu hóa hiệu ứng của đường trung bình.
Tóm tắt
Chiến lược này tính đến xu hướng và đảo ngược, sử dụng Brin để xác định điểm mua quá mức và bán quá mức để vào thị trường, bằng cách di chuyển dừng để tối đa hóa lợi nhuận. Hiệu suất tốt hơn trong tình huống biến động xu hướng. Tuy nhiên, cần chú ý để phòng ngừa sự cố bị đặt, đồng thời điều chỉnh các tham số để tối ưu hóa hiệu quả chiến lược.
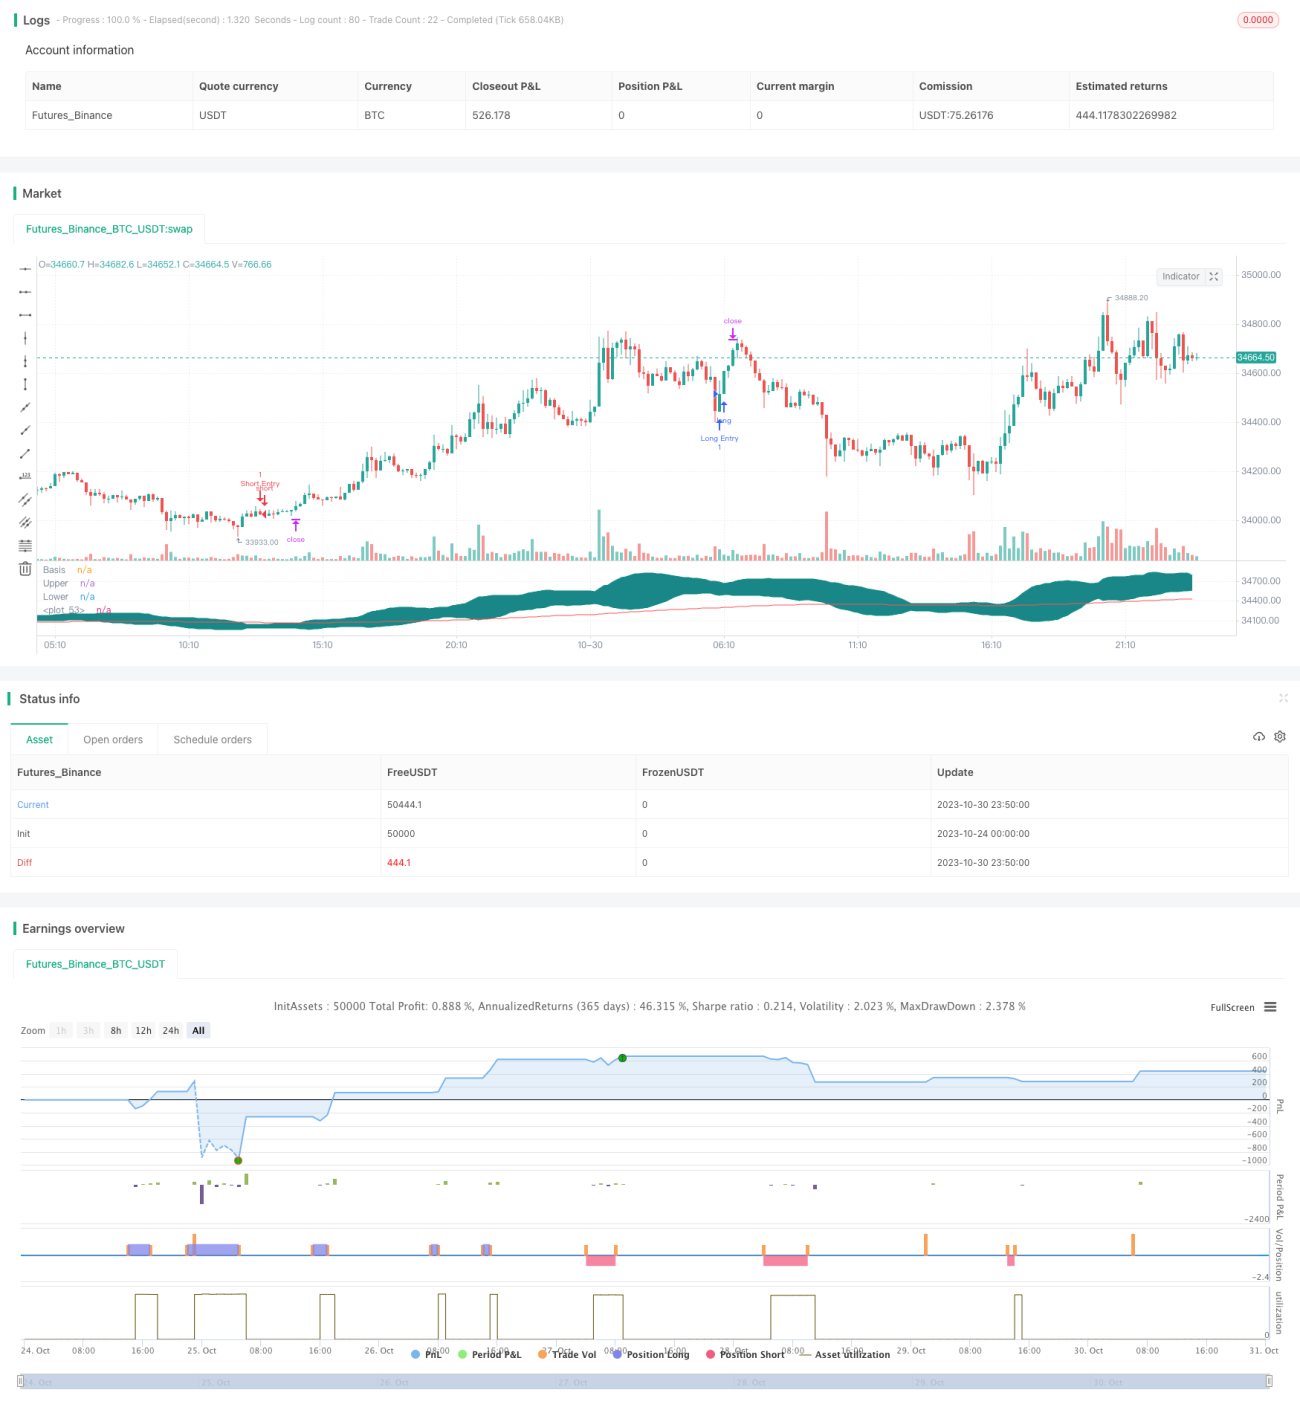
/*backtest
start: 2023-10-24 00:00:00
end: 2023-10-31 00:00:00
period: 10m
basePeriod: 1m
exchanges: [{"eid":"Futures_Binance","currency":"BTC_USDT"}]
*/

//@version=4

// Welcome to yet another script. This script was a lot easier since I was stuck for so long on the Donchian Channels one and learned so much from that one that I could use in this one
// This code should be a lot cleaner compared to the Donchian Channels, but we'll leave that up to the pro's- 1