
Bài viết này giới thiệu một chiến lược giao dịch đột phá động lực dựa trên hình dạng K-line. Chiến lược này đánh giá xu hướng thị trường và thời gian nhập cảnh bằng cách nhận biết hình dạng con lằn.
Chiến lược đột phá động lực chủ yếu đánh giá tín hiệu đảo ngược tiềm năng, đi vào sân bằng cách nhận ra hình thức ăn nhiều đầu hoặc hình thức ăn không. Sau khi nhận ra tín hiệu, hãy nhanh chóng theo dõi xu hướng và đạt được lợi nhuận vượt mức.
Logic phán đoán cốt lõi của chiến lược đột phá động lực dựa trên nhận diện hình thức nuốt, hình thức nuốt được phân chia thành hai loại nuốt đa đầu và nuốt đầu trống.
Nhiều đầu nuốt có nghĩa là giá đóng cửa ngày cao hơn giá mở cửa và giá đóng cửa của dòng K trước thấp hơn giá mở cửa của dòng K trước. Hình thức này thường cho thấy sự thay đổi của tâm trạng thị trường, tâm lý đa không gian bị đảo ngược, vì vậy đây là thời điểm tốt để thực hiện theo dõi thích hợp.
Ăn đầu rỗng là điều ngược lại với ăn đầu nhiều, nghĩa là giá đóng cửa trong ngày thấp hơn giá mở và giá đóng cửa của dòng K trên cao hơn giá mở của dòng K trước. Điều này cũng cho thấy sự thay đổi tâm lý thị trường và do đó là cơ hội để can thiệp đầu rỗng.
Sau khi nhận ra các hình thức ăn uống, chiến lược phá vỡ động lực sẽ nhanh chóng thiết lập vị trí, thực hiện vượt quá đòn bẩy và theo dõi xu hướng đảo ngược tiềm năng. Ngoài ra, chiến lược cũng sẽ động điều chỉnh giá dừng lỗ và giá dừng, kiểm soát rủi ro nghiêm ngặt trong khi đảm bảo lợi nhuận.
Đối với các rủi ro, có thể tối ưu hóa theo các khía cạnh sau:
Chiến lược đột phá động lực có thể được tối ưu hóa từ các chiều sau:
Xác minh đa yếu tố tín hiệu Có thể thêm các chỉ số như đường trung bình, tỷ lệ dao động để xác minh tín hiệu ăn vào, đảm bảo độ tin cậy của tín hiệu.
Kết hợp các chỉ số cảm xúc để đánh giá tâm lý thị trường Kết hợp với chỉ số cảm xúc của thị trường, chẳng hạn như chỉ số hoảng loạn và chỉ số tham lam, nó có thể đánh giá chính xác hơn khi thị trường đảo ngược.
Tối ưu hóa chiến lược dừng lỗ Có thể khóa lợi nhuận bằng cách dừng di chuyển, dừng dần và dừng di chuyển để giảm nguy cơ rút tiền.
Tiến hành giao dịch thuật toán Các mô hình thuật toán như học máy có thể được sử dụng để hỗ trợ đánh giá các tín hiệu giao dịch, nâng cao mức độ tự động hóa chiến lược.
Chiến lược phá vỡ động lực nói chung là một chiến lược đảo ngược điển hình hơn. Nó đảo ngược xu hướng thị trường bằng cách nắm bắt các tín hiệu K quan trọng, phán đoán nhanh và theo dõi xu hướng thị trường. Mặc dù vẫn còn một số rủi ro, nhưng có thể được tối ưu hóa hiệu quả bằng nhiều cách, kiểm soát rủi ro lợi nhuận trong một khoảng cách hợp lý, phù hợp cho các nhà đầu tư tích cực.
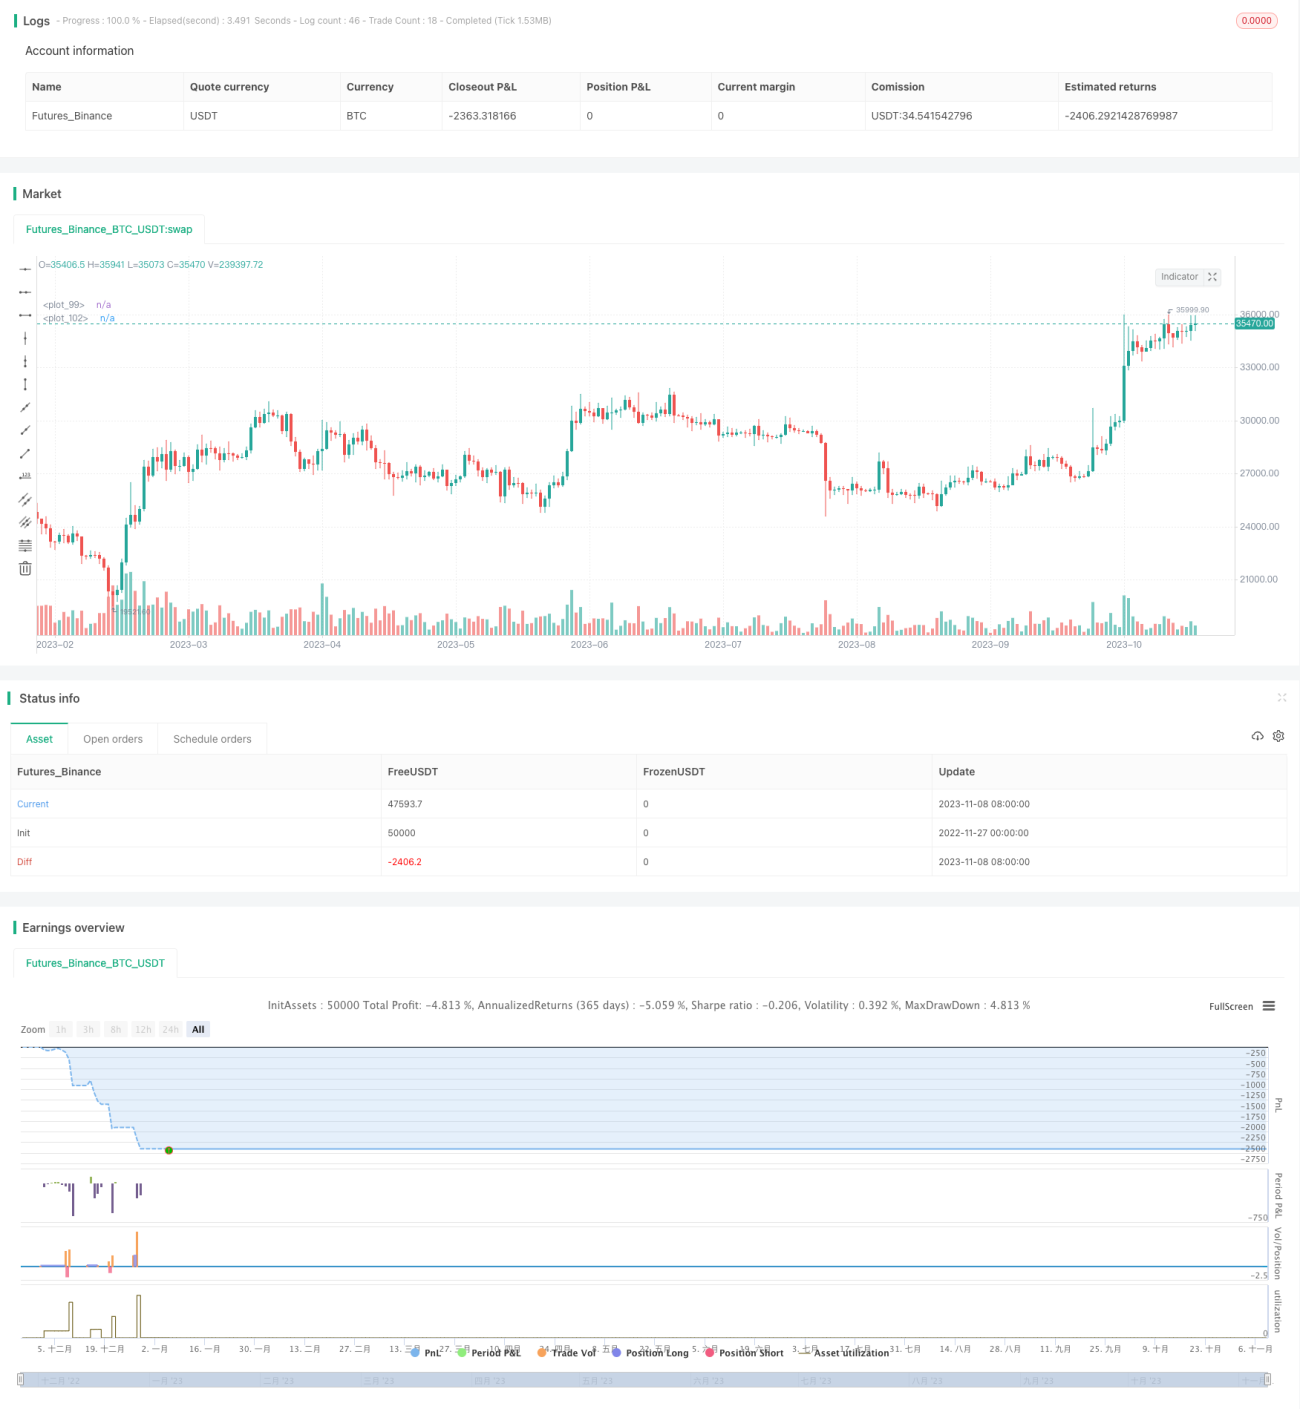
/*backtest
start: 2022-11-27 00:00:00
end: 2023-11-09 05:20:00
period: 1d
basePeriod: 1h
exchanges: [{"eid":"Futures_Binance","currency":"BTC_USDT"}]
*/
//@version=5
strategy(title = "MomGulfing", shorttitle = "MomGulfing", overlay = true, initial_capital=10000, pyramiding=3, calc_on_order_fills=false, calc_on_every_tick=false, currency="USD", default_qty_type=strategy.cash, default_qty_value=1000, commission_type=strategy.commission.percent, commission_value=0.04)
syear = input(2021)
smonth = input(1)
sday = input(1)
fyear = input(2022)
fmonth = input(12)
fday = input(31)
start = timestamp(syear, smonth, sday, 01, 00)
finish = timestamp(fyear, fmonth, fday, 23, 59)
date = time >= start and time <= finish ? true : false
longs = input(true)
shorts = input(true)
rr = input(2.5)
position_risk_percent = input(1)/100
signal_bar_check = input.string(defval="3", options=["1", "2", "3"])
margin_req = input(80)
sl_increase_factor = input(0.2)
tp_decrease_factor = input(0.0)
check_for_volume = input(true)
var long_sl = 0.0
var long_tp = 0.0
var short_sl = 0.0
var short_tp = 0.0
var long_lev = 0.0
var short_lev = 0.0
initial_capital = strategy.equity
position_risk = initial_capital * position_risk_percent
bullishEngulfing_st = close[1] < open[1] and close > open and high[1] < close and (check_for_volume ? volume[1]<volume : true)
bullishEngulfing_nd = close[2] < open[2] and close[1] > open[1] and close > open and high[2] > close[1] and high[2] < close and (check_for_volume ? volume[2]<volume : true)
bullishEngulfing_rd = close[3] < open[3] and close[2] > open[2] and close[1] > open[1] and close > open and high[3] > close[2] and high[3] > close[1] and high[3] < close and (check_for_volume ? volume[3]<volume : true)
bullishEngulfing = signal_bar_check == "1" ? bullishEngulfing_st : signal_bar_check == "2" ? bullishEngulfing_st or bullishEngulfing_nd : bullishEngulfing_st or bullishEngulfing_nd or bullishEngulfing_rd
long_stop_level = bullishEngulfing_st ? math.min(low[1], low) : bullishEngulfing_nd ? math.min(low[2], low[1], low) : bullishEngulfing_rd ? math.min(low[3], low[2], low[1], low) : na
rr_amount_long = close-long_stop_level
long_exit_level = close + rr*rr_amount_long
long_leverage = math.floor(margin_req/math.floor((rr_amount_long/close)*100))
bearishEngulfing_st = close[1] > open[1] and close < open and low[1] > close and (check_for_volume ? volume[1]<volume : true)
bearishEngulfing_nd = close[2] > open[2] and close[1] < open[1] and close < open and low[2] < close[1] and low[2] > close and (check_for_volume ? volume[2]<volume : true)
bearishEngulfing_rd = close[3] > open[3] and close[2] < open[2] and close[1] < open[1] and close < open and low[3] < close[2] and low[3] < close[1] and low[3] > close and (check_for_volume ? volume[3]<volume : true)
bearishEngulfing = signal_bar_check == "1" ? bearishEngulfing_st : signal_bar_check == "2" ? bearishEngulfing_st or bearishEngulfing_nd : bearishEngulfing_st or bearishEngulfing_nd or bearishEngulfing_rd
short_stop_level = bearishEngulfing_st ? math.max(high[1], high) : bearishEngulfing_nd ? math.max(high[2], high[1], high) : bearishEngulfing_rd ? math.max(high[3], high[2], high[1], high) : na
rr_amount_short = short_stop_level-close
short_exit_level = close - rr*rr_amount_short
short_leverage = math.floor(margin_req/math.floor((rr_amount_short/short_stop_level)*100))
long = longs and date and bullishEngulfing
short = shorts and date and bearishEngulfing
bgcolor(long[1] ? color.new(color.teal, 80) : (short[1] ? color.new(color.purple, 80) : na))
if long and strategy.position_size <= 0
long_lev := long_leverage
if short and strategy.position_size >= 0
short_lev := short_leverage
long_pos_size = long_lev * position_risk
long_pos_qty = long_pos_size/close
short_pos_size = short_lev * position_risk
short_pos_qty = short_pos_size/close
if long
if strategy.position_size <= 0
long_sl := long_stop_level
long_tp := long_exit_level
else if strategy.position_size > 0
long_sl := long_stop_level + sl_increase_factor*rr_amount_long
long_tp := long_exit_level - tp_decrease_factor*rr_amount_long
strategy.entry("L"+str.tostring(long_lev)+"X", strategy.long, qty=long_pos_qty)
label_text = str.tostring(long_lev)+"X\nSL:"+str.tostring(long_sl)+"\nTP:"+str.tostring(long_tp)
label.new(bar_index+1, na, text=label_text, color=color.green, style=label.style_label_up, xloc=xloc.bar_index, yloc=yloc.belowbar)
else if short
if strategy.position_size >= 0
short_sl := short_stop_level
short_tp := short_exit_level
else if strategy.position_size < 0
short_sl := short_stop_level - sl_increase_factor*rr_amount_short
short_tp := short_exit_level + tp_decrease_factor*rr_amount_short
strategy.entry("S"+str.tostring(short_lev)+"X", strategy.short, qty=short_pos_qty)
label_text = str.tostring(short_lev)+"X\nSL:"+str.tostring(short_sl)+"\nTP:"+str.tostring(short_tp)
label.new(bar_index+1, na, text=label_text, color=color.red, style=label.style_label_down, xloc=xloc.bar_index, yloc=yloc.abovebar)
if (strategy.position_size > 0)
strategy.exit(id="L TP/SL", stop=long_sl, limit=long_tp)
if (strategy.position_size < 0)
strategy.exit(id="S TP/SL", stop=short_sl, limit=short_tp)
sl_level = strategy.position_size > 0 ? long_sl : strategy.position_size < 0 ? short_sl : na
plot(sl_level, color=color.red, style=plot.style_linebr)
tp_level = strategy.position_size > 0 ? long_tp : strategy.position_size < 0 ? short_tp : na
plot(tp_level, color=color.green, style=plot.style_linebr)