Chiến lược giao dịch định lượng bộ lọc động
Tổng quan về chiến lược
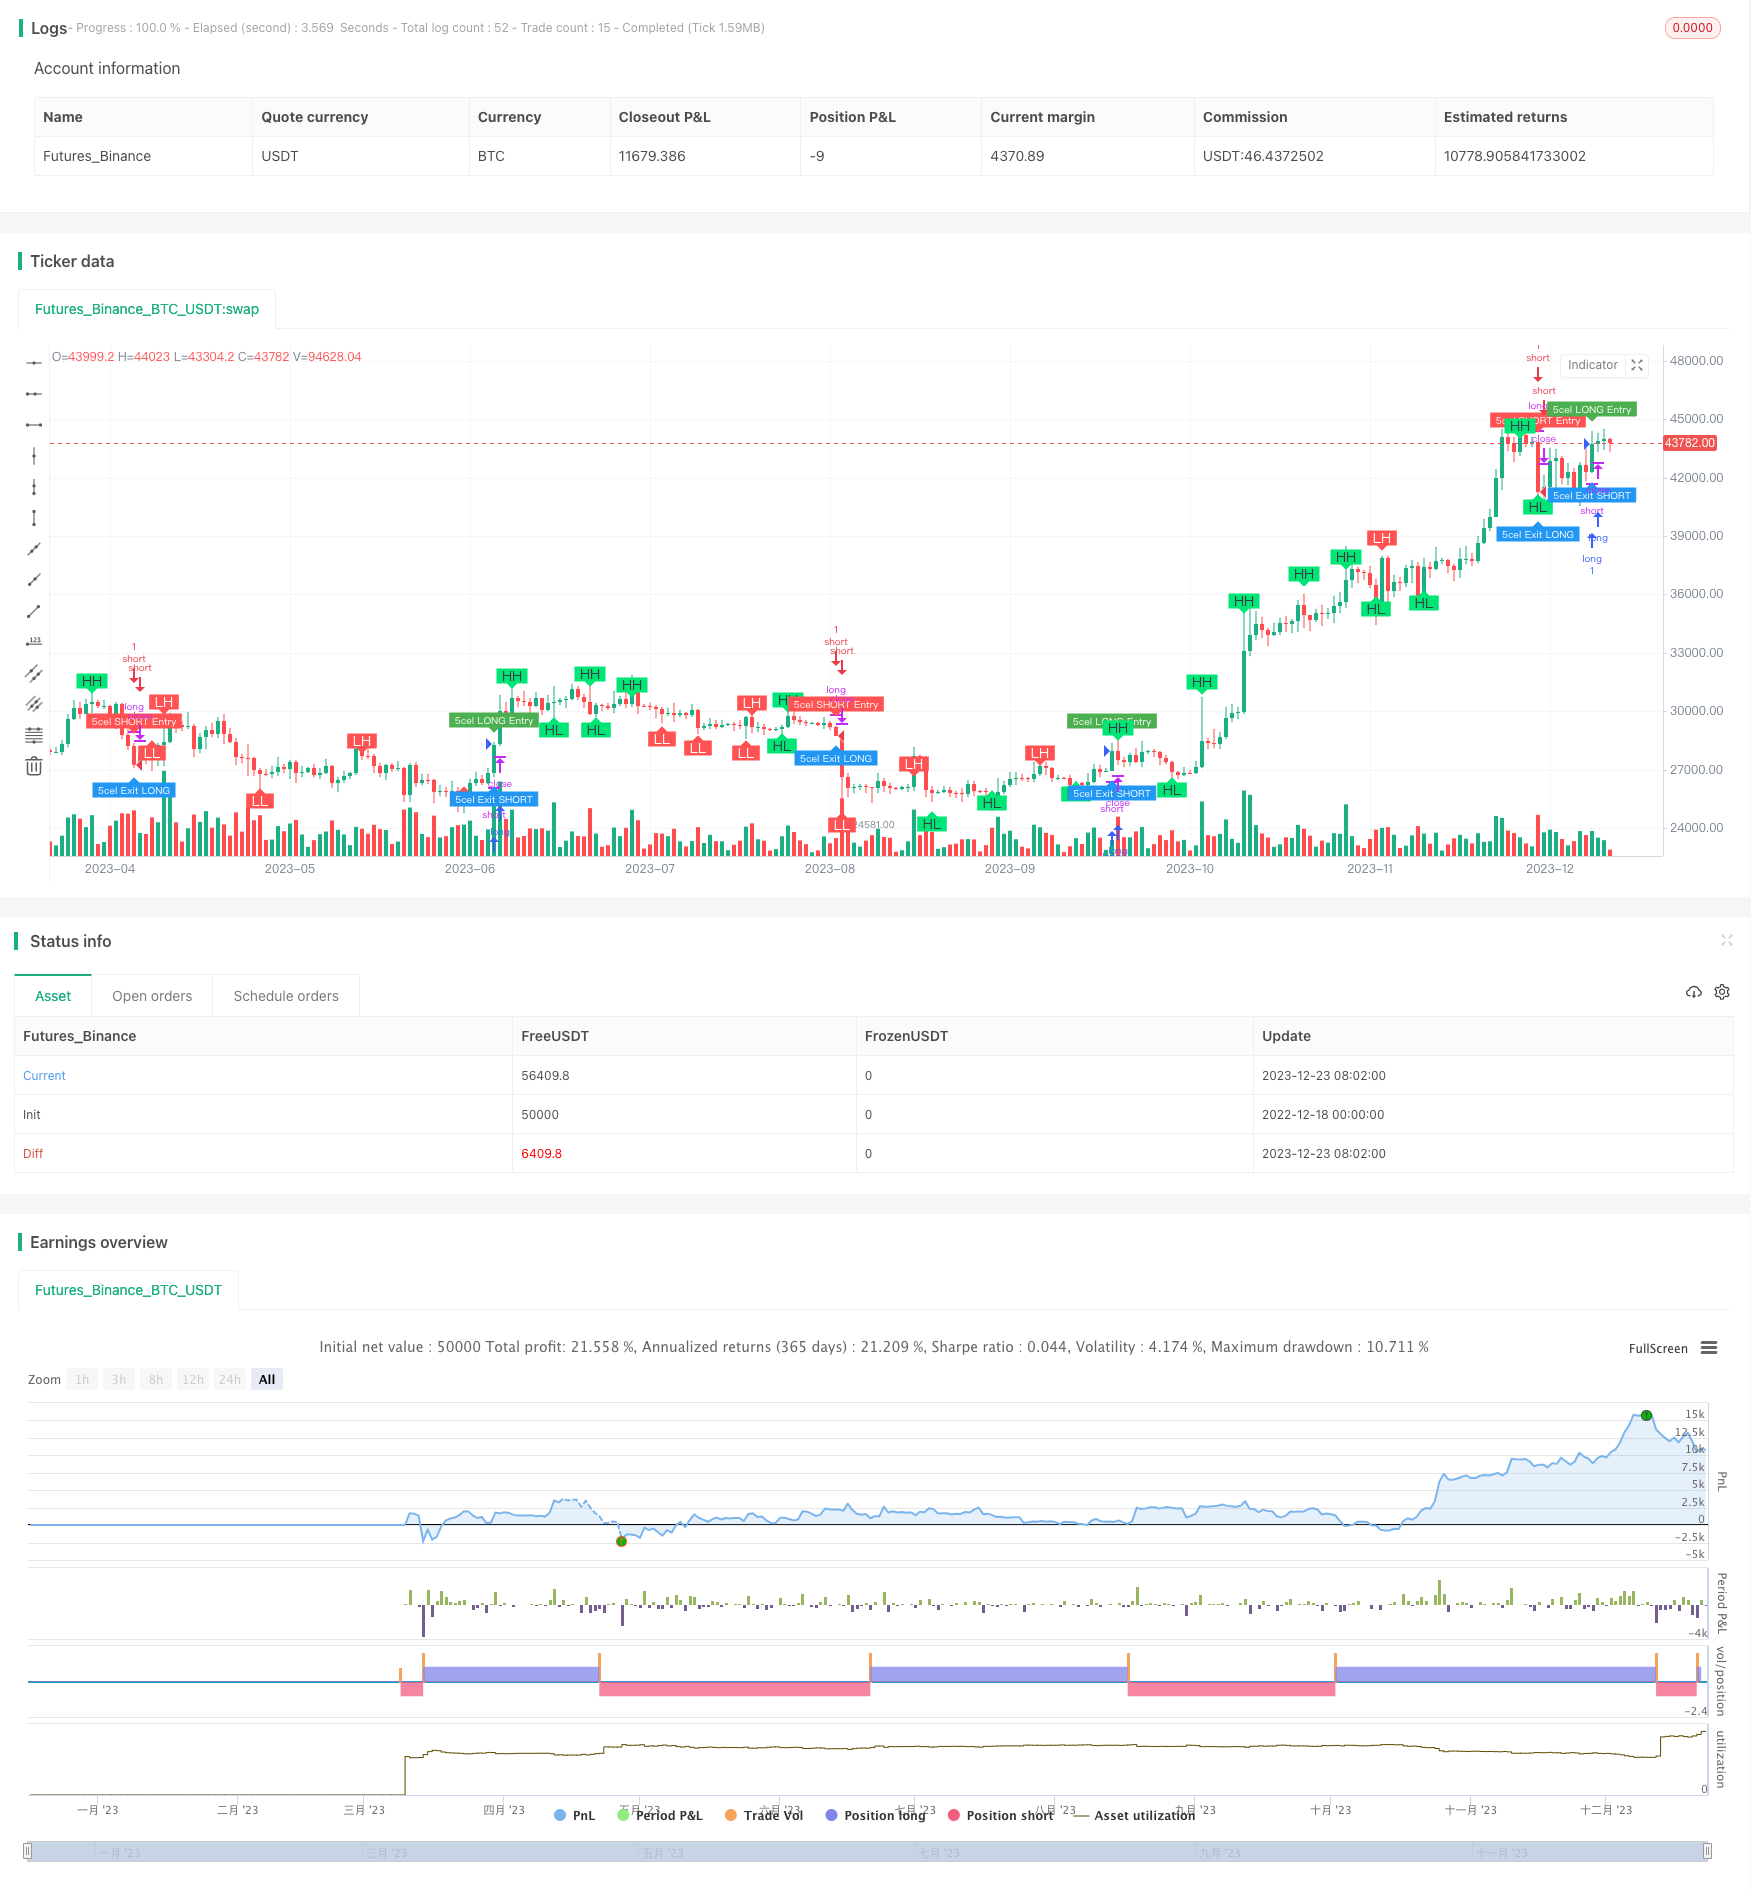
Chiến lược này được đặt tên là Chiến lược giao dịch định lượng bộ lọc động (Dynamic Filter Quant Trading Strategy), sử dụng các chỉ số bộ lọc phạm vi kết hợp với nhiều chỉ số kỹ thuật để thực hiện giao dịch theo dõi xu hướng tự động trên đồng tiền điện tử BTCUSDT. Chiến lược này áp dụng cho giao dịch định lượng tần số cao, khóa lợi nhuận bằng cách điều chỉnh động lệnh dừng lỗ, giảm rút lui.
Nguyên tắc chiến lược
Chỉ số cốt lõi của chiến lược này là bộ lọc phạm vi, nó tạo ra một đường trung bình dựa trên phạm vi biến động giá thống kê. Khi giá vượt qua đường trung bình, nó tạo ra tín hiệu giao dịch. Ngoài ra, chiến lược này kết hợp các chỉ số RSI để đánh giá quá mua quá bán, đường trung bình để đánh giá xu hướng, MACD để đánh giá động lực và các chỉ số khác để lọc kết hợp, tạo ra tín hiệu giao dịch đáng tin cậy hơn.
Cụ thể, đường trung tâm của bộ lọc phạm vi được lấy dựa trên đường trung bình di chuyển chỉ số của phạm vi biến động giá, và định hướng được xác định dựa trên sức mạnh và tốc độ phá vỡ đường trung tâm đó. Một tín hiệu phá vỡ mạnh sẽ được tạo ra khi giá vượt qua đường trung tâm một vài đường K liên tiếp.
Chỉ số RSI được sử dụng để xác định tình trạng quá mua quá bán để xác nhận tín hiệu bộ lọc. Đường trung bình được đánh giá là xu hướng lên khi đi lên và xu hướng xuống khi đi xuống. Chỉ số MACD đánh giá liệu động lực thị trường có đủ để tạo ra xu hướng hay không.
Kết hợp các chỉ số này, bạn có thể xác định điểm phá vỡ xu hướng đáng tin cậy hơn như là thời gian để thiết lập vị thế.
Phân tích lợi thế
Ưu điểm lớn nhất của chiến lược này là kết hợp nhiều chỉ số để đưa ra quyết định thay vì dựa vào chỉ số kỹ thuật đơn lẻ, có thể làm giảm hiệu quả khả năng giao dịch sai và đảm bảo tín hiệu giao dịch đáng tin cậy hơn. Ngoài ra, tham số điều chỉnh động cũng giúp chiến lược có thể thích ứng với sự thay đổi của thị trường.
Một lợi thế khác là có thể giao dịch tần số cao. Chỉ số bộ lọc phạm vi nhạy cảm với biến động giá trong chu kỳ nhỏ, có nghĩa là chiến lược có thể mở vị trí yên bình trong thời gian ngắn hơn, do đó rất phù hợp với tần số cao và cho phép kiếm lợi nhuận trong thị trường tiền điện tử biến động lớn.
Phân tích rủi ro
Chiến lược này vẫn có một số rủi ro. Đầu tiên là rủi ro đánh giá hình thức kỹ thuật không hiệu quả, vì các chỉ số không thể đảm bảo 100% về xu hướng giá. Khi giá đảo ngược, có thể dẫn đến dừng lỗ.
Một rủi ro chính khác là đường trung tâm của bộ lọc phạm vi không thể lọc hoàn toàn các biến động giá. Khi có biến động giá lớn hơn phạm vi đường trung tâm, đường trung tâm sẽ bị mất hiệu lực, dẫn đến nguy cơ tạo ra tín hiệu sai. Trong trường hợp này, các tham số có thể được nới lỏng thích hợp, mở rộng phạm vi đường trung tâm.
Cuối cùng, giao dịch tần số cao cũng có một số rủi ro. Khi tần số giao dịch quá cao, chi phí giao dịch sẽ lớn hơn và có thể bù đắp một phần lợi nhuận. Trong trường hợp này, có thể giảm tần số giao dịch và thời gian giữ vị trí thích hợp.
Tối ưu hóa chiến lược
Chiến lược này còn có không gian để tối ưu hóa hơn nữa. Ví dụ, bạn có thể xem xét kết hợp nhiều chỉ số hơn, chẳng hạn như chỉ số biến động xác nhận xu hướng, thực hiện các điều kiện lọc nghiêm ngặt hơn để đảm bảo tín hiệu giao dịch chính xác hơn. Hoặc nghiên cứu các quy luật về hành vi giá của các đồng tiền điện tử và cổ phiếu khác nhau để thiết lập các tham số chỉ số phù hợp nhất với chúng.
Từ logic giao dịch, bạn cũng có thể thiết lập mức dừng động và mức dừng chân. Nói cách khác, mở rộng phạm vi dừng để khóa nhiều lợi nhuận khi số lượng nắm giữ lớn hơn. Hoặc tăng tốc độ dừng chân khi lợi nhuận lớn hơn. Điều này có thể làm giảm sự rút lui ở một mức độ nhất định.
Cuối cùng, các tham số của bộ lọc có thể được tối ưu hóa, tìm ra một tập hợp các tham số làm cho phạm vi đường trung tâm có thể lọc các biến động hiệu quả và có thể nắm bắt các điểm biến động xu hướng. Điều này đòi hỏi một lượng lớn dữ liệu đo lường lại để phân tích lặp đi lặp lại.
Tóm tắt
Chiến lược này kết hợp thành công với nhiều chỉ số để đánh giá, tạo thành một chiến lược giao dịch có độ tin cậy cao, phù hợp để áp dụng cho giao dịch định lượng tần số cao. Sau khi được tối ưu hóa và cải tiến liên tục, tin rằng có thể thu được lợi nhuận ổn định, đáng để phát triển hơn nữa.
/*backtest
start: 2022-12-18 00:00:00
end: 2023-12-24 00:00:00
period: 1d
basePeriod: 1h
exchanges: [{"eid":"Futures_Binance","currency":"BTC_USDT"}]
*/

//@version=5
strategy(title='5cel Scalp Strategy BTCUSDT Long & Short 30 Min', shorttitle='BTCUSDT Long & Short Scalp 30m', precision=1, overlay=true)

//Swing Call - Based on RSI Overbought & Oversold
//#### Starts Here #####
ema_value = input(5)
sma_value = input(50)
ema1 = ta.ema(close, ema_value)
sma2 = ta.sma(close, sma_value)
rs = ta.rsi(close, 14)

iff_1 = high < sma2 ? color.red : color.yellow
iff_2 = low > sma2 ? color.lime : iff_1
mycolor = rs >= 85 or rs <= 15 ? color.yellow : iff_2

//For Main Strategy
bool swingCallGreen = false
bool swingCallRed = false
bool swingCallYellow = false

if rs >= 85 or rs <= 15
    //color.yellow
    swingCallGreen := false
    swingCallRed := false
    swingCallYellow := true
    swingCallYellow
else
    if low > sma2
        //color.lime
        swingCallGreen := true
        swingCallRed := false
        swingCallYellow := false
        swingCallYellow
        //color.red
    else if high < sma2
        swingCallGreen := false
        swingCallRed := true
        swingCallYellow := false
        swingCallYellow
    else
        //color.yellow
        swingCallGreen := false
        swingCallRed := false
        swingCallYellow := true
        swingCallYellow

hlong = input.int(80, title='Overbought limit of RSI', step=1)
ll = input.int(20, title='Oversold limit of RSI', step=1)

buyexit = ta.crossunder(rs, hlong)
sellexit = ta.crossover(rs, ll)

sellcall = ta.crossover(sma2, ema1) and open > close
buycall = ta.crossunder(sma2, ema1) and high > sma2
//#### Ends Here #####


//Parabolic SAR -  Trend Circles
//#### Starts Here #####
start = input.int(2, minval=0, maxval=10, title='Start - Default = 2 - Multiplied by .01')
increment = input.int(2, minval=0, maxval=10, title='Step Setting (Sensitivity) - Default = 2 - Multiplied by .01')
maximum = input.int(2, minval=1, maxval=10, title='Maximum Step (Sensitivity) - Default = 2 - Multiplied by .10')
sus = input(true, 'Show Up Trending Parabolic Sar')
sds = input(true, 'Show Down Trending Parabolic Sar')
disc = input(false, title='Start and Step settings are *.01 so 2 = .02 etc, Maximum Step is *.10 so 2 = .2')

startCalc = start * .01
incrementCalc = increment * .01
maximumCalc = maximum * .10

sarUp = ta.sar(startCalc, incrementCalc, maximumCalc)
sarDown = ta.sar(startCalc, incrementCalc, maximumCalc)

colUp = close >= sarDown ? color.lime : na
colDown = close <= sarUp ? color.red : na

parabolicSARGreen = ta.sar(startCalc, incrementCalc, maximumCalc)
parabolicSARRed = ta.sar(startCalc, incrementCalc, maximumCalc)
//#### Ends Here #####


//EMA Line
//#### Starts Here #####
ema100 = ta.ema(close, 100)
//#### Ends Here #####


// Ichimoku Cloud
//#### Starts Here #####
sCloud = input(false, 'Show Ichimoku lines')

// Colors
colorGreen = #00ff00
colorRed = #ff0000
colorTenkanViolet = #9400D3
colorKijun = #fdd8a0
colorLime = #006400
colorMaroon = #8b0000

//Periods are set to standard
tenkanPeriods = input.int(9, minval=1, title='Tenkan')
kijunPeriods = input.int(26, minval=1, title='Kijun')
chikouPeriods = input.int(52, minval=1, title='Chikou')
displacement = input.int(26, minval=1, title='Offset')

donchian(len) =>
    math.avg(ta.lowest(len), ta.highest(len))

tenkan = donchian(tenkanPeriods)
kijun = donchian(kijunPeriods)
senkouA = math.avg(tenkan, kijun)
senkouB = donchian(chikouPeriods)
displacedSenkouA = senkouA[displacement]
displacedSenkouB = senkouB[displacement]

bullishSignal = ta.crossover(tenkan, kijun)
bearishSignal = ta.crossunder(tenkan, kijun)

bullishSignalValues = bullishSignal ? tenkan : na
bearishSignalValues = bearishSignal ? tenkan : na


strongBullishSignal = bullishSignalValues > displacedSenkouA and bullishSignalValues > displacedSenkouB
neutralBullishSignal = bullishSignalValues > displacedSenkouA and bullishSignalValues < displacedSenkouB or bullishSignalValues < displacedSenkouA and bullishSignalValues > displacedSenkouB
weakBullishSignal = bullishSignalValues < displacedSenkouA and bullishSignalValues < displacedSenkouB

strongBearishSignal = bearishSignalValues < displacedSenkouA and bearishSignalValues < displacedSenkouB
neutralBearishSignal = bearishSignalValues > displacedSenkouA and bearishSignalValues < displacedSenkouB or bearishSignalValues < displacedSenkouA and bearishSignalValues > displacedSenkouB
weakBearishSignal = bearishSignalValues > displacedSenkouA and bearishSignalValues > displacedSenkouB
//#### Ends Here #####


//Higher High Lower Low Strategy
//#### Starts Here #####
lb = input.int(5, title='Left Bars', minval=1)
rb = input.int(5, title='Right Bars', minval=1)
showsupres = input.bool(true, title='Support/Resistance', inline='srcol')
supcol = input.color(color.lime, title='', inline='srcol')
rescol = input.color(color.red, title='', inline='srcol')
// srlinestyle = input.string(line.style_dotted, title='Line Style/Width', options=[line.style_solid, line.style_dashed, line.style_dotted], inline='style')
srlinewidth = input.int(3, title='', minval=1, maxval=5, inline='style')
changebarcol = input.bool(true, title='Change Bar Color', inline='bcol')
bcolup = input.color(color.blue, title='', inline='bcol')
bcoldn = input.color(color.black, title='', inline='bcol')

ph = ta.pivothigh(lb, rb)
pl = ta.pivotlow(lb, rb)

iff_3 = pl ? -1 : na  // Trend direction
hl = ph ? 1 : iff_3
iff_4 = pl ? pl : na  // similar to zigzag but may have multiple highs/lows
zz = ph ? ph : iff_4
valuewhen_1 = ta.valuewhen(hl, hl, 1)
valuewhen_2 = ta.valuewhen(zz, zz, 1)
zz := pl and hl == -1 and valuewhen_1 == -1 and pl > valuewhen_2 ? na : zz
valuewhen_3 = ta.valuewhen(hl, hl, 1)
valuewhen_4 = ta.valuewhen(zz, zz, 1)
zz := ph and hl == 1 and valuewhen_3 == 1 and ph < valuewhen_4 ? na : zz

valuewhen_5 = ta.valuewhen(hl, hl, 1)
valuewhen_6 = ta.valuewhen(zz, zz, 1)
hl := hl == -1 and valuewhen_5 == 1 and zz > valuewhen_6 ? na : hl
valuewhen_7 = ta.valuewhen(hl, hl, 1)
valuewhen_8 = ta.valuewhen(zz, zz, 1)
hl := hl == 1 and valuewhen_7 == -1 and zz < valuewhen_8 ? na : hl
zz := na(hl) ? na : zz

findprevious() =>  // finds previous three points (b, c, d, e)
    ehl = hl == 1 ? -1 : 1
    loc1 = 0.0
    loc2 = 0.0
    loc3 = 0.0
    loc4 = 0.0
    xx = 0
    for x = 1 to 1000 by 1
        if hl[x] == ehl and not na(zz[x])
            loc1 := zz[x]
            xx := x + 1
            break
    ehl := hl
    for x = xx to 1000 by 1
        if hl[x] == ehl and not na(zz[x])
            loc2 := zz[x]
            xx := x + 1
            break
    ehl := hl == 1 ? -1 : 1
    for x = xx to 1000 by 1
        if hl[x] == ehl and not na(zz[x])
            loc3 := zz[x]
            xx := x + 1
            break
    ehl := hl
    for x = xx to 1000 by 1
        if hl[x] == ehl and not na(zz[x])
            loc4 := zz[x]
            break
    [loc1, loc2, loc3, loc4]

float a = na
float b = na
float c = na
float d = na
float e = na
if not na(hl)
    [loc1, loc2, loc3, loc4] = findprevious()
    a := zz
    b := loc1
    c := loc2
    d := loc3
    e := loc4

_hh = zz and a > b and a > c and c > b and c > d
_ll = zz and a < b and a < c and c < b and c < d
_hl = zz and (a >= c and b > c and b > d and d > c and d > e or a < b and a > c and b < d)
_lh = zz and (a <= c and b < c and b < d and d < c and d < e or a > b and a < c and b > d)

plotshape(_hl, text='HL', title='Higher Low', style=shape.labelup, color=color.new(color.lime, 0), textcolor=color.new(color.black, 0), location=location.belowbar, offset=-rb)
plotshape(_hh, text='HH', title='Higher High', style=shape.labeldown, color=color.new(color.lime, 0), textcolor=color.new(color.black, 0), location=location.abovebar, offset=-rb)
plotshape(_ll, text='LL', title='Lower Low', style=shape.labelup, color=color.new(color.red, 0), textcolor=color.new(color.white, 0), location=location.belowbar, offset=-rb)
plotshape(_lh, text='LH', title='Lower High', style=shape.labeldown, color=color.new(color.red, 0), textcolor=color.new(color.white, 0), location=location.abovebar, offset=-rb)

float res = na
float sup = na
res := _lh ? zz : res[1]
sup := _hl ? zz : sup[1]

int trend = na
iff_5 = close < sup ? -1 : nz(trend[1])
trend := close > res ? 1 : iff_5

res := trend == 1 and _hh or trend == -1 and _lh ? zz : res
sup := trend == 1 and _hl or trend == -1 and _ll ? zz : sup
rechange = res != res[1]
suchange = sup != sup[1]

var line resline = na
var line supline = na
//#### Ends Here #####


//Range Filter 5Min
//#### Starts Here #####

src = input(defval=close, title='Source')
per = input.int(defval=100, minval=1, title='Sampling Period')

// Range Multiplier
mult = input.float(defval=3.0, minval=0.1, title='Range Multiplier')

// Smooth Average Range
smoothrng(x, t, m) =>
    wper = t * 2 - 1
    avrng = ta.ema(math.abs(x - x[1]), t)
    smoothrng = ta.ema(avrng, wper) * m
    smoothrng
smrng = smoothrng(src, per, mult)

// Range Filter
rngfilt(x, r) =>
    rngfilt = x
    rngfilt := x > nz(rngfilt[1]) ? x - r < nz(rngfilt[1]) ? nz(rngfilt[1]) : x - r : x + r > nz(rngfilt[1]) ? nz(rngfilt[1]) : x + r
    rngfilt
filt = rngfilt(src, smrng)

// Filter Direction
upward = 0.0
upward := filt > filt[1] ? nz(upward[1]) + 1 : filt < filt[1] ? 0 : nz(upward[1])
downward = 0.0
downward := filt < filt[1] ? nz(downward[1]) + 1 : filt > filt[1] ? 0 : nz(downward[1])

// Target Bands
hband = filt + smrng
lband = filt - smrng

// Colors
filtcolor = upward > 0 ? color.lime : downward > 0 ? color.red : color.orange
barcolor = src > filt and src > src[1] and upward > 0 ? color.lime : src > filt and src < src[1] and upward > 0 ? color.green : src < filt and src < src[1] and downward > 0 ? color.red : src < filt and src > src[1] and downward > 0 ? color.maroon : color.orange

// Break Outs
longCond = bool(na)
shortCond = bool(na)
longCond := src > filt and src > src[1] and upward > 0 or src > filt and src < src[1] and upward > 0
shortCond := src < filt and src < src[1] and downward > 0 or src < filt and src > src[1] and downward > 0

CondIni = 0
CondIni := longCond ? 1 : shortCond ? -1 : CondIni[1]
longCondition = longCond and CondIni[1] == -1
shortCondition = shortCond and CondIni[1] == 1
//#### Ends Here #####


//#### Starts Here #####
source = close
useCurrentRes = input(true, title='Use Current Chart Resolution?')
resCustom = input.timeframe(title='Use Different Timeframe? Uncheck Box Above', defval='60')
smd = input(true, title='Show MacD & Signal Line? Also Turn Off Dots Below')
sd = input(true, title='Show Dots When MacD Crosses Signal Line?')
sh = input(true, title='Show Histogram?')
macd_colorChange = input(true, title='Change MacD Line Color-Signal Line Cross?')
hist_colorChange = input(true, title='MacD Histogram 4 Colors?')

res1 = useCurrentRes ? timeframe.period : resCustom

fastLength = input.int(12, minval=1)
slowLength = input.int(26, minval=1)
signalLength = input.int(9, minval=1)

fastMA = ta.ema(source, fastLength)
slowMA = ta.ema(source, slowLength)

macd = fastMA - slowMA
signal = ta.sma(macd, signalLength)
hist = macd - signal

outMacD = request.security(syminfo.tickerid, res1, macd)
outSignal = request.security(syminfo.tickerid, res1, signal)
outHist = request.security(syminfo.tickerid, res1, hist)

histA_IsUp = outHist > outHist[1] and outHist > 0
histA_IsDown = outHist < outHist[1] and outHist > 0
histB_IsDown = outHist < outHist[1] and outHist <= 0
histB_IsUp = outHist > outHist[1] and outHist <= 0

//MacD Color Definitions
macd_IsAbove = outMacD >= outSignal
macd_IsBelow = outMacD < outSignal

plot_color = hist_colorChange ? histA_IsUp ? color.aqua : histA_IsDown ? color.blue : histB_IsDown ? color.red : histB_IsUp ? color.maroon : color.yellow : color.gray
macd_color = macd_colorChange ? macd_IsAbove ? color.lime : color.red : color.red
signal_color = macd_colorChange ? macd_IsAbove ? color.yellow : color.yellow : color.lime

circleYPosition = outSignal
//#### Ends Here #####


//////////////////
// Main Strategy
/////////////////
//#### Starts Here #####
var bottomText = 'Something is not ok'

bool rangeBuy = false
if longCondition
    rangeBuy := true
else
    rangeBuy := false

bool rangeSell = false
if shortCondition
    rangeSell := true
else
    rangeSell := false

bool ema100Bullish = false
bool ema100Bearish = false
bool ichimokuBearish = false
bool ichimokuBullish = false
string statusChance = 'Who knows what will happen'
string futureIchimokuTrend = 'Anything can happen'

if close > ema100
    ema100Bullish := true
    ema100Bearish := false
else
    ema100Bullish := false
    ema100Bearish := true

if displacedSenkouA > displacedSenkouB
    ichimokuBearish := false
    futureIchimokuTrend := 'Green - chance to go up'
    ichimokuBullish := true
else
    ichimokuBearish := true
    futureIchimokuTrend := 'Red - chance to go down'
    ichimokuBullish := false
    ichimokuBullish

if ema100Bullish and parabolicSARGreen
    if ichimokuBullish
        statusChance := '100%'
    else
        statusChance := '95%'
else
    if ema100Bullish and parabolicSARRed
        statusChance := '75%'
    else if ema100Bearish and parabolicSARGreen
        statusChance := '65%'
    else
        statusChance := '55%'

bool longTradePosition = false
bool shortTradePosition = false
string longTradeText = 'Now cannot say anything'

if (swingCallGreen or swingCallYellow) and ichimokuBullish and longCondition and ema100Bullish and parabolicSARGreen
    longTradePosition := true
    longTradeText := 'Bullish'

bottomText := longTradeText + ' Chance: ' + statusChance + '\n Future Trend: ' + futureIchimokuTrend
// Bottom Text

var tLog = table.new(position=position.bottom_right, rows=1, columns=2, bgcolor=color.blue, border_width=1)
table.cell(tLog, row=0, column=0, text=bottomText, text_color=color.white)
table.cell_set_text(tLog, row=0, column=0, text=bottomText)
//#### Ends Here #####

bool entryLongPosition = false
bool exitLongPosition = false

bool entryShortPosition = false
bool exitShortPosition = false

bool longPositionCount = false
bool shortPositionCount = false


if (strategy.position_size > 0)
    longPositionCount := true

if (strategy.position_size < 0)
    shortPositionCount := true

// Entry LONG
if (longCondition) and (not longPositionCount)
    entryLongPosition := true

// Exit LONG
if (shortCondition) and (longPositionCount)
    exitLongPosition := true

// Entry SHORT
if (shortCondition) and (not shortPositionCount)
    entryShortPosition := true

// Exit SHORT
if (longCondition) and (shortPositionCount)
    exitShortPosition := true

// LONG Entry & Exit
plotshape(entryLongPosition, style=shape.labeldown, location=location.abovebar, color=color.new(color.green, 0), size=size.tiny, title='buy label', text='5cel\nLONG Entry', textcolor=color.new(color.white, 0))
plotshape(exitLongPosition, style=shape.labelup, location=location.belowbar, color=color.new(color.blue, 0), size=size.tiny, title='sell label', text='5cel\nExit LONG', textcolor=color.new(color.white, 0))

//SHORT Entry & Exit
plotshape(entryShortPosition, style=shape.labeldown, location=location.abovebar, color=color.new(color.red, 0), size=size.tiny, title='buy label', text='5cel\nSHORT Entry', textcolor=color.new(color.white, 0))
plotshape(exitShortPosition, style=shape.labelup, location=location.belowbar, color=color.new(color.blue, 0), size=size.tiny, title='sell label', text='5cel\nExit SHORT', textcolor=color.new(color.white, 0))

//Get the Current Value
heikinashi_close = request.security(ticker.heikinashi(syminfo.tickerid), timeframe.period, close)

if entryLongPosition
    longLabel = label.new(bar_index, high, text=str.tostring(heikinashi_close, '0.00'), color=color.orange, style=label.style_label_down, yloc=yloc.abovebar)

if entryShortPosition
    shortLabel = label.new(bar_index, high, text=str.tostring(heikinashi_close, '0.00'), color=color.orange, style=label.style_label_down, yloc=yloc.abovebar)

/// SHORT Exit
strategy.close("short", when=exitShortPosition, comment="close_short_position")

/// LONG Exit
strategy.close("long", when=exitLongPosition, comment = "close_long_position")

/// LONG Enter
strategy.entry("long", strategy.long, when=entryLongPosition, comment="open_long_position")

/// SHORT Enter
strategy.entry("short", strategy.short, when = entryShortPosition, comment="open_short_position")