Chiến lược theo xu hướng dao động đảo ngược kép
Tổng quan
Chiến lược theo dõi xu hướng hai vòng xoáy xoáy bằng cách kết hợp tín hiệu hai vòng xoáy và chỉ số băng xoáy. Nó sử dụng hệ thống 123 xoáy để tạo ra tín hiệu xoáy, sau đó kết hợp với chỉ số Fractal Chaos Bands để lọc tín hiệu và theo dõi xu hướng. Chiến lược này có thể xác định cơ hội xoáy và theo dõi xu hướng, là một chiến lược giao dịch rất toàn diện.
Nguyên tắc chiến lược
123 hệ thống quay ngược
Hệ thống đảo ngược 123 có nguồn gốc từ Ulf Jensen trong cuốn sách Làm thế nào tôi có được lợi nhuận gấp ba lần trong thị trường tương lai.
Khi giá đóng cửa 2 ngày liên tiếp cao hơn giá đóng cửa ngày trước và đường Slow K dưới 50 ngày 9, hãy làm nhiều; Khi giá đóng cửa 2 ngày liên tiếp thấp hơn giá đóng cửa ngày trước và đường Fast K trên 50 ngày 9, hãy làm trống.
Phần này chủ yếu sử dụng chỉ số dao động Stochastic để tạo tín hiệu trong khu vực quá mua quá bán. Khi cổ phiếu tăng liên tục nhưng chỉ số dao động Stochastic cho thấy vẫn còn nhiều chỗ để tăng, hãy thực hiện chiến lược lạc quan; Khi cổ phiếu giảm liên tục nhưng chỉ số dao động Stochastic cho thấy vẫn còn nhiều chỗ để giảm, hãy thực hiện chiến lược giảm giá.
Chỉ số Fractal Chaos Bands
Chỉ số Fractal Chaos Bands định hướng thị trường bằng cách vẽ các điểm cao nhất và thấp nhất của giá cổ phiếu, tạo thành đường lên và đường xuống. Các quy tắc cụ thể là:
Khi giá tăng, bạn làm nhiều hơn; khi giá giảm, bạn làm ít hơn.
Phần này chủ yếu được sử dụng như một bộ lọc xu hướng, kết hợp với tín hiệu đảo ngược 123.
Lợi thế chiến lược
- Kết hợp đảo ngược và xu hướng, nắm bắt cơ hội
Chiến lược theo dõi xu hướng hai vòng xoáy xoáy có thể nắm bắt cả cơ hội đảo ngược và theo dõi xu hướng, rất toàn diện. Các tín hiệu giao dịch có thể được lấy bất kể thị trường có ở trạng thái rung động hay xu hướng.
- Giảm tín hiệu sai, tăng tỷ lệ thắng
So với chỉ số đơn, chiến lược này có thể làm giảm đáng kể tín hiệu giả và tăng tỷ lệ thắng và lợi nhuận của giao dịch thực tế bằng cách lọc kết hợp các chỉ số kép.
- Điều chỉnh tham số linh hoạt, thích ứng mạnh
Các tham số của chiến lược theo dõi xu hướng hai vòng xoáy xoáy được hiểu rất rõ, người dùng có thể điều chỉnh theo nhu cầu của mình và môi trường thị trường, rất linh hoạt. Cho dù là thị trường rung động hay thị trường xu hướng, có thể điều chỉnh thông qua các tham số thích ứng.
Rủi ro và tối ưu hóa
- Không thể thích nghi với xu hướng lớn
Chính chiến lược này phụ thuộc nhiều hơn vào các cơ hội giao dịch ngắn và trung. Trong một xu hướng thị trường lớn, chiến lược này có thể tạo ra quá nhiều tín hiệu đảo ngược và dừng giao dịch. Điều này có thể được tối ưu hóa bằng cách điều chỉnh tham số.
- Cần hỗ trợ tài chính cận biên
Phương pháp theo dõi xu hướng hai vòng xoáy ngược là một loại giao dịch thường xuyên, cần có đủ tiền biên để hỗ trợ nhu cầu bảo đảm vị trí. Đối với người dùng không đủ tiền, có thể cần giảm vị trí thích hợp.
- Có thể kết hợp nhiều bộ lọc chỉ số
Chiến lược này có thể dựa trên cơ sở hiện tại, giới thiệu nhiều loại chỉ số khác nhau để làm phong phú nguồn tín hiệu và tăng sự ổn định của chiến lược. Ví dụ: thêm chỉ số năng lượng, chỉ số dao động để kiểm tra các tín hiệu đảo ngược và xu hướng.
Tóm tắt
Chiến lược theo dõi xu hướng hai vòng xoáy xoáy xoáy xoáy xoáy xoáy xoáy xoáy xoáy xoáy xoáy xoáy xoáy xoáy xoáy xoáy xoáy xoáy xoáy xoáy xoáy xoáy xoáy xoáy xoáy xoáy xoáy xoáy xoáy xoáy xoáy xoáy xoáy xoáy xoáy xoáy xoáy xoáy xoáy xoáy xoáy xoáy xoáy xoáy xoáy xoáy xoáy xoáy xoáy xoáy xoáy xoáy xoáy xoáy xoáy xoáy xoáy xoáy xoáy xoáy xoáy xoáy xoáy xoáy xoáy xoáy xoáy xoáy xoáy xoáy xoáy xoáy xoáy xoáy xoáy xoáy xoáy xoáy xoáy xoáy xoáy xoáy xoáy xoáy xoáy xoáy xoáy xoáy xoáy xoáy xoáy xoáy xoáy xoáy xoáy xoáy xoáy xoáy xoáy xoáy xoáy xoáy xoáy xoáy xoáy xoáy xoáy xoáy xoáy xoáy xoáy xoáy xoáy xoáy xoáy xoáy xoáy xoáy xoáy xoáy xoáy xoáy xoáy xo
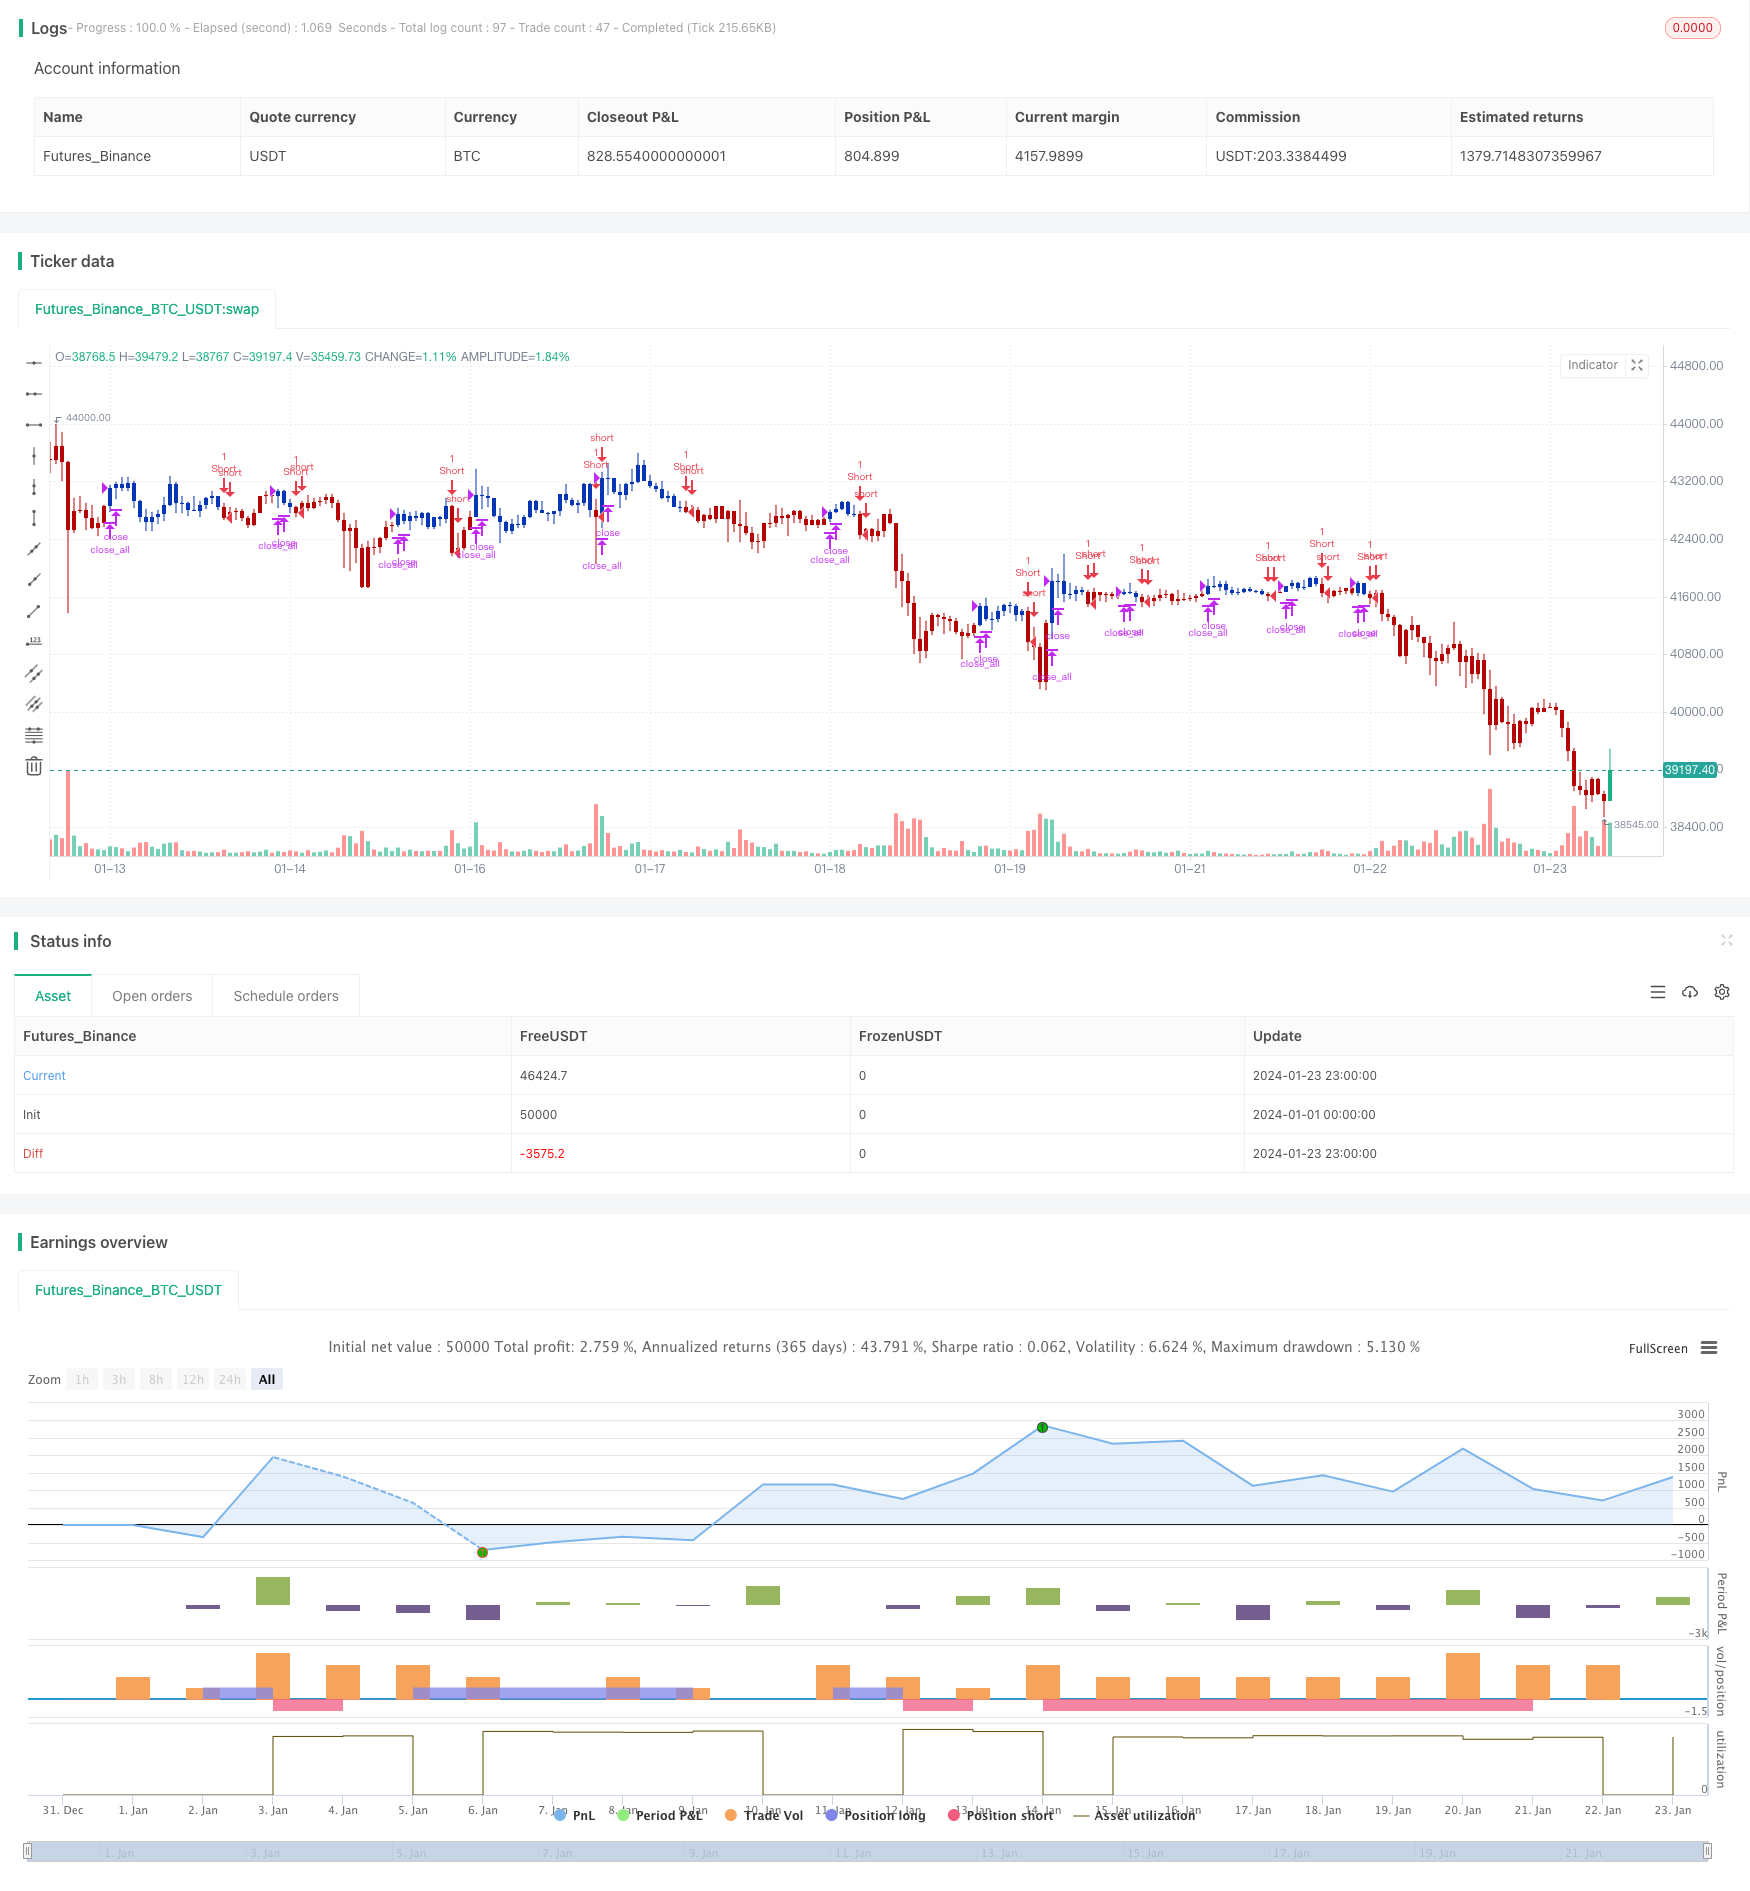
/*backtest
start: 2024-01-01 00:00:00
end: 2024-01-24 00:00:00
period: 1h
basePeriod: 15m
exchanges: [{"eid":"Futures_Binance","currency":"BTC_USDT"}]
*/

//@version=4
////////////////////////////////////////////////////////////
//  Copyright by HPotter v1.0 21/09/2020
// This is combo strategies for get a cumulative signal.
//
// First strategy
// This System was created from the Book "How I Tripled My Money In The
// Futures Market" by Ulf Jensen, Page 183. This is reverse type of strategies.
// The strategy buys at market, if close price is higher than the previous close
// during 2 days and the meaning of 9-days Stochastic Slow Oscillator is lower than 50.
// The strategy sells at market, if close price is lower than the previous close price
// during 2 days and the meaning of 9-days Stochastic Fast Oscillator is higher than 50.
//
// Second strategy
//  Stock market moves in a highly chaotic way, but at a larger scale, the movements
// follow a certain pattern that can be applied to shorter or longer periods of time
// and we can use Fractal Chaos Bands Indicator to identify those patterns. Basically,
// the Fractal Chaos Bands Indicator helps us to identify whether the stock market is
// trending or not. When a market is trending, the bands will have a slope and if market
// is not trending the bands will flatten out. As the slope of the bands decreases, it
// signifies that the market is choppy, insecure and variable. As the graph becomes more
// and more abrupt, be it going up or down, the significance is that the market becomes
// trendy, or stable. Fractal Chaos Bands Indicator is used similarly to other bands-indicator
// (Bollinger bands for instance), offering trading opportunities when price moves above or
// under the fractal lines.
//
// The FCB indicator looks back in time depending on the number of time periods trader selected
// to plot the indicator. The upper fractal line is made by plotting stock price highs and the
// lower fractal line is made by plotting stock price lows. Essentially, the Fractal Chaos Bands
// show an overall panorama of the price movement, as they filter out the insignificant fluctuations
// of the stock price.
//
// WARNING:
// - For purpose educate only
// - This script to change bars colors.
////////////////////////////////////////////////////////////
Reversal123(Length, KSmoothing, DLength, Level) =>
    vFast = sma(stoch(close, high, low, Length), KSmoothing)
    vSlow = sma(vFast, DLength)
    pos = 0.0
    pos := iff(close[2] < close[1] and close > close[1] and vFast < vSlow and vFast > Level, 1,
	         iff(close[2] > close[1] and close < close[1] and vFast > vSlow and vFast < Level, -1, nz(pos[1], 0)))
	pos

fractalUp(pattern) =>
    p = high[pattern+1]
    okl = 1
    okr = 1
    res = 0.0
	for i = pattern to 1
		okl := iff(high[i] < high[i+1] and okl == 1 , 1, 0)
	for i = pattern+2 to pattern*2+1
		okr := iff(high[i] < high[i-1] and okr == 1, 1, 0)
	res := iff(okl == 1 and okr == 1, p, res[1])
    res

fractalDn(pattern) =>
    p = low[pattern+1]
    okl = 1
    okr = 1
    res =0.0
	for i = pattern to 1
		okl := iff(low[i] > low[i+1] and okl == 1 , 1, 0)
	for i = pattern+2 to pattern*2+1
		okr := iff(low[i] > low[i-1] and okr == 1, 1, 0)
	res := iff(okl == 1 and okr == 1, p, res[1])
    res

FCB(Pattern) =>
    pos = 0.0
    xUpper = fractalUp(Pattern)
    xLower = fractalDn(Pattern)
    pos := iff(close > xUpper, 1,
             iff(close < xLower, -1, nz(pos[1], 0)))
    pos

strategy(title="Combo Backtest 123 Reversal & Fractal Chaos Bands", shorttitle="Combo", overlay = true)
Length = input(15, minval=1)
KSmoothing = input(1, minval=1)
DLength = input(3, minval=1)
Level = input(50, minval=1)
//-------------------------
Pattern = input(1, minval=1)
reverse = input(false, title="Trade reverse")
posReversal123 = Reversal123(Length, KSmoothing, DLength, Level)
posFCB = FCB(Pattern)
pos = iff(posReversal123 == 1 and posFCB == 1 , 1,
	   iff(posReversal123 == -1 and posFCB == -1, -1, 0))
possig = iff(reverse and pos == 1, -1,
          iff(reverse and pos == -1 , 1, pos))
if (possig == 1)
    strategy.entry("Long", strategy.long)
if (possig == -1)
    strategy.entry("Short", strategy.short)
if (possig == 0)
    strategy.close_all()
barcolor(possig == -1 ? #b50404: possig == 1 ? #079605 : #0536b3 )